
Hello! Welcome to your sixth lesson.
In our last lesson, we focused on the power of the instrumentation amplifier and its high Common-Mode Rejection Ratio (CMRR) to combat common-mode noise like power-line hum. While CMRR is a formidable defense, it's not a silver bullet. Real-world signals are plagued by a host of other noise sources that can degrade data quality.
This lesson concludes our first module, "Foundations of Biomedical Measurement," by addressing the learning outcome: Identify common sources of noise in biomedical measurements and calculate the signal-to-noise ratio (SNR). We will create a catalog of the most common culprits—from the environment, the patient, and the electronics themselves. Then, we'll learn how to quantify their impact using SNR, a crucial metric for evaluating the quality of any measurement. For your work at Neuraease, being able to diagnose noise and objectively measure signal quality is fundamental to developing a reliable product.
What is "Noise" in a Biomedical Context?
Before we dive in, it's useful to have clear definitions. A signal might contain many components, but "noise" is anything that isn't the specific information you're trying to extract.
To formalize this, please read the brief definitions provided in the following document from the University of Oxford.
Event detection - Noise sources & signal quality
This document, 'Event detection - Noise sources & signal quality,' provides clear, academic definitions for key terms. This will help us establish a shared vocabulary.
Read the section under the heading 'Some definitions:'. Focus on the distinctions between 'Data', 'Information', 'Noise', and 'Artifact'.
In short, one person's signal can be another's noise. For example, if you're measuring ECG, the electrical activity from chest muscles (EMG) is noise. But if you're studying muscle fatigue, that EMG is the signal.
A Catalog of Common Noise Sources
We can group noise sources into three main categories:
- Environmental (Extrinsic) Noise: Interference coupled into the system from the outside world.
- Physiological Artifacts: Unwanted signals generated by the body.
- Intrinsic Noise: Noise generated by the electronic components themselves.
Let's explore each of these categories.
1. Environmental Noise: Grounding and Shielding
As we discussed in the last lesson, the body acts as an antenna, picking up environmental noise. The most significant sources are related to AC power.
3 Sources of Noise in Biomedical Measurement Systems
The article '3 Sources of Noise in Biomedical Measurement Systems' provides an excellent overview of how environmental noise gets into our circuits and how to prevent it. This is a practical refresher on concepts from your ECE background.
Read the entire short article. Pay close attention to the diagrams and the solutions offered for each problem: Improper Grounding: Understand what a ground loop is and why single-point grounding is critical. Electrostatic Coupling: See how shielding protects signal wires from electric fields. Electromagnetic Coupling: Understand why twisting signal wires together is effective against magnetic fields.
The key takeaways from this reading should be that proper system design—single-point grounding, shielded cables, and twisted-pair wiring—is your first and best line of defense against environmental noise.
2. Physiological Artifacts: The Body in Motion
For any wearable device, the user is not a static object. Movement and other biological processes create powerful artifacts that can easily swamp the tiny signal of interest.
The following video gives a powerful demonstration of these artifacts in an ECG recording. The principles are directly applicable to EEG, EMG, or any other surface potential measurement.
ECG: common artefacts and how to avoid them
In 'ECG: common artefacts and how to avoid them' from BPM biosignals, you will see a live demonstration of several key artifacts and practical ways to mitigate them.
Please watch from 00:51 to 06:56, which covers three major artifacts: Poor Electrode Contact (00:51 - 02:40): See how a dried-out electrode fails to reject common-mode noise. Muscle (EMG) Artifacts (02:40 - 05:25): Observe how muscle activity creates significant noise and how moving the electrode away from the muscle helps. Cable Motion Artifacts (05:25 - 06:56): Notice how simple cable movement introduces noise and how securing the cable minimizes it.
Other significant physiological artifacts include:
- Baseline Wander: A slow drift in the signal's baseline, often caused by respiration.
- EOG (Electrooculography) Artifacts: Electrical signals from eye movements that are a major source of contamination in EEG recordings. We'll discuss this more in Module 5.
3. Intrinsic Noise: The Limits of Electronics
Even with perfect shielding and a perfectly still subject, your measurement will still contain noise generated by the electronic components. The two most important types are:
- Thermal Noise (Johnson-Nyquist Noise): Caused by the thermal agitation of charge carriers in resistors. It is broadband ("white noise") and its power is proportional to temperature and resistance.
- 1/f Noise (Flicker Noise): An intrinsic semiconductor noise that is most prominent at low frequencies. Its power is inversely proportional to frequency (hence "1/f").
For your work with EEG, which involves very low-frequency signals (often below 40 Hz), 1/f noise is a critical concern.
The video '1/F flicker noise' by Texas Instruments provides a detailed look at this important noise source. While it's technical, it explains why this noise is so dominant in low-frequency applications.
Watch the following segments: Introduction (00:00 - 01:34): Get a basic definition of 1/f noise and see how it's represented in datasheets. Long-Term Effects (07:27 - 10:45): This is a key section. Understand the concept that 1/f noise accumulates over time—the longer you measure, the more low-frequency noise you see. This is crucial for long-term monitoring applications. Zero-Drift Solution (12:33 - 14:15): Briefly see how specialized 'zero-drift' amplifiers are designed to eliminate 1/f noise, which is why they are often used in high-precision DC or low-frequency applications.
Quantifying Signal Quality: The Signal-to-Noise Ratio (SNR)
Identifying noise sources is the first step. The next is to quantify how much our signal is affected. The Signal-to-Noise Ratio (SNR) is the universal metric for this. It compares the level of a desired signal to the level of background noise.
SNR is defined as the ratio of signal power to noise power:
Since power is proportional to the square of the voltage amplitude (), we can also express it in terms of voltage:
Where is the Root Mean Square voltage.
Like CMRR, SNR is almost always expressed in decibels (dB):
A higher SNR means a cleaner signal. An SNR of 0 dB means the signal and noise have equal power.
The image below gives a practical illustration of how you might estimate SNR from a waveform.
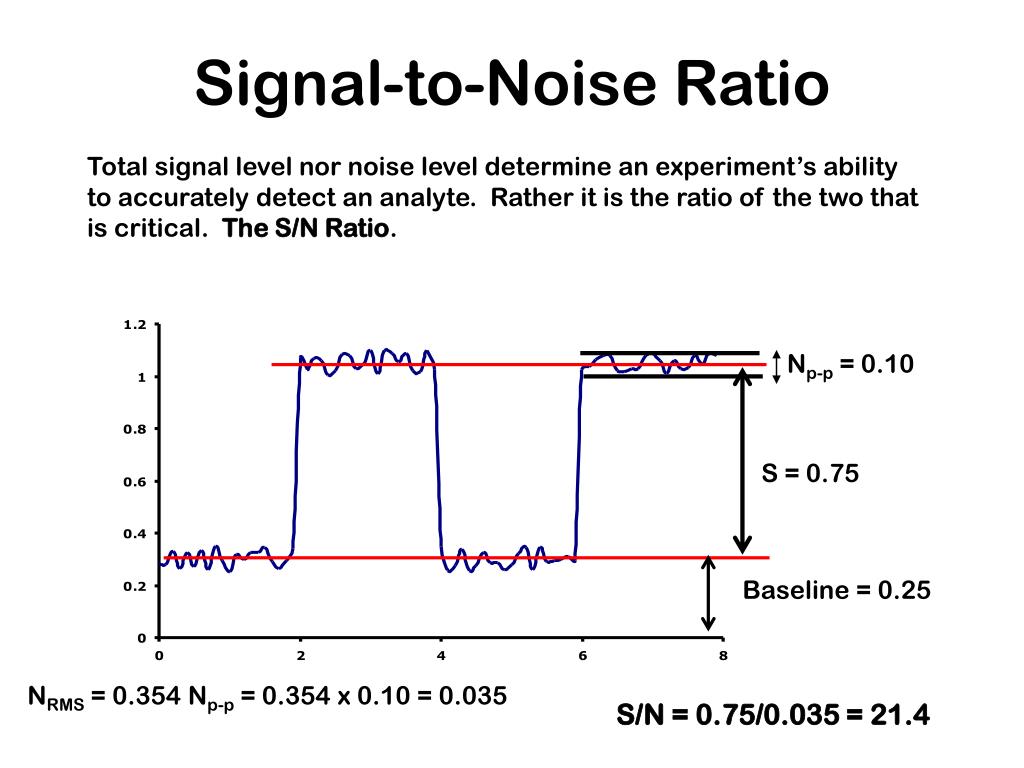
A common rule of thumb for noise that has a bell-shaped (Gaussian) distribution is that the peak-to-peak value is about 6 times the RMS value. This is the basis for the calculation shown in the image.
Test your understanding!
You are evaluating a prototype for the Neuraease device. You record an alpha-wave EEG signal, which is prominent during relaxed states.
- From your oscilloscope, you measure the peak-to-peak amplitude of the 10 Hz alpha wave () to be 80 µV.
- You also observe a noisy fluctuation on the signal, measuring its peak-to-peak value () as 42 µV.
- What is the RMS voltage of the signal? (For a sine wave, ).
- What is the estimated RMS voltage of the noise?
- What is the SNR in decibels?
Show answer
-
Signal RMS Voltage:
The peak voltage of the signal is half the peak-to-peak value: . -
Noise RMS Voltage:
Using the 6-to-1 rule of thumb: -
SNR in Decibels:
This SNR is positive, indicating the signal is stronger than the noise, but it's not very high. This suggests that further noise reduction techniques would be beneficial.
Conclusion
This lesson completes our foundational module on biomedical measurement. We have moved from the ideal to the real, acknowledging the myriad sources of noise that threaten to corrupt our data. By systematically identifying these sources and quantifying their impact with SNR, we can begin the process of intelligent signal processing and system design.
Key Takeaways:
- Noise sources are diverse: They come from the environment (power lines, EM fields), the subject (motion, EMG, respiration), and the electronics (thermal, 1/f noise).
- Low-frequency signals like EEG are especially vulnerable to 1/f noise, which increases as the measurement duration gets longer.
- Good practice is the first defense: Proper grounding, shielding, cable management, and electrode placement are non-negotiable for low-noise measurements.
- Signal-to-Noise Ratio (SNR) is the essential metric for quantifying signal quality, calculated as the ratio of signal power to noise power and expressed in dB.
Preview of the Next Lesson:
We have now built a complete conceptual framework for acquiring a biopotential signal: we know how to amplify it, filter it, and protect it from noise. Now, we will pivot from the "how" of measurement to the "what." In our next lesson, we begin Module 2, "Sensing Bioelectric Potentials," by exploring the fundamental origin of these signals with the topic: Explain the ionic basis of resting and action potentials in excitable cells (neurons, muscle cells). This dive into cellular electrophysiology will reveal how life itself generates the electricity we aim to measure.
Can't find a good explanation? Sign up and we'll make it for you
Sign up