
Hello! Welcome to your second lesson in Medical Instrumentation.
In our last session, we explored the fundamental challenges of measuring signals from the human body. We saw that physiological signals are often weak, variable, and buried in noise and artifacts, and that patient safety is a non-negotiable design constraint.
Today, we will build directly on that foundation. Our goal is to define the key characteristics of biomedical signals, specifically their typical amplitude and frequency ranges. This addresses the next learning outcome in our module. By putting concrete numbers to concepts like "low signal strength," you'll understand the precise specifications that biomedical instruments must meet. For your work at Neuraease, this knowledge is the first step in designing hardware that can successfully capture and interpret the faint electrical whispers of the nervous system.
A Landscape of Biomedical Signals
The human body generates a wide variety of signals that can provide diagnostic information. While our main focus will be on electrical signals, it's useful to see the broader context.
To start, please review this short document which categorizes the main types of biomedical signals.
module -2 bioelectric signals and electrodes
This document, 'module -2 bioelectric signals and electrodes', provides a clear overview of the different sources of biomedical signals.
Please read section 2.1, 'Sources of Biomedical Signals'. It starts on page 2 and is less than a page long. You'll see signals categorized as Bioelectric, Bioacoustic, Biomechanical, and more.
As you saw, signals can originate from electrical, mechanical, acoustic, or chemical phenomena. In this course, and for your work with neurotechnology, we are most interested in bioelectric signals. These are the signals generated by the coordinated action of excitable cells like neurons and muscle cells.
The Two Defining Features: Amplitude and Frequency
When we describe any signal, from a radio wave to an EEG, two of the most fundamental characteristics are its amplitude and frequency.
- Amplitude: This is the magnitude or "strength" of the signal, usually measured in volts (V), millivolts (mV, V), or microvolts (µV, V). In our previous lesson, we discussed the challenge of "low signal strength"—amplitude is the metric we use to quantify that.
- Frequency: This is the rate at which the signal oscillates or changes, measured in Hertz (Hz), or cycles per second. The frequency content of a signal tells us how rapidly the underlying physiological process is occurring.
To make this tangible, look at the following image showing a respiration signal. Although it's a biomechanical signal (measuring chest movement), it provides an excellent visual analogy for amplitude and frequency.

Characteristics of Common Bioelectric Signals
Now, let's apply these concepts to the bioelectric signals that are central to medical instrumentation. The following research article contains an excellent table summarizing the characteristics of the most important signals.
Advanced Bioelectrical Signal Processing Methods
The article 'Advanced Bioelectrical Signal Processing Methods' contains a comprehensive table that neatly summarizes the origin, frequency, and amplitude of various bioelectric signals. This is a core reference for this topic.
Please find and study 'Table 1. Classification of bioelectrical signals' in the 'Bioelectrical Signals' subsection. Focus on the rows for ECG, EEG, EMG, and EOG, noting their frequency range and typical amplitude.
Based on that table and other resources, here is a summary of the key signals. I've highlighted the ones most relevant to your work.
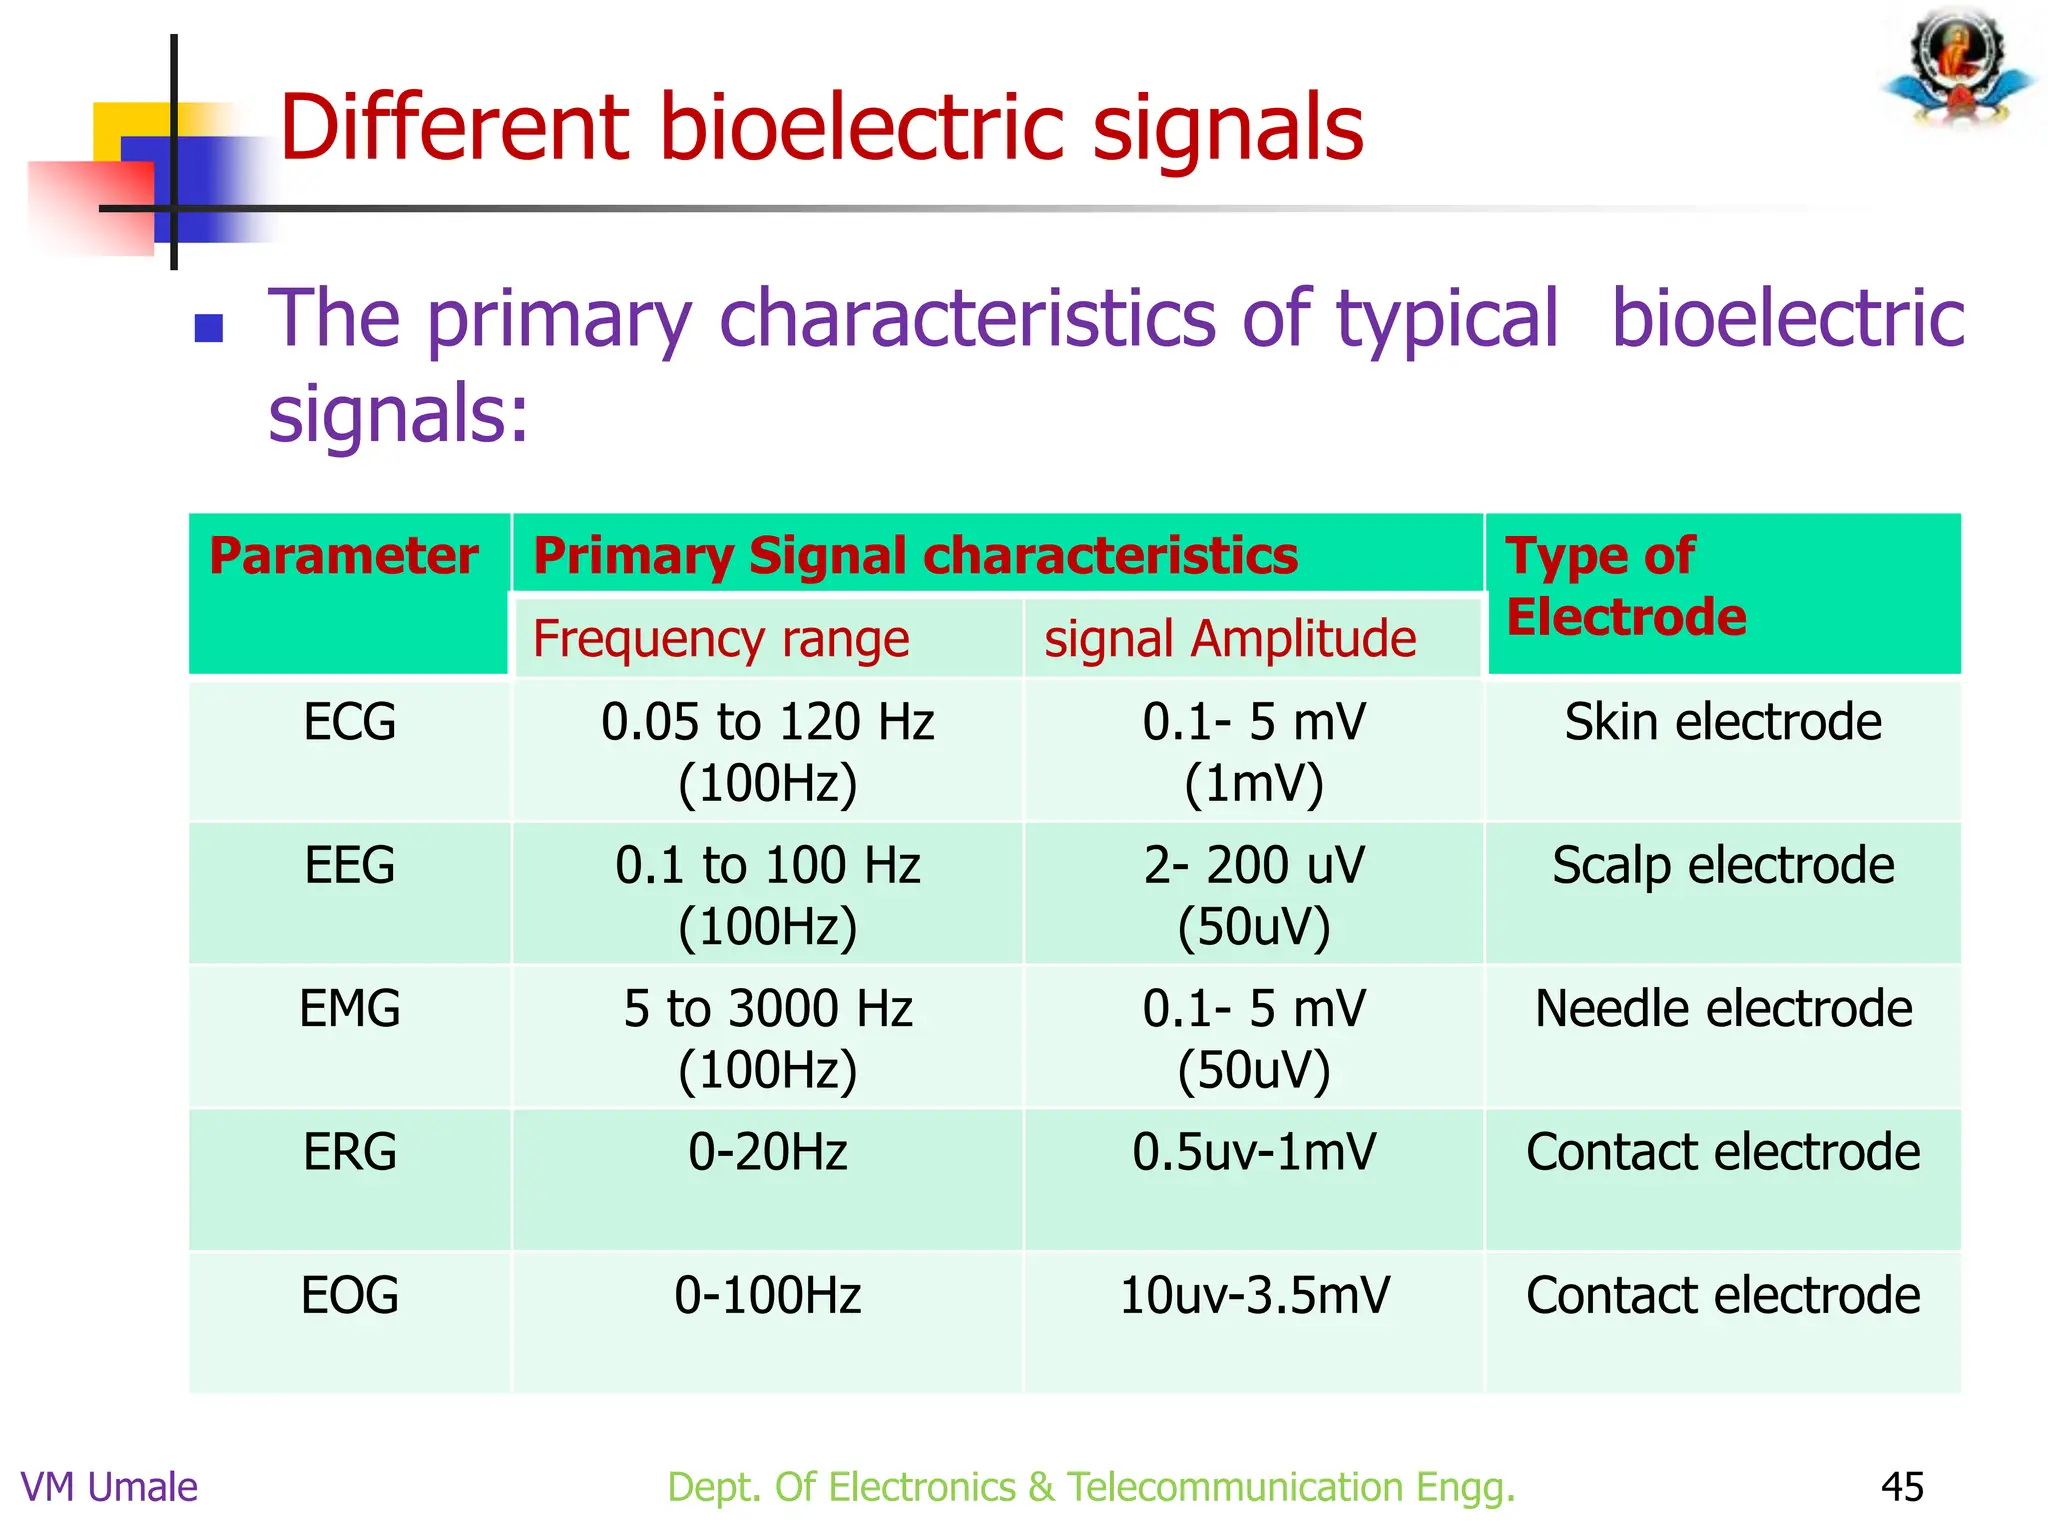
| Signal | Name | Origin | Typical Amplitude | Typical Frequency Range |
|---|---|---|---|---|
| ECG | Electrocardiogram | Heart muscle | 0.5 – 4 mV | 0.05 – 150 Hz |
| EEG | Electroencephalogram | Brain neurons | 10 – 100 µV | 0.5 – 100 Hz |
| EMG | Electromyogram | Skeletal muscle | 0.1 – 5 mV | 0 – 10,000 Hz (surface) |
| EOG | Electrooculogram | Eye muscles | 0.05 – 3.5 mV | DC – 100 Hz |
| ERG | Electroretinogram | Retina of the eye | 0 – 900 µV | DC – 50 Hz |
Notice the enormous differences! The ECG signal from the heart is about 100 times stronger than the EEG signal from the brain. This is why you can't use the same instrument to measure both without significant adjustments. The EMG signal from muscle activity is also much larger than EEG, which reinforces why muscle artifacts (like from jaw clenching) can so easily contaminate an EEG recording.
A Deeper Look at EEG Signals
Given your focus on neurotechnology, let's explore the characteristics of EEG in more detail. Its low amplitude makes it challenging to measure, but its frequency content is incredibly rich with information about cognitive and emotional states.
This next video provides a great explanation of where EEG signals come from and breaks down the different frequency bands.
EEG (Electroencephalogram) Explained
The video 'EEG (Electroencephalogram) Explained' by Zachary Cortex provides a clear, concise overview of how EEG signals are generated and analyzed. It connects the key frequency bands directly to mental states, which is highly relevant for your startup.
Please watch from 04:11 to 05:37. This segment covers: The concepts of signal amplitude and frequency. The five key EEG frequency bands (Delta, Theta, Alpha, Beta, Gamma) and the cognitive states they are associated with.
As the video explained, the EEG signal is not monolithic; it's a composite of different underlying rhythms. Analyzing the power in these specific frequency bands is a cornerstone of EEG analysis, often called Quantitative EEG (qEEG).
Here is a summary of those bands, which are critical for interpreting brain activity:
- Delta (δ): 0.5 – 4 Hz. Associated with deep, dreamless sleep and in some cases, brain injury.
- Theta (θ): 4 – 8 Hz. Associated with drowsiness, light sleep, deep meditation, and the creative state.
- Alpha (α): 8 – 13 Hz. The "idling" rhythm. Dominant during calm, relaxed wakefulness with eyes closed. It is suppressed by opening the eyes or mental effort.
- Beta (β): 13 – 30 Hz. Associated with normal waking consciousness, alertness, logical thinking, and concentration. High-beta can be linked to anxiety or stress.
- Gamma (γ): > 30 Hz. Associated with "binding" information from different parts of the brain, high-level information processing, and intense concentration.
For a device like the one you're developing at Neuraease, you wouldn't just be looking at the raw EEG signal. You would be processing it to see, for example, if the ratio of Beta to Alpha power is increasing, which could be a quantitative marker for rising stress or agitation.
Test your understanding!
You are designing an amplifier for a wearable device that needs to capture EEG signals from the forehead to monitor focus. Based on the typical characteristics of bioelectric signals, what are the two main challenges your amplifier's design must address simultaneously, especially considering the location?
Show answer
The two main challenges are:
- Extremely Low Amplitude: The amplifier needs very high gain to make the tiny ~50 µV EEG signals large enough to be processed, but without introducing its own noise.
- Artifact Rejection: The forehead is a hotspot for strong artifacts. The amplifier must be able to handle and reject much larger signals from eye blinks (EOG) and forehead muscle tension (EMG), which have amplitudes in the millivolt range—orders of magnitude larger than the target EEG signal. The frequency bands of these artifacts can also overlap with the EEG bands of interest.
To help you keep these numbers straight, here is a helpful summary table.
Conclusion
Today, we've moved from the qualitative challenges of biomedical measurement to the quantitative specifics. Understanding these signal characteristics is not just academic; it dictates the engineering requirements for every component in a measurement system.
Key Takeaways:
- Biomedical signals are classified by their origin, with bioelectric signals being a key category for diagnostics and neurotechnology.
- All bioelectric signals are characterized by their amplitude (strength) and frequency (rate of change).
- These characteristics vary dramatically between signal types. ECG signals are in the millivolt range, while EEG signals are in the microvolt range, making them much harder to measure.
- The frequency content of EEG is divided into bands (Delta, Theta, Alpha, Beta, Gamma) that correlate with different cognitive and physiological states. This is the basis for using EEG to monitor states like stress, relaxation, and focus.
Preview of the Next Lesson:
We've now established that we need to measure signals that are incredibly weak (microvolts) and exist within specific frequency bands. How do we build electronics that can do this? In our next lesson, we will introduce the fundamental building block for this task: the Operational Amplifier (op-amp). You'll learn how to analyze basic op-amp circuits to achieve the high gain and filtering needed to rescue these faint physiological signals from the noise.
Can't find a good explanation? Sign up and we'll make it for you
Sign up