
Good to see you again. In the previous lesson, you learned to establish a binary’s static facts: whether it is an x86-64 ELF, whether it is dynamically linked, whether its main executable is PIE, and which mitigations checksec reports. Those facts describe what the loader can do. This lesson moves to the running process, where you will verify what it did do.
By the end, you should be able to read /proc/<pid>/maps or GEF’s vmmap, identify the main executable, libc, dynamic loader, heap, stack, and special kernel mappings, then compare fresh runs to determine which addresses ASLR actually randomizes. This is the evidence behind decisions such as “this gadget address can be static” or “I need an information leak first.”
ASLR changes locations, not a module’s internal layout
Address Space Layout Randomization (ASLR) makes memory-corruption exploitation harder by varying important process addresses between executions. An overwritten return address, function pointer, or data pointer is useful only if it points somewhere meaningful. ASLR removes the assumption that an address discovered once will still be valid next run.
The crucial distinction is between an object’s base address and its offsets.
Suppose a function lies at offset from the beginning of a PIE executable. Across executions, the function’s absolute address changes because the executable’s base changes. But the function’s relative position remains .
The same rule applies to libc. A function such as system has a fixed offset inside one specific libc build, while libc’s runtime base usually changes from run to run.
This distinction will later support information-leak exploits: a leak of one address inside a module can reveal that module’s base, which in turn recovers the addresses of other known offsets. For now, stay disciplined: a map tells you where things are this run; comparing maps tells you whether you may rely on that address next run.
Watch this short demonstration before inspecting maps yourself.
Cannot access memory at address // Debugging PIE Binaries affected by ASLR - bin 0x2E
Watch “pwn.college - Memory Errors - ASLR” by pwn.college for a compact visual explanation of why randomized layouts frustrate control-flow hijacking.
Watch the ASLR idea to connect pointer overwrites with the need for known target addresses. Then watch the repeated runs, where the same program is executed more than once and its changing program, library, and stack locations are observed. Focus on the difference between a stable offset within a binary and a changing runtime address.
Reading a process map
Linux exposes a process’s virtual-memory mappings through:
cat /proc/<pid>/maps
For a paused process, GEF offers a more readable view:
gef➤ vmmap
You can also use GDB’s built-in alternative:
(gdb) info proc mappings
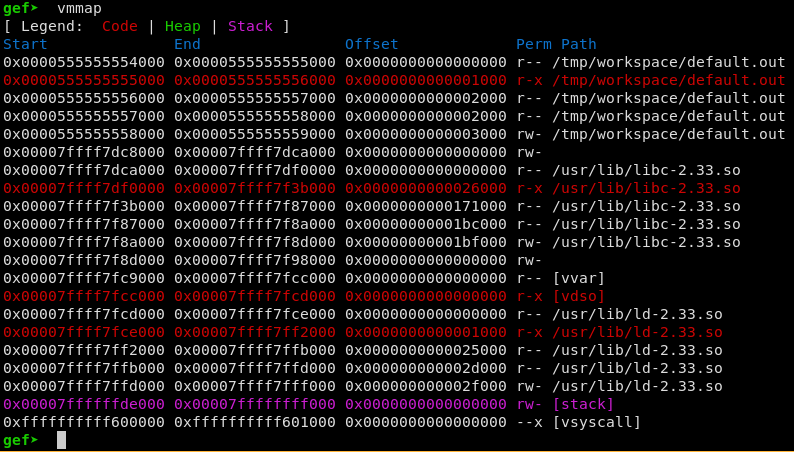
A standard /proc/<pid>/maps line resembles:
555555555000-555555556000 r-xp 00001000 08:01 123456 /home/user/chal
The fields mean:
| Field | Example | Meaning |
|---|---|---|
| Address range | 555555555000-555555556000 | Start and end of this virtual-memory mapping |
| Permissions | r-xp | Readable, executable, private mapping |
| File offset | 00001000 | Offset in the backing file corresponding to this mapping |
| Device and inode | 08:01 123456 | Identity of the backing filesystem object |
| Path or label | /home/user/chal | File backing the mapping, or a special label such as [stack] |
The permission field has four characters:
| Character position | Possible values | Meaning |
|---|---|---|
| First | r or - | Read permission |
| Second | w or - | Write permission |
| Third | x or - | Execute permission |
| Fourth | p or s | Private copy-on-write mapping, or shared mapping |
For ordinary ELF targets, it is normal to see multiple map lines bearing the same executable path. This is not multiple copies of the binary. It reflects separate LOAD segments with different protections: read-only headers and metadata, executable code, read-only data, and writable data.
For example, a PIE binary may produce a pattern similar to:
555555554000-555555555000 r--p 00000000 ... /home/user/pie
555555555000-555555556000 r-xp 00001000 ... /home/user/pie
555555556000-555555557000 r--p 00002000 ... /home/user/pie
555555557000-555555558000 rw-p 00003000 ... /home/user/pie
Do not treat the beginning of the r-xp line as automatically being the executable’s image base. In this example, the first mapping with offset 00000000 begins at 0x555555554000; the executable code begins one page later because its executable segment begins at file offset 0x1000.
For normal PIE triage, use the lowest mapping for the target file whose offset is zero as the practical image-base reference, then confirm unusual cases with readelf -lW. The static addresses you see in Ghidra or readelf are converted to runtime addresses using the executable’s load base.
Major regions you should recognize immediately
A pwn-oriented map reading should quickly label the regions below.
Main executable
Mappings whose pathname is your target binary represent the main program image. Their behavior depends on whether the binary is PIE:
- A non-PIE
ET_EXECmain executable commonly remains at a fixed location, often around0x400000on x86-64. - A PIE
ET_DYNmain executable receives a randomized load base under normal ASLR conditions.
The executable’s segments still keep their relative arrangement. Code does not randomly move independently from .rodata or .bss; the image is relocated as a unit.
Shared libraries and the dynamic linker
A dynamically linked program will commonly map:
libc.so.6- other dependencies such as
libpthread,libm, orlibstdc++ - the runtime dynamic linker, often named
ld-linux-x86-64.so.2
Each shared object has several mappings, usually beginning with a read-only mapping and including an r-xp code mapping. Their runtime bases are normally randomized by ASLR even if the main executable is a non-PIE binary.
This matters for ret2libc: a hardcoded address of system from one process is not a reliable system address in a fresh process. The offset of system within the same libc file remains stable; libc’s base does not.
Heap
A typical heap line looks like:
55c7304ef000-55c730510000 rw-p 00000000 00:00 0 [heap]
The heap is process memory traditionally extended through the brk mechanism. Its location normally varies across executions. A very small program may have a minimal heap mapping, and modern allocators can also request anonymous mmap regions for some allocations, so not all dynamically allocated objects necessarily reside in the visible [heap] range.
Stack
The initial thread’s stack usually appears as:
7ffd92b0c000-7ffd92b2d000 rw-p 00000000 00:00 0 [stack]
Its location is randomized. The stack usually grows toward lower addresses, though the maps range is printed in increasing-address order. On a multithreaded process, additional thread stacks can appear as anonymous mappings and may not always receive equally obvious labels.
A stack address leak can therefore be valuable, but it normally reveals a location only for the relevant execution.
Anonymous mappings
Lines with no pathname, frequently shown as rw-p with file offset zero, are anonymous mappings. They can be created by the loader, allocator, application code, thread runtime, or libraries. Do not assume every anonymous writable mapping is a heap chunk or a useful exploit target. Identify it through surrounding context and debugger observation.
[vvar], [vdso], and [vsyscall]
You will often see special kernel-provided mappings near the high end of user-space memory:
[vvar]provides kernel-maintained data used by user-space routines.[vdso]is a small kernel-provided shared object containing selected user-space-callable helper routines.[vsyscall]is a legacy compatibility mapping on x86-64 systems.
These are useful orientation landmarks, but they are not ordinary writable process data. Their presence also reinforces an important map-reading habit: not every executable-looking mapping comes from a file on disk.
What should change across executions?
The only sound way to classify a region as randomized is to observe fresh executions with ASLR enabled. Comparing two moments within one process is not enough: allocations can change without ASLR, and a module’s addresses can remain constant while the process is alive.
This reading gives a useful side-by-side comparison of non-PIE and PIE programs.
A brief description of ASLR and KASLR - DEV Community
Read “A brief description of ASLR and KASLR” on DEV Community. Its concrete /proc/<pid>/maps examples make the PIE versus non-PIE distinction visible rather than abstract.
In the article’s first pair of sleep process maps, read from the non PIE comparison. Notice that the executable’s map lines stay fixed while the heap and stack do not. Then, in the following discussion of two ssh processes, read the PIE comparison. Compare the address of the target executable’s first mapping, not merely the address of its executable r-xp segment.
For a normally configured Linux system, use this as your initial prediction table:
| Region | Non-PIE dynamically linked executable | PIE dynamically linked executable |
|---|---|---|
| Main executable image | Usually fixed across fresh runs | Randomized as one image |
| libc and other shared libraries | Randomized | Randomized |
| Dynamic linker | Randomized | Randomized |
| Heap | Usually randomized | Usually randomized |
| Stack | Randomized | Randomized |
| VDSO and related special mappings | Usually randomized | Usually randomized |
| Offsets inside one mapped module | Stable | Stable |
The word usually matters. ASLR can be globally disabled, disabled for a process, suppressed by a debugger setting, or affected by execution context. Your conclusion should always be evidence-based: “the base changed in three fresh runs” is stronger than “PIE should randomize it.”
Also avoid overinterpreting the lowest hexadecimal digits. Mappings are page-aligned, so page-granularity bits do not vary. The amount and pattern of entropy are operating-system and configuration details; CTF exploit planning usually needs only the operational conclusion that an absolute address is not safely reusable.
A controlled multi-run mapping lab
Use a tiny program that stays alive long enough for inspection. Create pause.c:
#include <stdio.h>
#include <unistd.h>

int main(void) {
    puts("process is ready");
    fflush(stdout);
    sleep(30);
    return 0;
}
Compile a deliberately non-PIE version and a PIE version:
gcc -O0 -g -fno-pie -no-pie -o fixed pause.c
gcc -O0 -g -fPIE -pie -o pie pause.c
Confirm that the static metadata matches your intention:
file ./fixed ./pie
checksec file ./fixed
checksec file ./pie
fixed should normally be an EXEC binary with no PIE, while pie should be a DYN PIE executable. Their other checksec properties may depend on your distribution and compiler defaults; those properties are not the variable under study.
Now define a small capture helper in your shell:
capture_maps() {
    program="$1"
    output="$2"

    "$program" >/dev/null &
    pid=$!
    sleep 0.2

    cat "/proc/$pid/maps" > "$output"

    kill "$pid"
    wait "$pid" 2>/dev/null || true
}
Capture two fresh executions of each binary:
capture_maps ./fixed fixed.run1.maps
capture_maps ./fixed fixed.run2.maps

capture_maps ./pie pie.run1.maps
capture_maps ./pie pie.run2.maps
Extract the high-value regions from each saved map:
grep -E 'fixed|pie|libc\.so|ld-linux|\[heap\]|\[stack\]|\[vvar\]|\[vdso\]' fixed.run1.maps
grep -E 'fixed|pie|libc\.so|ld-linux|\[heap\]|\[stack\]|\[vvar\]|\[vdso\]' fixed.run2.maps

grep -E 'fixed|pie|libc\.so|ld-linux|\[heap\]|\[stack\]|\[vvar\]|\[vdso\]' pie.run1.maps
grep -E 'fixed|pie|libc\.so|ld-linux|\[heap\]|\[stack\]|\[vvar\]|\[vdso\]' pie.run2.maps
Then compare complete maps if you want to see every difference:
diff -u fixed.run1.maps fixed.run2.maps
diff -u pie.run1.maps pie.run2.maps
Record the start address of the following for each run:
| Object | Which line to record | Expected result |
|---|---|---|
| Main executable | Lowest line containing fixed or pie, normally offset 00000000 | Fixed for fixed; changed for pie |
| libc | Lowest mapping line containing libc.so | Changed in both programs |
| Dynamic linker | Lowest line containing ld-linux | Changed in both programs |
| Heap | [heap] line | Normally changed |
| Stack | [stack] line | Changed |
| VDSO | [vdso] line | Normally changed |
This lab provides a direct exploit-planning conclusion:
- In
fixed, a gadget found at a main-binary address such as0x4011b6may be reusable across fresh local runs, assuming the binary and environment are unchanged. - In
pie, the corresponding gadget has a stable offset but not a stable absolute address. You need the PIE base during that execution before using it. - In both binaries, libc function addresses, stack addresses, and heap addresses should be treated as per-execution values.
Observe the same fact in GEF without accidentally disabling ASLR
GDB often requests that ASLR be disabled for the program it debugs. This is convenient for basic debugging but dangerous for exploit development: it can make a PIE binary appear to have a stable base.
Before running a target in GDB, inspect and set the relevant option:
(gdb) show disable-randomization
(gdb) set disable-randomization off
Then start the PIE test binary and inspect its map:
(gdb) file ./pie
(gdb) set disable-randomization off
(gdb) start
gef➤ vmmap
Terminate and run it again, then issue vmmap again. Compare the first mapping belonging to ./pie, libc’s first mapping, and [stack].
The following short explanation is useful if you encounter an address such as 0x807 in static PIE analysis but the actual running function lands near an address beginning with 0x55....
Cannot access memory at address // Debugging PIE Binaries affected by ASLR - bin 0x2E
Continue with “Cannot access memory at address // Debugging PIE Binaries affected by ASLR” by LiveOverflow. It connects a PIE function’s static offset to its actual runtime address and demonstrates inspecting a live process map.
Watch base plus offset for the relationship between a PIE function offset, the mapping base from info proc mappings, and the real instruction address. Then watch outside GDB to see why a map gathered from a normally launched process is an important reality check. The key warning is not to hardcode debugger-derived addresses when the debugger has disabled randomization.
For ordinary local challenge work, leave system-wide ASLR enabled. You may temporarily use a controlled no-ASLR environment to understand a crash or validate offsets, but your final exploit must be tested repeatedly with ASLR active. A reliable local exploit is not one that succeeds once; it is one that survives fresh randomized processes.
From map observations to exploitation decisions
At this stage, translate each map observation into a restrained claim.
| Observation | Valid conclusion | Invalid conclusion |
|---|---|---|
| Main executable’s base differs between runs | Absolute main-binary gadgets are unreliable; PIE base is needed at runtime | PIE makes the binary unexploitable |
| libc’s base differs between runs | A libc address leak can be used to calculate a libc base for that run | Any leaked libc pointer immediately reveals system without identifying the libc build and offset |
| Stack mapping differs between runs | A static stack return target is unreliable | Stack control cannot be useful |
| Main binary base stays fixed in a non-PIE test | Its main-image code/data addresses may be usable as stable local constants | All process addresses are fixed |
A mapping is r-xp | It contains executable memory | You can necessarily redirect execution to it |
A mapping is rw-p | It is writable memory | It is necessarily a useful control-flow target |
Memory maps tell you where data and code reside, and ASLR comparisons tell you whether an absolute location is stable. They do not establish that you have an overflow, that a target is reachable, or that a particular mapping contains the exact gadget or string you want. Those are separate reversing and vulnerability-analysis questions.
Key takeaways
A Linux process map is a runtime record of virtual-memory regions. Read each line by identifying its address range, permissions, file offset, and backing file or special label.
For pwn triage, immediately locate:
- the target executable’s mappings;
- libc and the dynamic linker;
[heap]and[stack];- anonymous mappings and kernel-provided mappings such as
[vdso].
To establish ASLR behavior, compare the same named region across several fresh processes with randomization enabled. A non-PIE executable’s main image often stays fixed, while a PIE executable’s main-image base changes. Shared libraries, the heap, and the stack are normally randomized in both cases. Within any one module, however, relative offsets remain stable.
Next, we will turn these observations into exploit constraints: how NX, PIE, ASLR, stack canaries, and RELRO each remove particular strategies while leaving others available.
Can't find a good explanation? Sign up and we'll make it for you
Sign up