
Good to see you again. In the previous lesson, you learned to classify market structure from meaningful swings and to draw support and resistance as zones of prior reaction. You can now answer, “What state is this chart in?” This lesson adds the decision layer: “Does this particular candle formation deserve attention in this state?”
A hammer, shooting star, doji, or engulfing pattern is not a trade signal by itself. It is a compact record of one or several periods of market activity. To evaluate it responsibly, combine five pieces of evidence:
- Trend: what market structure existed before the pattern?
- Location: is the pattern occurring at support, resistance, or an unimportant middle area?
- Volume: how much participation accompanied the move and rejection?
- Confirmation: what later price action supports the proposed interpretation?
- Invalidation: what observable event would show that the idea was wrong?
By the end, you will be able to turn “I see a shooting star” into a conditional, testable market hypothesis suitable for observation and later paper trading.
A candle is evidence, not a command
A candlestick formation tells a limited story. A long lower wick, for instance, tells you that price traded lower during the interval and then recovered before the close. That is evidence of rejection of lower prices during that period. It does not prove that price will rise next.
The same shape can mean very different things in different locations:
- A hammer after a sustained decline into established support may suggest that selling pressure was rejected.
- The same hammer in the middle of a noisy range may be insignificant.
- A shooting star after a strong rally into resistance may warn that buyers failed to hold higher prices.
- The same shooting star during a steady uptrend but far below known resistance may simply be a temporary pause.
This is the central principle:
A pattern identifies a possible change in pressure; context determines whether that change matters.
The useful mindset is similar to a rule evaluation pipeline: do not promote a pattern to a setup until it passes its contextual checks. A beautiful candle that appears in the wrong place is usually just a candle.
16 Candlestick Patterns Every Trader Should Know - IG
Read IG's overview to reinforce the distinction between a candle's shape and the context that gives a pattern practical meaning.
In “How to read a candlestick,” read the context principle. Then, in “The 16 patterns at a glance” under “Single-candle patterns,” read the discussion of confirmation and trend location. Focus on why support or resistance, volume, and a later candle matter more than the label attached to the initial formation.
First filter: trend and location
Before examining the candle closely, zoom out enough to identify the existing structure on your selected timeframe. From the previous lesson:
- In an uptrend, meaningful swings make higher highs and higher lows.
- In a downtrend, they make lower highs and lower lows.
- In a range, price rotates between broadly horizontal support and resistance zones.
- In a transition, an earlier structure has failed but a new sequence is not yet established.
A reversal-style candle needs something plausibly worth reversing. A bearish shooting star is more meaningful after an advance; a bullish hammer or bullish engulfing is more meaningful after a decline. This does not mean a pattern automatically reverses the whole trend. It may produce only a pullback, or it may fail completely.
Location makes the pattern relevant
Support and resistance add a reason to care. You are asking whether the candle occurred where prior price action showed a meaningful disagreement between buyers and sellers.
For a bullish reversal hypothesis, stronger context might be:
- a prior decline or pullback;
- price reaching a defined support zone, former resistance that may now act as support, or a recent higher-low area;
- a hammer, bullish engulfing, or similar rejection pattern;
- a close back inside or above the support zone.
For a bearish reversal hypothesis, invert the logic:
- a prior advance or rebound;
- price reaching resistance, former support now acting as resistance, or a recent lower-high area;
- a shooting star, bearish engulfing, or other rejection formation;
- a close back below or inside the resistance zone.
A pattern at the centre of a range has weak location context. Price has room to fluctuate in both directions, and neither boundary has been tested. That does not make a trade impossible, but it means a candle pattern alone does little analytical work.
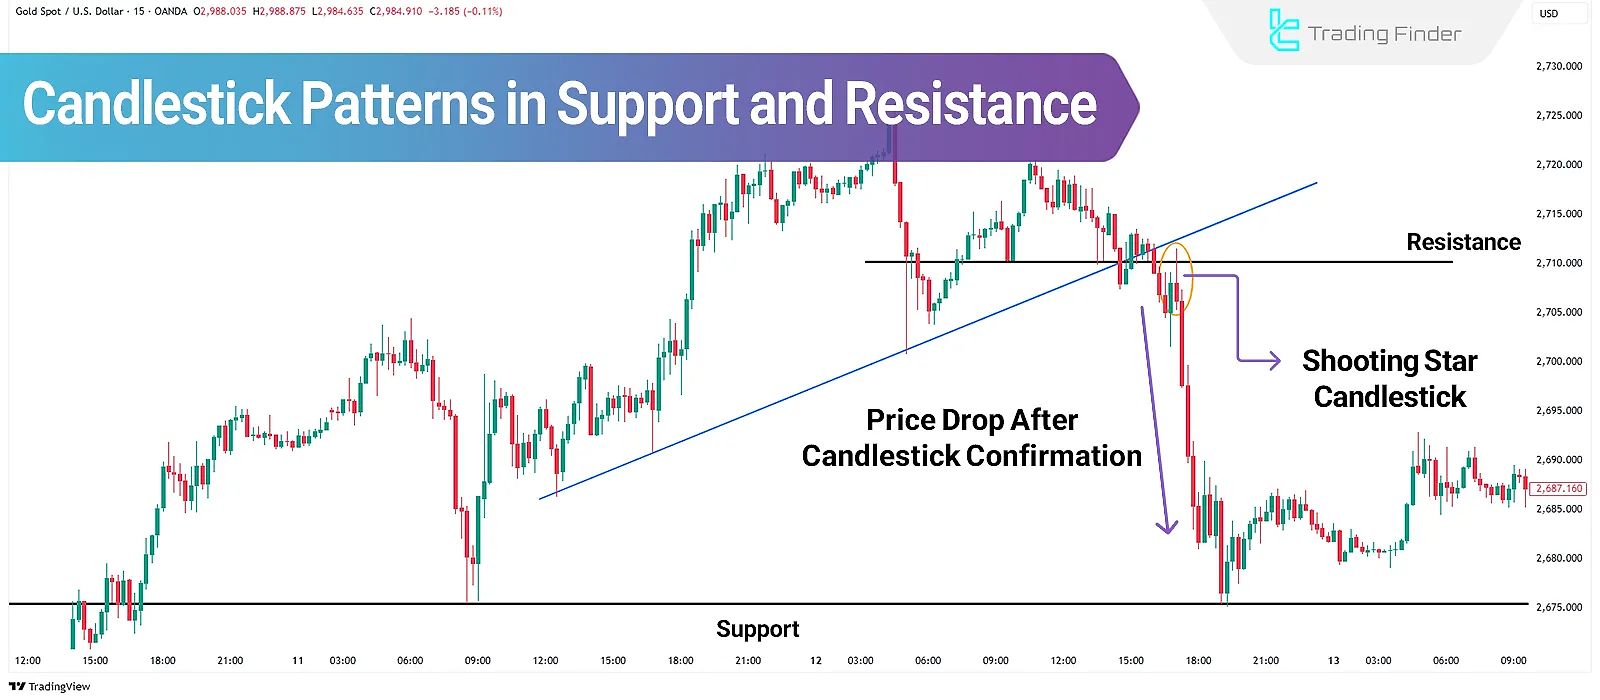
The chart’s interpretation should remain disciplined. It shows a shooting star near resistance and later downside follow-through, but it does not show a volume pane. Therefore, you cannot claim volume confirmation from this image. Also, one successful historical example does not establish that every shooting star at resistance will work.
Second filter: read volume as participation
Volume answers a different question from price:
- Price tells you where the market moved.
- Volume tells you how much trading activity accompanied that move.
Volume does not identify “buying volume” versus “selling volume.” Every executed trade has both a buyer and a seller. A green volume bar usually just corresponds to a candle that closed above its open; it does not prove that there were only buyers.
Instead, compare the volume of the setup candle with recent, comparable bars. You do not need a rigid formula at this stage. Compare it with the prior 10 to 20 bars on the same timeframe and ask whether it is ordinary, notably elevated, or unusually low.
A useful heuristic is effort versus result:
| Observation near an important zone | Possible reading | What remains necessary |
|---|---|---|
| Large directional candle with clearly elevated volume | Participation supported the directional move. | Check whether price holds the move and whether the close is beyond the zone. |
| Small body or long wick with unusually high volume at resistance or support | Heavy activity produced little net progress; opposing orders may have absorbed the move. | Wait for the next candle rather than assuming a reversal. |
| Breakout beyond a zone on low volume | The move may lack broad participation. | Treat it cautiously; watch for a return into the former range. |
| A low-volume pullback within an uptrend | Selling activity may be limited. | Look for price to hold support and resume the established trend. |
These are interpretations, not laws. High volume can arise because of earnings, macroeconomic news, index rebalancing, liquidation, or a simple increase in volatility. A large volume bar tells you that activity was high; the candle’s close and subsequent price action are needed to interpret who had control by the end of the interval.
Volume Analysis: The Correct Way to Read & Understand the Market
Watch selected parts of “Volume Analysis: The Correct Way to Read & Understand the Market” by TRLC Trading Confluence for a practical framework for comparing candle movement with participation. Treat its examples as interpretive heuristics, not certainty or a complete trading system.
Watch effort versus result to connect volume with the size of the price move. Then watch the volume-color warning carefully: volume measures executed activity, not directional buying or selling alone. Finish with the three-step check, focusing on the sequence of zooming out, assessing a key level, and waiting for later confirmation.
Instrument-specific caution
Volume data are not equally interpretable across all markets you plan to study:
- For a listed US or UK share, exchange-reported share volume is generally a useful participation measure, though the displayed value may depend on the exchange and data feed.
- For cryptocurrency, volume is exchange-specific. BTCUSDT volume from one exchange is not necessarily total global Bitcoin trading activity.
- For spot gold, foreign exchange, and many CFD-style charts, displayed volume may be tick volume or broker-specific activity rather than a centralised record of every transaction.
Use volume as one component of analysis, not a universal truth meter. If the volume source is unclear, reduce the weight you give it rather than inventing a conclusion.
Third filter: wait for confirmation
A setup candle is a proposition. Confirmation is the market supplying additional evidence consistent with that proposition after the candle has closed.
This matters because a candle can look convincing before it completes and then change substantially by the close. A developing hammer can finish as a large bearish candle; a promising breakout can close back inside its range.
What confirmation can look like
For a bullish rejection at support, confirmation might be:
- the next candle closes bullishly and remains above the support zone;
- price closes above the high of the rejection candle;
- price breaks a nearby minor swing high after the reversal candle.
For a bearish rejection at resistance, confirmation might be:
- the next candle closes bearishly and remains below the resistance zone;
- price closes below the low of the shooting star or bearish engulfing candle;
- price breaks a nearby minor swing low after the rejection candle.
For a breakout from a range, confirmation might be:
- a completed close outside the range boundary;
- follow-through that remains outside the range;
- a retest of the broken level that holds in its new role.
There is a trade-off. Waiting for confirmation often means entering later and accepting a less favourable entry price. In return, you avoid acting on some weak or incomplete signals. There is no universally correct amount of confirmation; the important thing is to define it before assessing the result.
For this course, prefer a conservative default:
Do not treat an intrabar pattern as valid. Let the candle close, then require at least one predefined piece of follow-through evidence.
That prevents the common error of seeing a pattern, entering immediately, and redefining the pattern after it fails.
Fourth filter: define invalidation before you care about the outcome
Invalidation is the observable price event that contradicts your setup hypothesis. It is not a vague feeling that “the trade is not working.”
Suppose your hypothesis is:
“Price rejected support, and buyers are likely to regain short-term control.”
The hypothesis is challenged if price accepts below that support area. Depending on the exact setup, a practical invalidation condition could be:
- a completed close decisively below the support zone;
- a break below the low of the rejection candle;
- a break below the relevant structural swing low.
For a bearish resistance-rejection hypothesis, the counterpart could be:
- a completed close decisively above resistance;
- a break above the high of the shooting star or bearish engulfing candle;
- a break above the relevant structural swing high.
The boundary must match the reason for the setup. If your thesis is “support will hold,” then a convincing close below support is more directly relevant than a small adverse movement elsewhere. If your thesis is “a breakout will hold,” then a close back inside the old range is a meaningful warning.
Do not confuse invalidation with a mechanically chosen stop-loss distance. In the risk-management module, you will calculate position size and reward-to-risk around a technically justified stop. Here, the essential habit is simpler: every bullish or bearish opinion must have a condition that could prove it wrong.
A complete setup statement
A useful chart note has five components:
“On the daily chart, price is in a downtrend and has rallied into former support, now resistance. A shooting star formed at the zone with above-average volume and closed near its low. I will consider the bearish idea confirmed only if the next daily candle closes below the shooting star’s low. The idea is invalidated by a decisive daily close above the resistance zone.”
Notice what this statement does not claim:
- It does not promise a price target.
- It does not say the candle guarantees a reversal.
- It does not ignore the possibility of failure.
- It separates observed facts from a conditional interpretation.
A practical five-question checklist
Use this compact checklist whenever you identify a doji, hammer, shooting star, or engulfing formation:
| Question | Stronger answer | Weak or no-trade answer |
|---|---|---|
| 1. What preceded it? | A clear advance, decline, pullback, or range test that fits the pattern’s interpretation. | No meaningful prior move; random candles in choppy price action. |
| 2. Where did it form? | At a narrow, visible support or resistance zone, recent swing, or range boundary. | In the middle of a range or far from any relevant level. |
| 3. What does the candle show? | Clear rejection, decisive body, or a genuine engulfing relationship. | Ambiguous shape, tiny body, or a pattern that is only approximate. |
| 4. Does volume support the reading? | Participation is meaningfully different from recent bars and is consistent with the price result. | Volume is unclear, ordinary, or contradictory without an explanation. |
| 5. What confirms and invalidates it? | Specific later close or break confirms; a defined level or close invalidates. | “I will see what happens” or no point at which the idea is wrong. |
A setup does not need every condition to be perfect. Markets rarely offer that. But if trend and location are both weak, do not try to compensate by overinterpreting the candle’s shape. In practice, location and structure usually matter more than pattern names.
TradingView chart lab: write hypotheses, not predictions
Spend about 15 minutes on this exercise using one liquid listed share or a major cryptocurrency pair on the daily chart. For this first pass, avoid an instrument whose volume source is unclear.
- Hide indicators. Keep only candlesticks and volume visible.
- Scroll back to a historical area, then use Bar Replay so that later candles are hidden.
- Mark the current structure: uptrend, downtrend, range, or transition.
- Draw the nearest relevant support and resistance zones.
- Find one completed hammer, shooting star, doji, or engulfing formation near a zone.
- Compare its volume with the previous 10 to 20 daily bars. Record only what the chart supports: ordinary, elevated, very elevated, or low.
- Pause before revealing future candles and write a setup note using this template:
| Element | Your observation |
|---|---|
| Symbol, exchange, timeframe | |
| Structure before the setup | |
| Support or resistance zone | |
| Candlestick formation and price story | |
| Relative volume | |
| Confirmation rule | |
| Invalidation rule | |
| No-trade reason, if applicable |
Then reveal the next three to five candles one at a time. Your aim is not to “win” the prediction. Check whether your confirmation and invalidation rules were clear enough that a different person could apply them without knowing the future.
Key takeaways
A candlestick pattern is a potential shift in short-term pressure, never a standalone instruction to trade.
- Evaluate the prior trend or range first.
- Give the pattern significance only when it forms at relevant support or resistance.
- Read volume as participation and compare it with recent bars; it is not a direct measure of buyers versus sellers.
- Require a completed candle and a predefined form of confirmation.
- Define invalidation before acting: identify the price behaviour that contradicts the setup’s premise.
- Keep your analysis conditional: “If confirmation occurs, the hypothesis gains support; if invalidation occurs, the hypothesis is wrong.”
You now have the full price-action context needed to assess candlestick setups. In the next module, you will add moving averages and Supertrend, using them as trend and dynamic support/resistance tools rather than as replacements for market structure.
Can't find a good explanation? Sign up and we'll make it for you
Sign up