
Welcome to our next lesson on observability. In our previous session, we focused on instrumentation for metrics, learning how to use Prometheus to answer the question, "Is our service healthy?" Metrics give us the vital signs—latency, error rates, throughput. Now, we move to the next level of diagnostic capability, essential for any scalable, distributed system.
This lesson addresses a different question: when a request fails or becomes slow, where is the problem? In a microservice architecture, a single user request can trigger a cascade of calls across dozens of services. Pinpointing the source of failure is like finding a needle in a haystack. Today, you will learn to implement distributed tracing using OpenTelemetry, a powerful technique that illuminates the entire path of a request as it travels through your system. This skill is not just a cornerstone of modern observability but also a frequent topic in system design interviews for senior engineering roles.
The Anatomy of a Distributed Trace
Before we write any code, let's understand what a distributed trace is. While metrics aggregate data (e.g., average latency over 5 minutes), a trace provides a detailed, instance-level view of a single request's journey.
The core concepts are:
- Trace: Represents the entire end-to-end journey of a request, identified by a unique Trace ID.
- Span: Represents a single unit of work or operation within a trace (e.g., an HTTP API call, a database query, a function execution). Each span has its own Span ID and a reference to its Parent Span ID, creating a hierarchy.
- Trace Context: A small packet of information—containing at least the Trace ID and the current Span ID—that is passed along with the request from one service to another. This is the "glue" that connects the spans together.
The image below shows a trace for a "Checkout" action in an e-commerce application. A single click initiates a request that flows through multiple services, each performing specific operations. The waterfall diagram at the bottom visualizes how each span contributes to the total time.
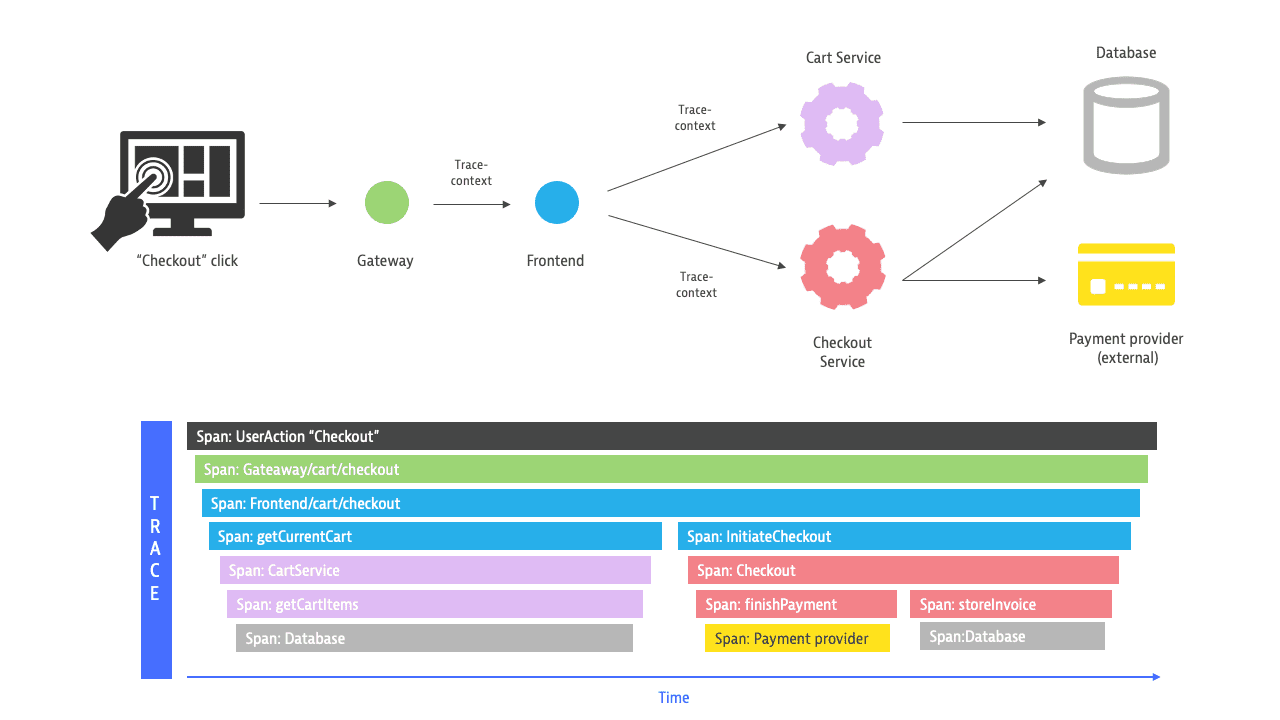
This visual representation is the "superpower" of distributed tracing. It immediately shows you which service or operation is the bottleneck.
For a more formal definition of these concepts, let's turn to a great article on distributed tracing in Go.
How to Implement Distributed Tracing in Go Microservices
This article by Nawaz Dhandala provides a thorough introduction to distributed tracing with OpenTelemetry in Go.
Read the section Distributed Tracing Fundamentals. Focus on the definitions of Trace, Span, and especially Context Propagation.
Setting Up OpenTelemetry in Go
OpenTelemetry (OTel) is an open-source, vendor-neutral observability framework for instrumenting, generating, collecting, and exporting telemetry data (traces, metrics, logs). By using OTel, you avoid being locked into a specific monitoring vendor.
Setting up OTel in a Go application involves a few key steps in your application's startup code:
- Create an Exporter: This component is responsible for sending your trace data to a backend system (like Jaeger, Zipkin, or Grafana Tempo). We will use the standard OpenTelemetry Protocol (OTLP).
- Define a Resource: This adds attributes to all spans generated by this service, such as the service name (
service.name), allowing you to filter and identify them in your observability backend. - Configure a Sampler: This decides which traces should be recorded. For development, we'll sample everything (
AlwaysSample), but we'll discuss more realistic strategies later. - Initialize a Tracer Provider: This is the main OTel object that brings together the exporter, resource, and sampler. It's the factory from which you'll get your
Tracerinstances. - Set Global Propagators: This configures how the trace context is injected into and extracted from requests. The W3C Trace Context is the universal standard.
The following code from the article we just saw provides a perfect template for this initialization.
How to Implement Distributed Tracing in Go Microservices
This section provides a complete, reusable function for initializing the OpenTelemetry tracer provider.
Read the sections Initializing the Tracer Provider. Study the InitTracer function. You don't need to memorize it, but you should understand the role of each component being configured: the otlptracegrpc exporter, the resource with the service name, the TracerProvider, and the global TextMapPropagator.
For a visual walkthrough of this setup, the following video demonstrates the process of adding the libraries and creating the tracer provider to send data to a Jaeger backend.
Implementing Distributed Tracing in Golang with OpenTelemetry
This video by MFK provides a practical, step-by-step guide to implementing OpenTelemetry in a Go API.
Watch the section from setup and initialization. The author configures an OTLP exporter, sets up the trace provider with a sampler, and defines the service resource, which aligns perfectly with the code we just reviewed.
Instrumenting Your Services
Once the tracer provider is initialized, you can start instrumenting your code. OTel makes this remarkably easy for common scenarios like HTTP APIs, thanks to pre-built instrumentation libraries.
Automatic Instrumentation with Middleware
For a backend developer like you, familiar with middleware patterns, this will feel natural. The go.opentelemetry.io/contrib/instrumentation/net/http/otelhttp package provides everything you need.
- For Servers: You wrap your
http.Handlerwithotelhttp.NewHandler. This middleware automatically:- Extracts any incoming trace context from the request headers.
- Starts a new span (or a root span if no context was found).
- Adds the context to the request's
context.Contextso it's available to your handler logic. - Ends the span when the request is complete.
- For Clients: You wrap your
http.Client's transport withotelhttp.NewTransport. This transport automatically:- Injects the trace context from the outgoing request's
context.Contextinto the request headers.
- Injects the trace context from the outgoing request's
This seamless propagation is what makes distributed tracing possible.
How to Implement Distributed Tracing in Go Microservices
This part of the article shows the practical application of the otelhttp library for both servers and clients.
Review the code examples under HTTP Context Propagation. Pay close attention to how otelhttp.NewHandler is used in main() and how the http.Client is configured with otelhttp.NewTransport.
Manual Instrumentation for Custom Spans
Automatic instrumentation is great for inter-service communication, but what about operations within a service? To get granular visibility, you should create custom child spans for significant operations like database queries, calls to external APIs, or complex business logic.
Creating a child span is simple:
- Get a tracer instance:
tracer := otel.Tracer("my-tracer-name"). - Start a new span from the existing context:
ctx, span := tracer.Start(ctx, "my-span-name"). - Use a
defer span.End()statement to ensure the span is closed. - Add relevant attributes or record errors on the span:
span.SetAttributes(...),span.RecordError(err).
The following video provides an excellent, detailed demonstration of this process. It shows how to add spans at the controller, service, and repository layers of an application, providing a rich, multi-layered trace.
Implementing Distributed Tracing in Golang with OpenTelemetry
This video continues by adding custom spans and then demonstrates true distributed tracing between two services.
First, watch how the author instruments different layers of the application from creating custom spans. This shows how to build up a detailed trace within a single service, including integrating with GORM. Next, watch the crucial part about context propagation between two microservices, starting from demonstrating distributed tracing. This connects all the concepts and shows the final result in Jaeger: a single, unified trace across two different services.
Managing Data Volume: An Introduction to Sampling
In a development environment, sampling 100% of traces is fine. In a high-traffic production system, it's often too expensive and can impact performance. Sampling is the practice of selectively deciding which traces to record and which to discard.
There are two main strategies:
- Head-Based Sampling: The decision to sample a trace is made at the very beginning, by the first service that receives the request. This decision is then propagated to all downstream services. It's simple and efficient but "blind"—it might discard a trace that later results in a critical error.
- Tail-Based Sampling: The decision is deferred until all spans in a trace have been completed. This allows for intelligent decisions, like "keep all traces with errors" or "keep all traces that are slower than 500ms." This is more powerful but requires a central collector (like the OpenTelemetry Collector) to buffer and analyze the traces before making a decision.
The image below contrasts these two approaches.
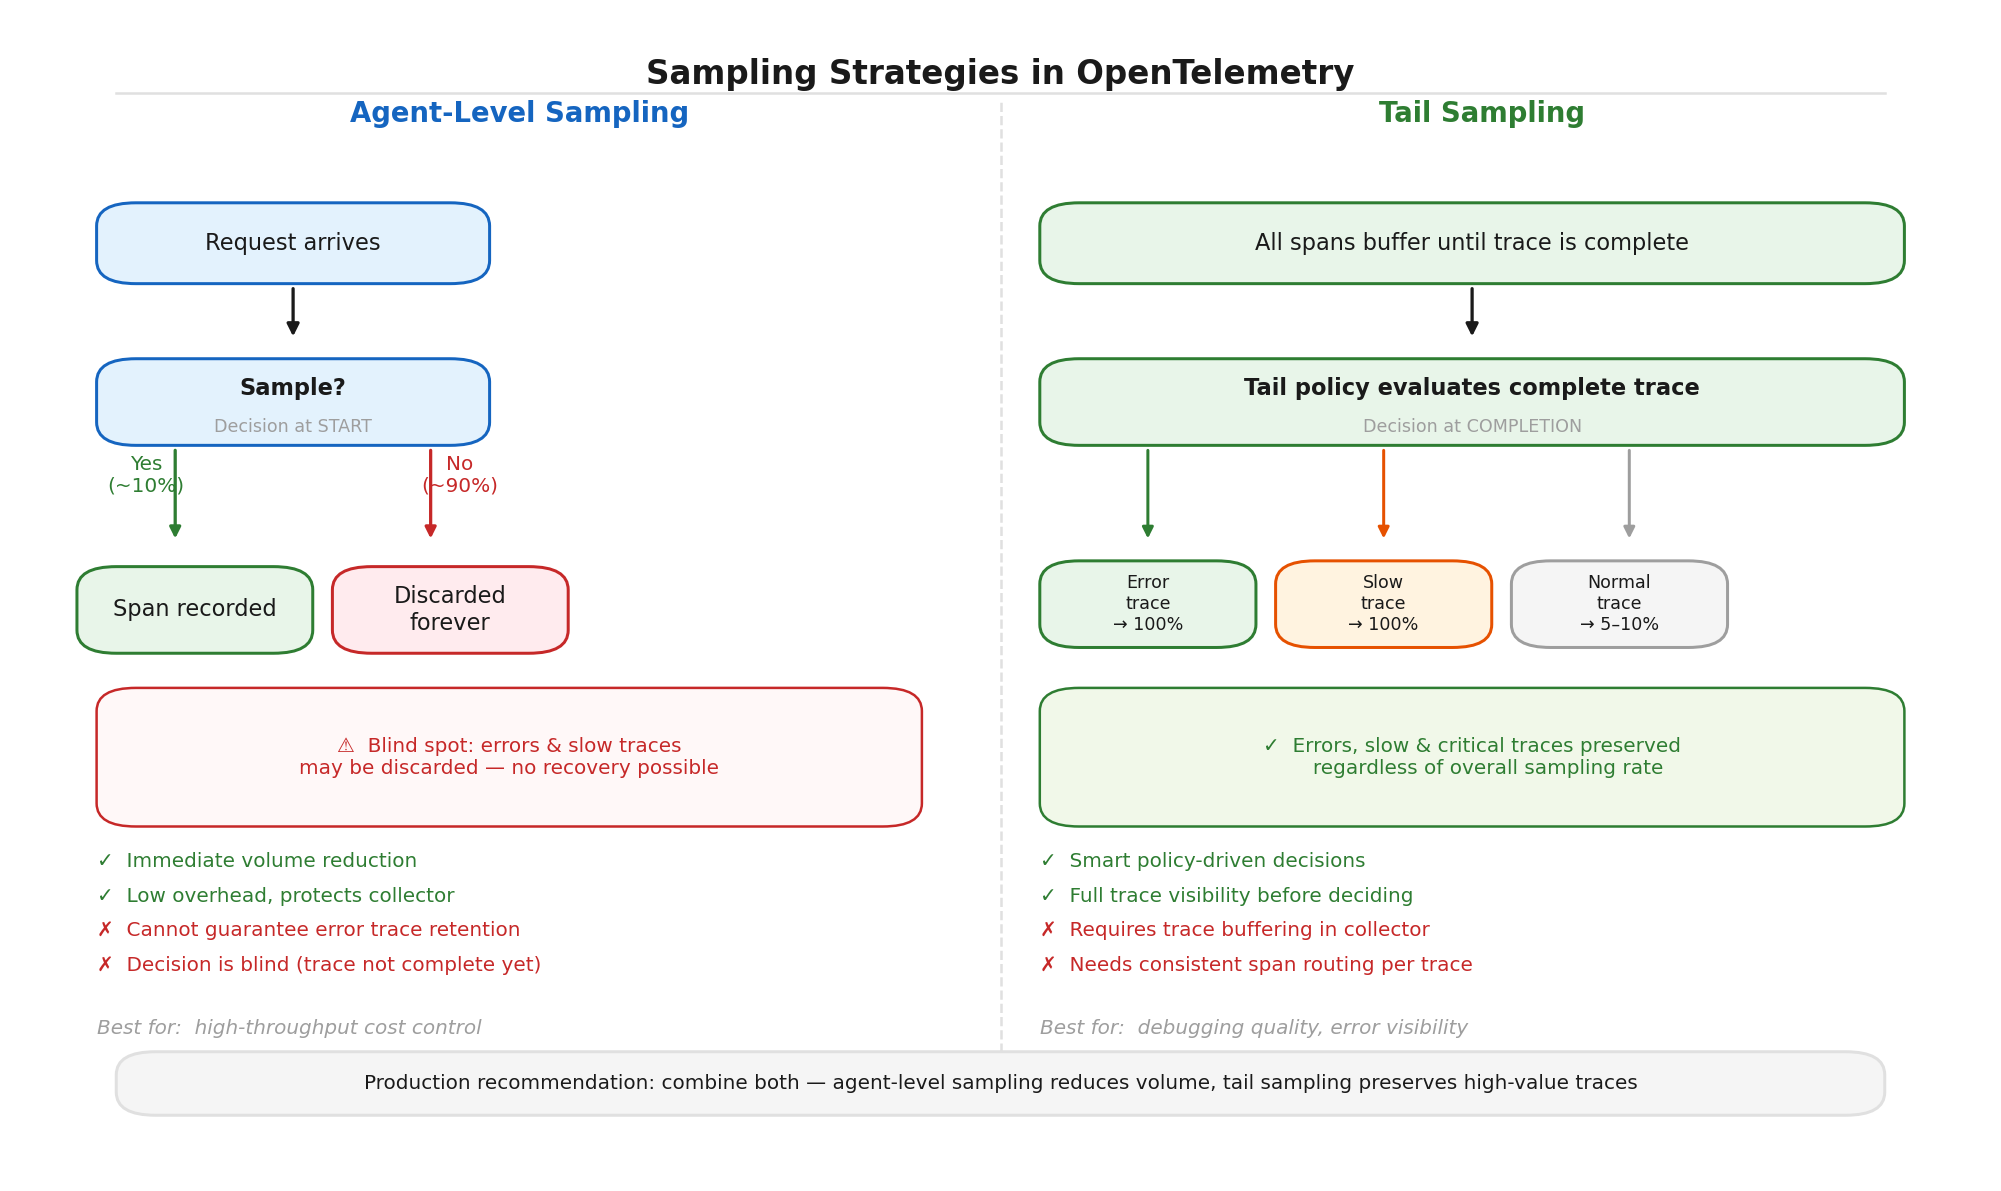
For most production use cases, a hybrid approach is common: use head-based sampling (e.g., TraceIDRatioBased(0.1) to keep 10% of traces) to control the overall volume, and configure tail-based sampling in the collector to retain 100% of traces that have errors.
OpenTelemetry Sampling: head-based and tail-based
This Uptrace article provides a fantastic deep-dive into sampling strategies.
Start by reviewing the decision tables to understand which strategy fits which scenario. Then, read the sections on head-based samplers like AlwaysOn and TraceIDRatioBased, and the section introducing tail-based sampling. This will give you a solid foundation for making informed sampling decisions in a production environment.
Conclusion
In this lesson, you've moved beyond single-service metrics to understanding the full lifecycle of a request in a distributed system. You now have the foundational knowledge and practical skills to implement end-to-end distributed tracing in Go.
Key Takeaways:
- Distributed Tracing provides a detailed, request-level view of how a request flows through multiple microservices, helping you pinpoint bottlenecks and errors.
- A Trace is composed of Spans, linked together via a shared Trace ID and parent-child relationships.
- OpenTelemetry is the industry standard for generating telemetry data. Its
otelhttplibrary greatly simplifies the instrumentation of Go web services. - Context Propagation is the magic that automatically carries trace information across service boundaries, typically via HTTP headers.
- Sampling is a critical technique for managing the cost and performance overhead of tracing in high-volume production systems.
We have now explored two of the three pillars of observability: metrics and traces. In our next lesson, we will complete the trifecta by tackling structured logging. You will learn how to use the ELK stack to aggregate, search, and analyze logs from all your services. We will also see how embedding Trace IDs into your logs allows you to correlate them directly with the traces you've learned to generate today, creating a deeply integrated and powerful debugging experience.