
Welcome to the final lesson in our module on Infrastructure and Observability. In our previous lesson, we dove into distributed tracing with OpenTelemetry, learning how to follow a single request's journey across multiple services. This gave us the "where" and "when" of a problem. Now, we'll complete the observability trifecta—metrics, traces, and logs—by tackling the "what" and "why."
Today, you will learn to aggregate and analyze structured logs from multiple services using the ELK stack. In a distributed system, logs are scattered across countless machines and containers. Sifting through them manually is an impossible task. We will explore how to build a robust pipeline to centralize these logs, make them searchable, and turn them into a powerful tool for debugging, monitoring, and gaining operational insights. This is a fundamental skill for operating scalable systems and a key area of expertise expected in senior engineering roles.
Why Centralized Logging?
As a team leader who has architected systems, you know the value of good logging for debugging. However, in the small-scale systems you've worked on, ssh-ing into a server and using grep or tail -f might have been sufficient. This approach breaks down completely in a distributed environment for several reasons:
- Scale: You might have dozens or hundreds of service instances, each generating logs.
- Ephemeral Infrastructure: Containers and virtual machines can be created and destroyed dynamically. When a container dies, its logs are often lost with it.
- Correlation: A single user action can trigger a chain of events across multiple services. Correlating logs from all involved services to reconstruct the event is nearly impossible without a centralized system.
The solution is a centralized logging pipeline that collects logs from all sources, processes them, and stores them in a single, searchable location. One of the most popular open-source solutions for this is the ELK Stack.
The ELK Stack Architecture
The ELK Stack consists of three core components: Elasticsearch, Logstash, and Kibana. In modern deployments, it's almost always used with a fourth component, Beats (specifically, Filebeat).
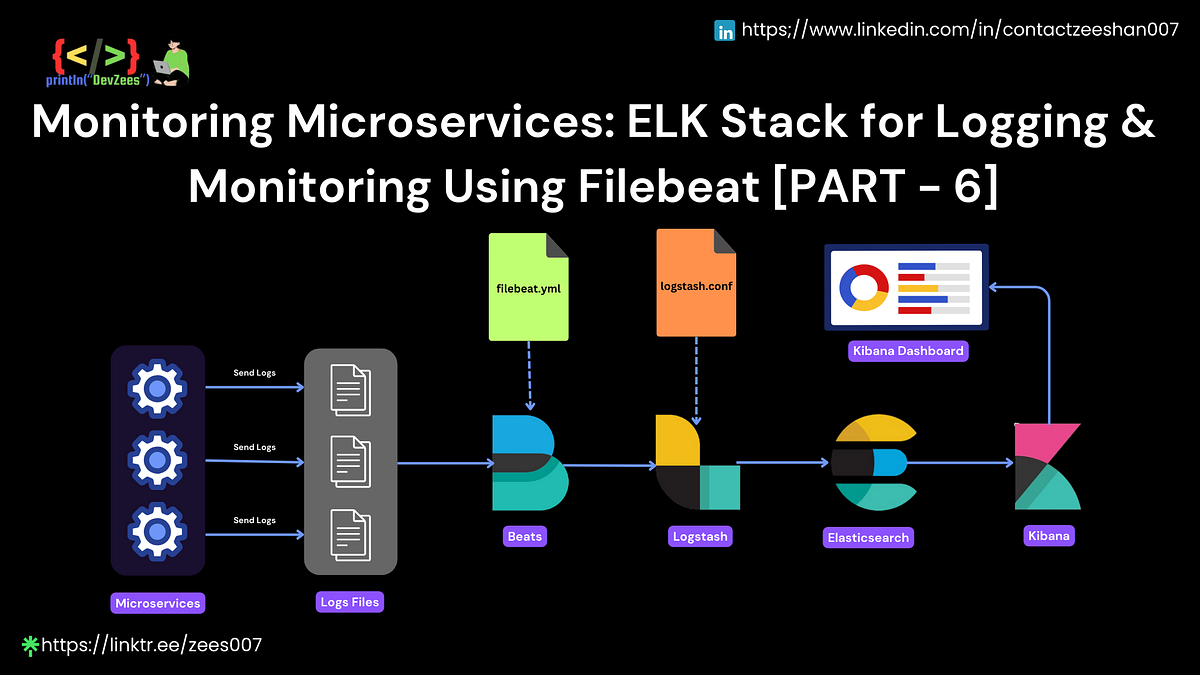
Let's break down the role of each component.
ELK Stack Setup for Centralized Log Management & Monitoring - DEV Community
This article from DEV Community provides a great overview of the problem centralized logging solves and the roles of each component in the ELK stack.
Read the introductory section. Pay close attention to the table outlining the specific responsibility of Filebeat, Logstash, Elasticsearch, and Kibana.
To summarize:
- Filebeat: A lightweight agent, or "shipper," that you install on your application servers. It watches your log files, and whenever a new line is added, it sends it to a central location (in our case, Logstash). It's designed to be efficient and resilient, using minimal resources and handling network disruptions gracefully.
- Logstash: A server-side data processing pipeline. It receives the raw log data from Filebeat, transforms it, and forwards it. This is where you can parse unstructured log lines, enrich data (e.g., by adding geo-IP information from an IP address), or filter out noisy logs.
- Elasticsearch: A powerful search and analytics engine built on Apache Lucene. It stores the processed log data in an optimized, indexed format, making it incredibly fast to search and aggregate, even across terabytes of data.
- Kibana: A web-based visualization and dashboarding tool for Elasticsearch. It provides the user interface to search your logs, create visualizations (like graphs and charts), and assemble them into interactive dashboards.
Step 1: Generating High-Quality, Structured Logs
The principle of "garbage in, garbage out" applies perfectly to logging. If your application writes unstructured, free-text log messages, your ability to effectively search and analyze them will be limited. The modern approach is structured logging, where logs are written in a machine-readable format like JSON from the very beginning.
Given your proficiency in Go, you'll appreciate the slog package, introduced in Go 1.21, which is designed specifically for this purpose. It's a massive improvement over the traditional log package.
The following video provides an excellent introduction to structured logging with slog.
Go Structured Logging with the slog Package (Golang)
This video from Better Stack provides a concise and practical guide to using Go's slog package for structured logging.
First, watch the introduction to understand the limitations of traditional logging and why structured logging is superior. Next, see how to configure slog to produce JSON output. This is the ideal format for our ELK pipeline. Finally, and most importantly, watch how to add custom attributes (key-value pairs) to your logs. This is how you'll add the critical contextual information that makes logs valuable.
Let's focus on a key practice that ties this lesson directly to our previous one on distributed tracing. When your service receives a request, the OpenTelemetry middleware extracts or creates a trace_id. To create a powerful, unified debugging experience, you should add this trace_id to every log message generated while handling that request.
slog makes this elegant with child loggers. You can create a request-specific logger that automatically includes the trace_id and other contextual information.
import (
    "log/slog"
    "net/http"
)

func myHttpHandler(w http.ResponseWriter, r *http.Request) {
    // Assume you get traceId from request context (set by OTel middleware)
    traceId := r.Context().Value("traceIdKey").(string)

    // Create a child logger with the trace_id attribute
    logger := slog.With(slog.String("trace_id", traceId))

    logger.Info("Handler started processing request")

    // ... do some work ...

    if err != nil {
        logger.Error("An error occurred", slog.String("error", err.Error()))
    }

    logger.Info("Handler finished processing request")
}
When this code runs, your JSON log output will automatically contain the trace_id field in every message, like this:
{"time":"2023-10-27T10:00:00Z","level":"INFO","msg":"Handler started processing request","trace_id":"a1b2c3d4e5f6"}
{"time":"2023-10-27T10:00:01Z","level":"ERROR","msg":"An error occurred","trace_id":"a1b2c3d4e5f6","error":"database connection failed"}
This simple practice is a game-changer. Later, in Kibana, if you find one error log for trace_id: "a1b2c3d4e5f6", you can instantly search for all other logs with that same ID and see the complete story of that request across all your microservices.
Step 2: Shipping and Processing Logs
Now that your Go application is writing structured JSON logs to a file (e.g., app.log), we need to get them into Elasticsearch. This is where Filebeat and Logstash come in.
Filebeat: The Shipper
Filebeat will be installed on the same server as your Go application. Its job is to tail app.log and forward new lines to Logstash.
Logstash: The Processor
Logstash receives the log events from Filebeat. Its configuration is defined by a pipeline with input, filter, and output stages. For a practical look at how these are configured, let's refer back to our setup guide.
ELK Stack Setup for Centralized Log Management & Monitoring - DEV Community
This article provides concrete configuration examples for Logstash and Filebeat.
First, read Section 3, "Logstash - The Data Processing Pipeline". Understand the structure of the input, filter, and output blocks. Next, read Section 5, "Filebeat - The Lightweight Log Shipper". Focus on the filebeat.yml configuration, particularly the inputs section (which specifies the log file to watch) and the output.logstash section (which points to your Logstash server).
A crucial point: The grok filter shown in the article is a powerful tool for parsing unstructured text logs. However, since we are proactively generating structured JSON logs with slog, we can have a much simpler Logstash filter. Instead of a complex grok pattern, we can use the json codec or filter to automatically parse the incoming JSON line.
Here's a conceptual Logstash config for our structured logs:
input {
  beats {
    port => 5044
  }
}

filter {


  # If Filebeat sends the entire line as a single 'message' field
  json {
    source => "message"


    # This will parse the JSON and put its fields at the top level of the log event
  }
}

output {
  elasticsearch {
    hosts => ["http://elasticsearch:9200"]
    index => "myapp-logs-%{+YYYY.MM.dd}"
  }
}
This is a significant advantage of the structured logging approach: your data pipeline becomes simpler and more efficient.
Step 3: Analysis and Visualization with Kibana
This is where all the setup pays off. With your logs neatly parsed and indexed in Elasticsearch, you can now use Kibana to turn that data into insight.
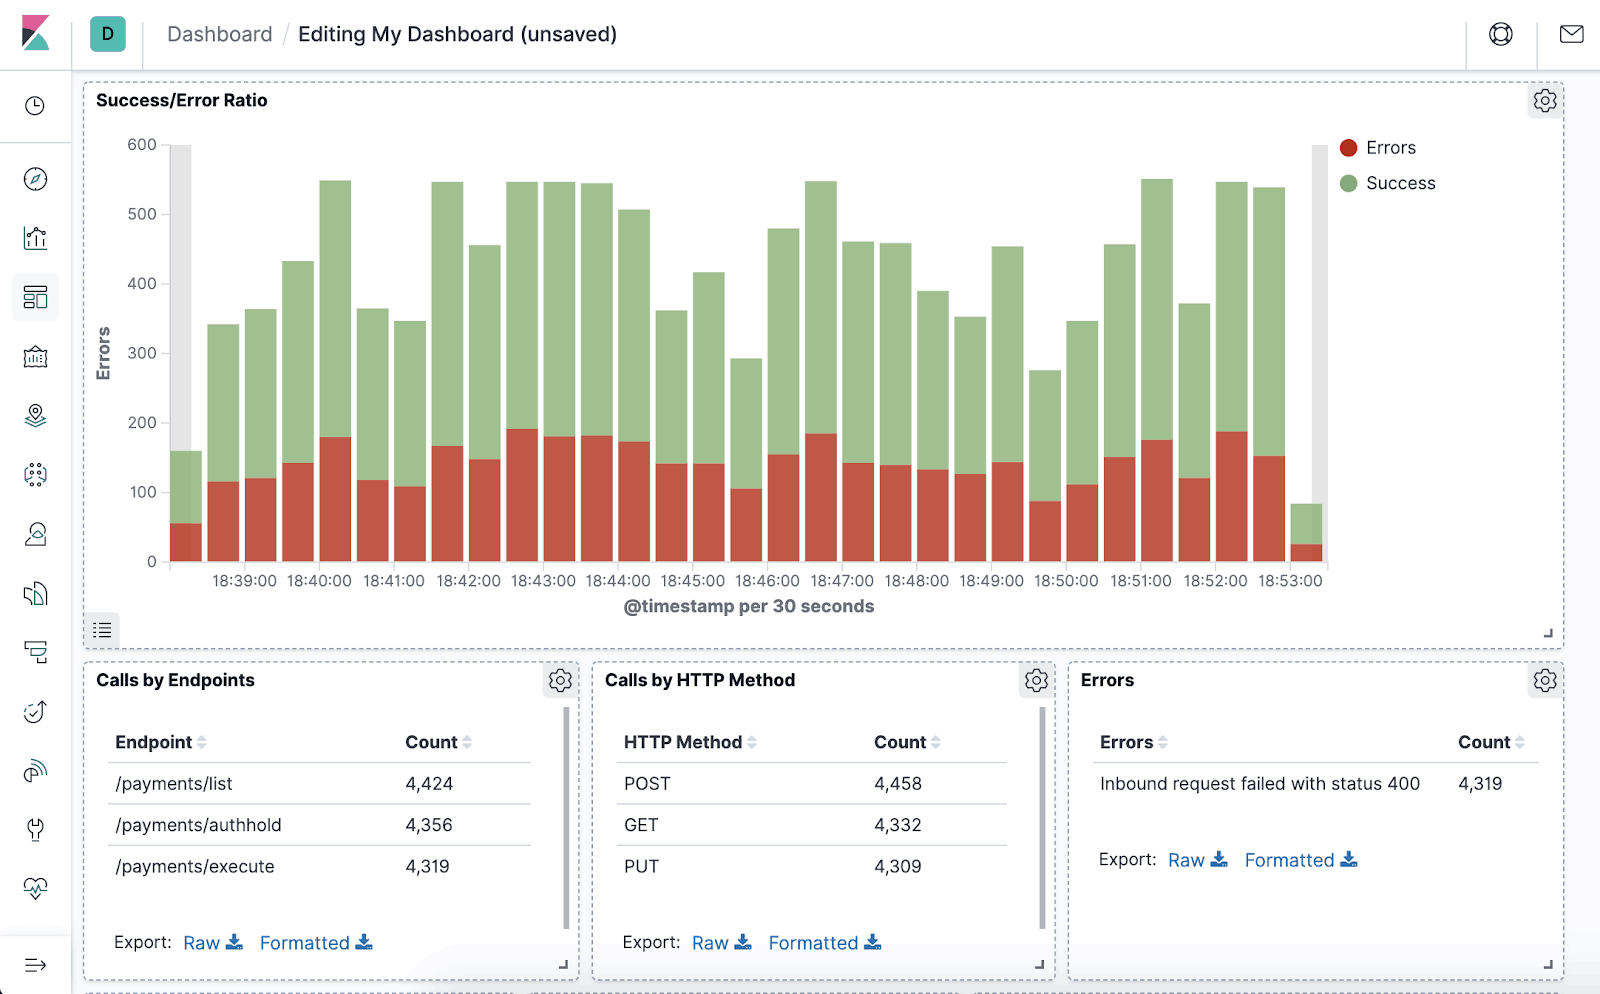
Kibana offers a rich query language and powerful visualization tools.
Kibana Logs: Advanced Query Patterns and Visualization Techniques
This article from Last9 provides an excellent deep dive into querying and visualizing logs in Kibana.
First, read the section on query patterns. Focus on the examples for field-based filters and boolean logic using KQL (Kibana Query Language). This is the core of how you will search your logs. Then, review the section on visualizations. Pay attention to the "Time Series" and "Service Health" examples, as these are two of the most common and useful charts for monitoring application health.
Let's walk through a typical debugging workflow:
- Get an Alert: An alert fires that the error rate for the
payment-servicehas spiked. - Go to Kibana: You open the Kibana "Discover" tab and start with a broad query to see the errors in the last 15 minutes.
- Query:
service.name : "payment-service" AND log.level : "ERROR"
- Query:
- Find a Sample Error: You see a log message: "Failed to process payment: upstream provider timeout." The log event includes
trace_id: "a1b2c3d4e5f6". - Pivot to the Trace: You copy the trace ID and change your query to see everything related to that single transaction.
- Query:
trace.id : "a1b2c3d4e5f6"
- Query:
- Full Context: Instantly, you see logs from the
api-gateway, theorder-service, and thepayment-service, all for that one request, interleaved in chronological order. You can see the request come in, the order being created, the call to the payment service, and the resulting timeout error. You have a complete, end-to-end picture of the failure without ever leaving Kibana.
This ability to pivot from an aggregated view (error rates) to a specific instance (a single trace) is what makes modern observability platforms so powerful.
Conclusion
In this lesson, we have constructed a complete, production-grade pipeline for managing logs in a distributed system. You have learned how to generate high-quality structured logs, ship them reliably, process them, and finally, turn them into actionable insights.
Key Takeaways:
- Centralized logging is essential for debugging and monitoring distributed systems.
- The ELK stack (with Filebeat) provides a powerful, open-source solution: Filebeat (ship), Logstash (process), Elasticsearch (store/index), and Kibana (visualize).
- Structured logging (e.g., using Go's
slogto produce JSON) is the foundation of effective log analysis. - Correlating logs with traces via a
trace_idcreates a deeply integrated debugging experience, allowing you to trace a single request's logs across all services. - Kibana transforms raw log data into a searchable, visual, and interactive tool for troubleshooting and monitoring.
With this lesson, you've completed the three pillars of observability. You can instrument your services for metrics, trace requests across them, and aggregate their logs for deep analysis. This comprehensive skill set is exactly what top engineering teams look for.
In our next module, we will shift gears from observing systems to understanding the fundamental algorithms that make them work. Our first topic will be distributed consensus and the Raft algorithm, the bedrock of reliability in many distributed databases and coordination services.