
Welcome back. In the previous lesson, you treated memory alerts as hypotheses to test: low free memory alone was not enough; you looked for pressure, kernel evidence, and the affected process. The same evidence-first habit applies when one service is failing while the host itself appears healthy.
This lesson moves inside a process. You will learn to establish a timeline from service logs, inspect the files, pipes, and sockets a process currently has open, then use strace to observe the exact kernel operation that fails. The goal is not to memorize every Linux system call. It is to turn a vague report such as “the API keeps restarting” into a specific, testable conclusion such as “the service user received EACCES while opening its output path at the same moment the application logged the export failure.”
Build an evidence chain, not a command collection
A running service interacts with Linux through the kernel: opening configuration files, reading certificates, writing logs, accepting connections, creating child processes, and waiting for input. At the application level, these actions may become a single opaque message:
ERROR: initialization failed
At the kernel boundary, though, the reason is often concrete:
openat(..., "/srv/app/config.yaml", ...) = -1 EACCES (Permission denied)
A useful investigation combines three views of the same incident:
| Evidence source | Best question it answers | Limitation |
|---|---|---|
| Service logs | What did the application think it was doing? | The error may be generic or omit the OS-level cause. |
| File-descriptor inspection | What files, pipes, devices, and sockets does the process have open now? | It is a snapshot; a failed open call leaves no descriptor behind. |
| System-call tracing | Which request did the process make to the kernel, and what did the kernel return? | It captures only the tracing window and may add overhead. |
The order matters. Start with the service name, recent logs, and a bounded incident window. Identify the relevant PID. Inspect its currently open descriptors. Then trace only long enough to capture a reproduction or the next failure.
System calls: the kernel boundary
An application cannot directly open a disk file or write to a network socket. It asks the kernel, using system calls. strace records those calls, their arguments, return values, and received signals.
Tutorial: Debugging with Strace - A Peek Behind the Scenes of Linux Processes - Avikam Rozenfeld
Watch Tutorial: Debugging with Strace – A Peek Behind the Scenes of Linux Processes by Avikam Rozenfeld on The Linux Foundation channel. It gives the practical mental model for reading a trace: system calls expose what a process actually asks Linux to do.
Watch the system-call model to establish what strace observes. Then watch the useful options, focusing on child-process following, output files, timestamps, and per-call timing. Finally, watch file descriptors; pay particular attention to how an open call returns a descriptor and how -y makes later reads and writes intelligible.
A system call conventionally communicates failure with a return value of and an errno value. The errno name is diagnostic evidence, not merely an error label:
EACCES: the effective process identity was denied access.ENOENT: a named path component or target did not exist at that moment.ENOSPC: the filesystem could not allocate space; check both byte capacity and inode capacity.EMFILE: this process has reached its open-file-descriptor limit.
The error identifies the immediate failed operation. It does not automatically explain why the system reached that state. For example, EMFILE proves a descriptor allocation failure; it does not by itself prove a file-descriptor leak.
File descriptors: how a process holds resources
A file descriptor (FD) is a small non-negative integer in a process. Once a process opens a resource, it uses the descriptor number for later operations such as read, write, close, or poll.
The phrase “everything is a file” is useful shorthand in Linux troubleshooting. Regular files are represented by descriptors, but so are directories, pipes, terminal devices, Unix-domain sockets, and Internet sockets.
By convention, processes normally begin with:
| FD | Conventional role | Typical use |
|---|---|---|
| 0 | standard input | configuration or interactive input |
| 1 | standard output | service logs when managed by systemd or a container runtime |
| 2 | standard error | warnings, stack traces, error logs |
Other FD numbers are allocated as resources are opened. FD 7 has no universal meaning; its meaning is specific to that process at that instant.
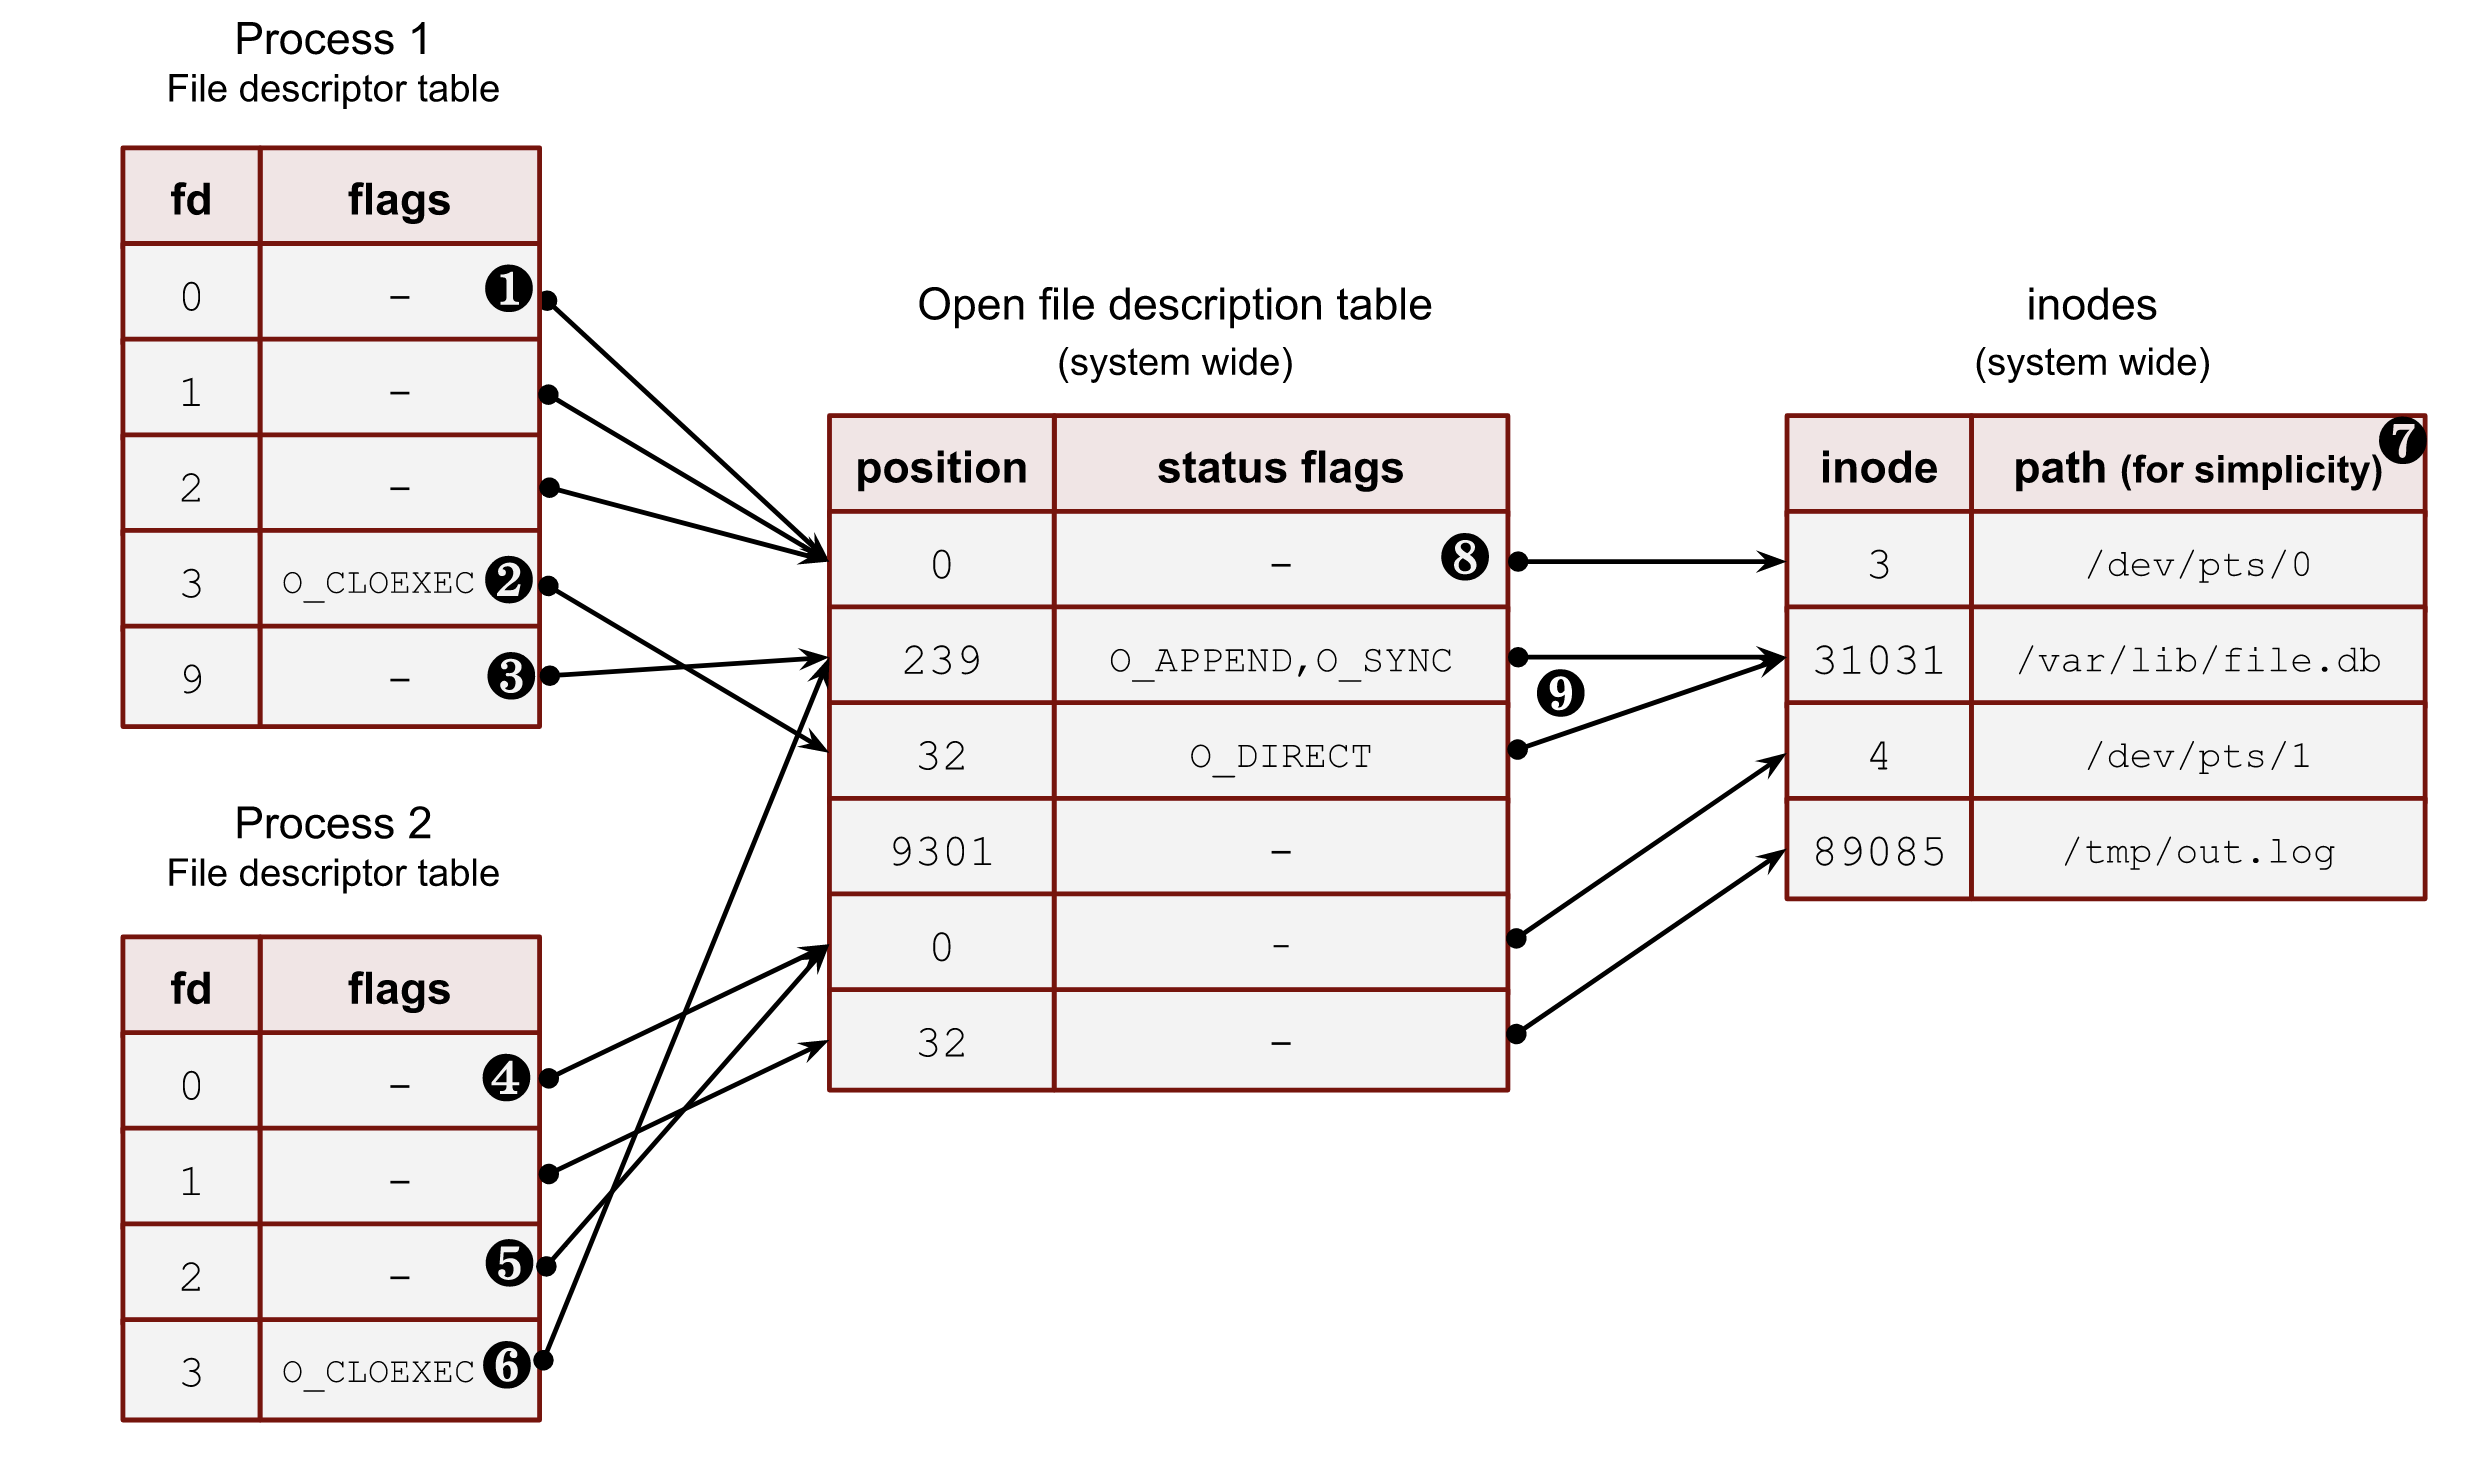
The diagram explains two important details that often appear in incidents:
- A descriptor is not the file itself. It is a per-process handle that refers to an open file description in the kernel.
- Sharing can be intentional. After a process forks, parent and child can inherit descriptors that refer to the same open file description. They may therefore share a file offset. Separate
opencalls on the same path can instead create separate open file descriptions.
This distinction is especially useful with service workers. A master process may open a log file or listening socket, then spawn workers that inherit it. Seeing the same socket or log file in several worker processes is often normal, not evidence of leakage.
Inspect descriptors through /proc and lsof
Linux exposes a live process’s descriptor table at:
/proc/<PID>/fd/
For a focused inspection:
pid=2418

sudo ls -l /proc/"$pid"/fd
sudo readlink -f /proc/"$pid"/fd/7
sudo cat /proc/"$pid"/fdinfo/7
The symbolic links under /proc/<PID>/fd reveal what each current descriptor references. fdinfo can provide supporting metadata such as position, flags, mount ID, and inode number.
In production, lsof presents this information in a more readable form:
sudo lsof -nP -p "$pid"
Use -nP during investigation to avoid DNS lookups and service-name resolution while you are trying to diagnose an already failing system. To view only Internet sockets owned by that PID, combine selectors with -a, which means logical AND:
sudo lsof -nP -a -p "$pid" -i
Read the relevant parts of the lsof(8) manual page from man7.org to anchor the meaning of “open file” and the most useful output columns.
In the DESCRIPTION section, read the opening explanation. Notice that sockets and streams count as open files alongside regular files. Then, in the OUTPUT section, read the FD column description. Focus on the numeric FD, its trailing access mode such as r, w, or u, and the special entries such as cwd, txt, and mem.
A small illustrative lsof output might look like this:
COMMAND     PID  USER   FD   TYPE  NAME
report-api 2418  app     3r   REG   /etc/report-api/config.yaml
report-api 2418  app     7w   REG   /var/log/report-api/access.log
report-api 2418  app     1w   FIFO  pipe
report-api 2418  app    12u  IPv4  TCP 127.0.0.1:8080 (LISTEN)
Read it as a snapshot:
3rmeans descriptor 3 is open for reading.7wmeans descriptor 7 is open for writing.1w FIFO pipeis consistent with standard output being captured by another process rather than written to a named log file.12uis open for both reading and writing and refers to a socket.
Do not assume every systemd service writes to /var/log. A common arrangement is for standard output and standard error to be pipes collected by journald. In that case, journalctl is the correct initial log source.
Start with the service timeline
For a systemd-managed service, capture its state and log window before attaching a tracer:
unit=report-api.service

systemctl status "$unit" --no-pager

systemctl show "$unit" \
  -p MainPID \
  -p ExecMainPID \
  -p ExecMainCode \
  -p ExecMainStatus \
  -p Result

journalctl -u "$unit" \
  --since "2025-03-08 10:10:00" \
  --until "2025-03-08 10:20:00" \
  -o short-iso \
  --no-pager
This establishes four facts:
- Identity: which unit and process are involved.
- Scope: whether the service is running, failed, or restarting.
- Time window: when symptoms began and whether they repeat.
- Application context: which request, startup phase, configuration change, or dependency the service reported.
If the process is still running, obtain the current main PID:
pid=$(systemctl show -p MainPID --value "$unit")
ps -p "$pid" -o pid,ppid,user,stat,etime,cmd
pstree -ap "$pid"
Treat a MainPID of 0 as evidence that there is no currently running main process to inspect. For a rapidly restarting service, record the PID and timestamp together: the PID may be gone by the time you issue the next command.
MainPID is also not necessarily the process performing the work. A web server, process manager, or job runner may have a master process and several workers. pstree helps identify the worker that is actually stuck or failing. This matters because its open descriptors and system calls may differ from the parent’s.
Use strace safely and deliberately
strace can answer questions that logs cannot:
- Did the process try to open the file it claims is missing?
- Which exact path did it request?
- Did the kernel deny it, report it absent, or allow it?
- Is it repeatedly waiting in an I/O-related call?
- Did it receive a termination signal?
However, tracing is not free. It uses the kernel tracing interface, can add overhead, and can expose sensitive data in paths or captured strings. For a high-traffic production process, prefer a short capture during a reproducible failure, or reproduce on a representative non-production host first.
A generally useful short capture is:
sudo timeout --signal=INT 20s \
  strace -ff -tt -T -s 256 -yy \
  -e trace=%file,%desc \
  -p "$pid" \
  -o "/tmp/${unit}.${pid}.strace"
Here is why each option is present:
| Option | Purpose |
|---|---|
-p "$pid" | Attaches to an existing process. |
-ff | Follows child processes and writes separate output files for traced PIDs. |
-tt | Adds precise wall-clock timestamps for correlation with service logs. |
-T | Shows time spent in each system call. |
-s 256 | Raises the displayed string length, while keeping capture size bounded. |
-yy | Resolves descriptor context, including socket details, where available. |
-e trace=%file,%desc | Limits output to pathname and descriptor-related calls. |
-o | Preserves trace output in files for review rather than mixing it into the terminal. |
The filter is intentional. A full trace can be overwhelmingly noisy. If your hypothesis is “the service cannot read configuration or write output,” file and descriptor calls provide higher signal. If that hypothesis is disproved, widen the trace only for a short, controlled capture.
Two cautions are worth stating explicitly:
- A trace captures only what happens during the capture. If the startup failure happened five minutes ago and the process is now idle, attaching will not reconstruct it. Reproduce the action or capture the next restart in a safe environment.
- Do not trace a locally launched binary as a substitute for the service without checking context. Direct execution may use a different user, working directory, environment, configuration path, security profile, and resource limit than the systemd unit.
For hard-to-reproduce failures, check the unit’s User=, WorkingDirectory=, environment, and startup command before designing a reproduction. A test that succeeds as root is not evidence that the service user can perform the same operation.
Read a trace as a story of intent and result
Suppose the service journal contains this sequence:
2025-03-08T10:14:03+00:00 report-api[2418]: INFO generating daily export
2025-03-08T10:14:03+00:00 report-api[2418]: ERROR export initialization failed
2025-03-08T10:14:03+00:00 systemd[1]: report-api.service: Main process exited, status=1
During a controlled reproduction, the trace contains:
10:14:03.128741 openat(AT_FDCWD,
"/srv/report-api/exports/daily.csv",
O_WRONLY|O_CREAT|O_TRUNC, 0660) = -1 EACCES (Permission denied) <0.000041>
This is a strong evidence chain:
- The service log establishes the application phase: export initialization.
- The trace has a matching timestamp.
openatshows the exact path and requested write behavior.EACCESis the kernel’s immediate reason for failure.- The very short duration shows this was a prompt denial, not a prolonged wait.
A defensible conclusion is:
“At 10:14:03, the application began generating the daily export and immediately failed. A trace captured during the same operation shows the service process receiving
EACCESwhen it attempted to create or truncate/srv/report-api/exports/daily.csv. The immediate cause is filesystem access denial for the service’s effective identity. Next I would inspect ownership and permissions on the directory and all parent directories, then check applicable SELinux or AppArmor policy. I would correct the deployment or runtime-directory ownership rather than applying broad permissions.”
Notice what this conclusion does not claim: it does not say “a chmod 777 will fix it,” and it does not claim whether POSIX permissions or a mandatory-access-control policy caused the denial until that has been checked.
Common syscall patterns and their next checks
| Trace pattern | What is established | Useful next evidence |
|---|---|---|
openat(...)= -1 EACCES | The kernel denied an attempted file access. | Service user, directory traversal permissions, ownership, SELinux or AppArmor logs. |
openat(...)= -1 ENOENT | The exact requested path was unavailable. | Deployment artifacts, mounts, configuration expansion, working directory. |
write(...)= -1 ENOSPC | The write could not allocate filesystem space. | df -h, df -i, mount state, and consumers of the filesystem. |
openat(...)= -1 EMFILE | The process could not allocate another descriptor. | /proc/<PID>/limits, systemd LimitNOFILE, descriptor count and growth trend. |
A long poll, read, or write duration | The process spent time waiting in that operation. | Descriptor target, concurrent load, peer health, and logs during the wait. |
A long call is a lead, not a verdict. A server commonly waits in poll for normal work. It becomes meaningful when the wait duration aligns with a timeout, a stalled request, or an unhealthy dependency.
Diagnose descriptor exhaustion with evidence
If the trace shows EMFILE, inspect both the configured limit and the number of descriptors currently open:
sudo grep -i "open files" /proc/"$pid"/limits
sudo ls /proc/"$pid"/fd | wc -l
sudo lsof -nP -p "$pid"
A single count cannot prove a leak. Repeat the count during steady traffic. A count that grows persistently without returning toward a baseline is stronger evidence than one high but stable count. lsof then helps classify the descriptors: are they regular files, deleted logs, pipes, sockets, or a surprising number of connections to one destination?
A practical incident workflow
Use this sequence in an interview or a real incident. It keeps your actions hypothesis-driven and prevents collecting unrelated command output.
-
State the symptom and time window.
For example: “report-api.servicehas restarted six times since 10:14. I will determine whether it exits because of an application error, a failed OS resource operation, or an external dependency.” -
Collect service-level evidence.
Usesystemctl status,systemctl show, and timestampedjournalctloutput. Record the effective PID, exit status, and relevant log lines. -
Map the process structure.
Usepsandpstree. Identify whether the main process, a worker, or a short-lived child is the correct target. -
Inspect current descriptors.
Use/proc/<PID>/fdandlsof -nP -p <PID>. Look for expected configuration, logs, sockets, pipes, and anomalous resource types. Remember that this is only a snapshot. -
Form a narrow hypothesis.
“The service cannot read a certificate,” “it cannot create its output file,” or “it may have exhausted descriptors” are useful hypotheses. “Something is wrong with Linux” is not. -
Capture a short, filtered trace.
Attachstraceduring the next recurrence or a controlled reproduction. Use timestamps and write output to protected local storage. -
Correlate and classify.
Match the syscall timestamp and path with the service log event. Separate the observed fact from the next root-cause question. -
State an appropriately bounded conclusion and remediation.
Describe the evidence, immediate cause, and the additional check needed before making a potentially broad change.
A concise interview-style explanation might sound like this:
“I would first bound the failure in
journalctland confirm the service’s current PID and restart result. Then I would inspect its open descriptors withlsofand/procto understand its current files, logs, and sockets. If the journal shows a failure during configuration load or output creation, I would collect a short timestampedstracefiltered to file and descriptor calls. Anopenatfailure withEACCES,ENOENT, orEMFILEwould give me the exact kernel-level failure and path. I would correlate that with the application log, verify the responsible service identity and configuration, and apply the smallest fix supported by evidence.”
Key takeaways
- Service logs provide application context;
lsofand/procprovide a snapshot of currently open resources;stracecaptures the kernel operation and return value. - A file descriptor is a per-process handle. It may refer to files, pipes, devices, and sockets, and several processes can intentionally share an underlying open resource.
- A failed
openatcall creates no descriptor, so usestracewhen a snapshot alone cannot explain a failure. - For systemd services, establish the unit’s timeline, PID, exit result, and process tree before tracing.
- Use short, filtered, timestamped traces. Treat trace output as potentially sensitive and avoid casual tracing of busy production workloads.
- Interpret errno as immediate evidence, then test the next root-cause hypothesis rather than applying broad permission or limit changes.
Next, you will extend this same method to a frequent source of process failures: tracing a DNS lookup from an application, through the operating system, to its configured resolver.
Can't find a good explanation? Sign up and we'll make it for you
Sign up