
Welcome back. In the previous lesson, you learned that NULL is not zero and that SQL filters retain only rows whose condition evaluates to TRUE. That matters immediately here: summaries can be misleading when missing values are silently excluded from a count, average, minimum, maximum, or total.
This lesson moves from row-level querying to the core of analytical reporting: turning many transaction rows into trustworthy metrics. You will use COUNT, SUM, AVG, MIN, and MAX; control the level of detail with GROUP BY; and filter completed summaries with HAVING. These are the building blocks for KPI reporting, reconciliation, and QA work in Snowflake and Power BI.
From individual rows to summary metrics
Imagine SALES_ORDER contains one row per order:
| order_id | region | category | net_sales | sales_rep_id |
|---|---|---|---|---|
| 1001 | East | Office | 120.00 | 501 |
| 1002 | East | Office | 80.00 | 501 |
| 1003 | West | Furniture | 250.00 | 502 |
| 1004 | West | Furniture | 150.00 | NULL |
| 1005 | East | Technology | 100.00 | 503 |
| 1006 | West | Technology | 300.00 | 502 |
| 1007 | NULL | Office | 90.00 | NULL |
A normal SELECT can return the seven detail rows. An aggregate function instead reads many rows and produces a summary value.
For example, a reporting stakeholder might ask:
- How many orders are there?
- What is total net sales?
- What is the average order value?
- What are the smallest and largest orders?
Use meaningful aliases so a result can be understood without reading the SQL:
SELECT
    COUNT(*) AS total_orders,
    SUM(net_sales) AS total_net_sales,
    AVG(net_sales) AS average_order_value,
    MIN(net_sales) AS smallest_order_value,
    MAX(net_sales) AS largest_order_value
FROM PORTFOLIO_DB.RAW.SALES_ORDER;
This query returns one row, because it summarizes the entire filtered table.
SQL Aggregate Functions | COUNT, SUM, AVG, MAX, MIN | #SQL Course 21
Watch “SQL Aggregate Functions | COUNT, SUM, AVG, MAX, MIN” by Data with Baraa for a compact visual introduction to the five functions and the transition from a single overall metric to grouped metrics.
Watch the core idea to see why aggregate functions reduce many rows into a summary. Then watch the query examples for practical uses of each function. Finish with grouped results, focusing on how a selected grouping column changes a single company-wide metric into a breakdown.
The five essential functions
| Function | What it returns | Typical reporting use |
|---|---|---|
COUNT(*) | Number of rows | Total orders, events, tickets, or records |
SUM(column) | Total of numeric values | Revenue, units, expenses, hours |
AVG(column) | Mean of numeric non-NULL values | Average order value, response time, rating |
MIN(column) | Smallest non-NULL value | First date, lowest sale, fastest response |
MAX(column) | Largest non-NULL value | Latest date, highest sale, slowest response |
MIN and MAX are not limited to numbers. For a date column, MIN(order_date) finds the earliest date and MAX(order_date) finds the most recent one. For text, they follow the database’s ordering rules, but numeric and date uses are generally clearer in reporting.
A useful reporting habit is to pair averages with counts. An average of 10,000 based on one order does not carry the same meaning as an average of 10,000 based on 10,000 orders.
SELECT
    COUNT(*) AS total_orders,
    AVG(net_sales) AS average_order_value,
    MIN(net_sales) AS smallest_order_value,
    MAX(net_sales) AS largest_order_value
FROM PORTFOLIO_DB.RAW.SALES_ORDER;
COUNT and NULL: an essential QA distinction
The previous lesson showed that NULL represents missing or unknown data. Aggregate functions mostly ignore NULL values, but COUNT(*) is the crucial exception.
SELECT
    COUNT(*) AS all_order_rows,
    COUNT(sales_rep_id) AS orders_with_assigned_rep
FROM PORTFOLIO_DB.RAW.SALES_ORDER;
For the sample data:
COUNT(*)returns7, because all seven rows exist.COUNT(sales_rep_id)returns5, because two rows have no assigned representative.
That difference is valuable QA evidence:
SELECT
    COUNT(*) - COUNT(sales_rep_id) AS orders_missing_sales_rep
FROM PORTFOLIO_DB.RAW.SALES_ORDER;
Use this pattern whenever a report depends on a field that may be incomplete. For example, if a dashboard attributes revenue to sales representatives, a count of missing sales_rep_id values tells you how much attribution may be incomplete.
What happens when the value being summarized is missing?
For a numeric column such as net_sales:
SUM(net_sales)ignoresNULLvalues.AVG(net_sales)ignoresNULLvalues and divides by the number of populated values, not by all rows.MIN(net_sales)andMAX(net_sales)ignoreNULLvalues.- If every value in a group is
NULL,SUM,AVG,MIN, andMAXreturnNULL.
This is a reason to be cautious with average KPIs. Suppose five orders are present but only four have a recorded value:
SELECT
    COUNT(*) AS all_orders,
    COUNT(net_sales) AS orders_with_recorded_sales,
    AVG(net_sales) AS average_of_recorded_sales
FROM PORTFOLIO_DB.RAW.SALES_ORDER;
The average is the average of recorded sales, not necessarily the average of all business activity. In a QA report, expose both counts rather than letting the missing fifth value disappear without explanation.
COUNT(DISTINCT column) is also often useful:
SELECT
    COUNT(DISTINCT sales_rep_id) AS distinct_assigned_reps
FROM PORTFOLIO_DB.RAW.SALES_ORDER;
It counts unique, non-NULL values. In this example, the result is 3, for representatives 501, 502, and 503.
GROUP BY defines the grain of a report
The previous queries produced one metric for the entire table. Usually, a stakeholder wants a breakdown:
Show the number of orders, total sales, and average order value for each region.
SELECT
    region,
    COUNT(*) AS order_count,
    SUM(net_sales) AS total_net_sales,
    AVG(net_sales) AS average_order_value,
    MIN(net_sales) AS smallest_order_value,
    MAX(net_sales) AS largest_order_value
FROM PORTFOLIO_DB.RAW.SALES_ORDER
GROUP BY region
ORDER BY total_net_sales DESC;
GROUP BY region tells SQL to place rows with the same region value together, then calculate each aggregate independently inside each group.
For the sample data, the result would look like this:
| region | order_count | total_net_sales | average_order_value | smallest_order_value | largest_order_value |
|---|---|---|---|---|---|
| West | 3 | 700.00 | 233.33 | 150.00 | 300.00 |
| East | 3 | 300.00 | 100.00 | 80.00 | 120.00 |
NULL | 1 | 90.00 | 90.00 | 90.00 | 90.00 |
Notice that GROUP BY creates a group for NULL regions. The NULL label still indicates missing source data; it does not mean the region is genuinely called “NULL.”
If the report needs a readable label, use COALESCE consistently in both SELECT and GROUP BY:
SELECT
    COALESCE(region, 'Unknown') AS reporting_region,
    COUNT(*) AS order_count,
    SUM(net_sales) AS total_net_sales
FROM PORTFOLIO_DB.RAW.SALES_ORDER
GROUP BY COALESCE(region, 'Unknown')
ORDER BY total_net_sales DESC;
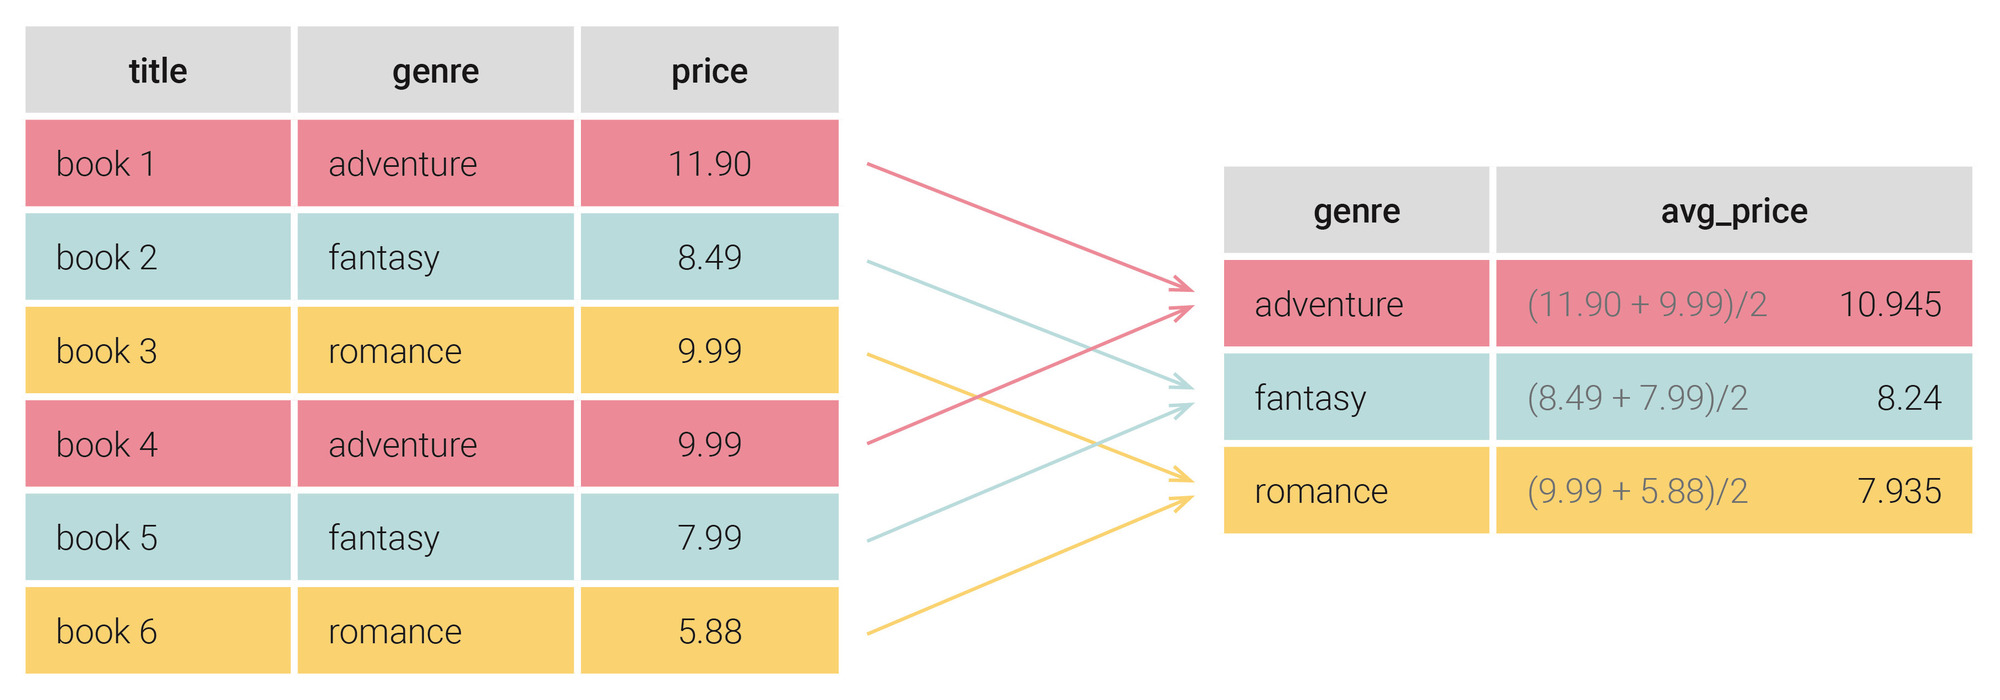
A safe rule is:
Every selected expression must either be aggregated or identify the group.
This is valid:
SELECT
    region,
    SUM(net_sales) AS total_net_sales
FROM PORTFOLIO_DB.RAW.SALES_ORDER
GROUP BY region;
This is not valid:
-- Invalid: category is neither aggregated nor grouped.
SELECT
    region,
    category,
    SUM(net_sales) AS total_net_sales
FROM PORTFOLIO_DB.RAW.SALES_ORDER
GROUP BY region;
Snowflake cannot choose one category value to represent a region that contains multiple categories. Decide what the report should mean instead.
If the requested grain is one row per region and category, group by both fields:
SELECT
    region,
    category,
    COUNT(*) AS order_count,
    SUM(net_sales) AS total_net_sales
FROM PORTFOLIO_DB.RAW.SALES_ORDER
GROUP BY
    region,
    category
ORDER BY
    region,
    category;
Adding grouping columns makes the result more detailed. A report grouped by region has a coarser grain than a report grouped by region and category. Defining this grain correctly is central to KPI verification.
SQL Aggregate Functions: A Comprehensive Guide for Beginners | LearnSQL.com
Read the relevant sections of LearnSQL.com’s guide to reinforce the basic functions, grouped summaries, the difference between WHERE and HAVING, and the COUNT(*) versus COUNT(column) distinction.
In “Common SQL Aggregate Functions,” start with the overview, then read the short SUM(), COUNT(), AVG(), MIN(), and MAX() subsections. In “Using Aggregate Functions with GROUP BY,” read the grouping explanation and follow the city, product-category, and year-month examples. In “Product Categories with High Sales,” read the HAVING distinction. Finally, in “Advanced Usage of COUNT() Function,” read the COUNT comparison, paying particular attention to how missing values affect the two counts.
Use WHERE for rows and HAVING for groups
WHERE and HAVING both filter data, but they act at different stages.
A useful simplified sequence is:
FROMidentifies the source table.WHEREremoves individual rows.GROUP BYforms groups from the remaining rows.- Aggregate functions calculate metrics for each group.
HAVINGremoves groups based on their calculated metrics.SELECTpresents the output columns.ORDER BYsorts the final result.
Suppose the business request is:
For completed orders only, show regions with at least three orders and at least 500 in net sales.
SELECT
    region,
    COUNT(*) AS completed_order_count,
    SUM(net_sales) AS completed_net_sales
FROM PORTFOLIO_DB.RAW.SALES_ORDER
WHERE order_status = 'COMPLETED'
GROUP BY region
HAVING COUNT(*) >= 3
   AND SUM(net_sales) >= 500
ORDER BY completed_net_sales DESC;
The WHERE condition operates on each original order row. The HAVING conditions operate on the completed regional summaries.
Why this common query fails
-- Incorrect
SELECT
    region,
    SUM(net_sales) AS total_net_sales
FROM PORTFOLIO_DB.RAW.SALES_ORDER
WHERE SUM(net_sales) >= 500
GROUP BY region;
WHERE runs before grouping and before SUM(net_sales) exists. SQL therefore cannot use an aggregate in this row-level filter.
Use HAVING instead:
SELECT
    region,
    SUM(net_sales) AS total_net_sales
FROM PORTFOLIO_DB.RAW.SALES_ORDER
GROUP BY region
HAVING SUM(net_sales) >= 500;
Put each filter in its proper place
| Requirement | Correct clause | Reason |
|---|---|---|
| Include only completed orders | WHERE | Tests a property of each row |
| Exclude orders with missing sales | WHERE net_sales IS NOT NULL | Tests a property of each row |
| Show regions with at least 10 orders | HAVING COUNT(*) >= 10 | Tests a group-level count |
| Show categories above 50,000 revenue | HAVING SUM(net_sales) > 50000 | Tests a group-level total |
| Sort from highest to lowest revenue | ORDER BY total_net_sales DESC | Sorts final output |
Although some databases, including Snowflake in certain situations, permit a SELECT alias in HAVING, write the full aggregate expression while you are building foundational habits:
HAVING SUM(net_sales) >= 500
This is portable SQL and makes the business rule obvious.
Master the SQL SELECT statement part 06: Aggregate Functions, GROUP BY and HAVING clauses
Watch the focused HAVING section of “Master the SQL SELECT statement part 06: Aggregate Functions, GROUP BY and HAVING clauses” by Michael Fudge. It clarifies the timing difference between WHERE and HAVING, which is a frequent source of reporting errors.
Watch the setup for the relationship between grouping, counts, and missing values. Then watch the HAVING explanation, concentrating on why a condition based on an average or total must be applied after aggregation, while ordinary row conditions belong in WHERE.
A reporting and QA pattern you can reuse
For an initial KPI summary, avoid starting with a complex dashboard calculation. First write a compact SQL query that makes its assumptions visible.
SELECT
    COALESCE(region, 'Unknown') AS reporting_region,
    COUNT(*) AS completed_orders,
    COUNT(sales_rep_id) AS orders_with_assigned_rep,
    SUM(net_sales) AS completed_net_sales,
    AVG(net_sales) AS average_completed_order_value,
    MIN(net_sales) AS smallest_completed_order,
    MAX(net_sales) AS largest_completed_order
FROM PORTFOLIO_DB.RAW.SALES_ORDER
WHERE order_status = 'COMPLETED'
GROUP BY COALESCE(region, 'Unknown')
HAVING COUNT(*) >= 1
ORDER BY completed_net_sales DESC;
This single query communicates several important facts:
- The metric covers only rows explicitly marked
COMPLETED. - Missing regions are retained and visibly labeled
Unknown. completed_orderscounts all qualifying order rows.orders_with_assigned_repreveals whether ownership data is incomplete.- The average has context because the count is displayed alongside it.
- The minimum and maximum help spot unexpectedly small or large values.
- The grain is one row per reporting region.
Before accepting a reported total, perform a quick reconciliation:
- Run the grouped query.
- Add the
completed_net_salesvalues from its groups. - Run a separate overall-total query using the same row-level filter.
- Confirm the two totals agree.
SELECT
    SUM(net_sales) AS independently_calculated_completed_net_sales
FROM PORTFOLIO_DB.RAW.SALES_ORDER
WHERE order_status = 'COMPLETED';
For a single table and identical filtering, the sum of regional totals should equal this independently calculated overall total. If it does not, investigate differences in filters, missing-group treatment, duplicated rows, or accidental changes to the reporting grain. Later lessons will make this kind of verification more rigorous when joins and multi-step queries are involved.
Key takeaways
Aggregate functions turn detail rows into reporting metrics:
COUNT(*)
SUM(net_sales)
AVG(net_sales)
MIN(net_sales)
MAX(net_sales)
COUNT(*) counts rows, while COUNT(column) counts only non-NULL values. SUM, AVG, MIN, and MAX also generally ignore NULL, so pair metrics with completeness counts when missing data could affect interpretation.
GROUP BY determines the grain of the output. If a report selects region, category, and a total, it must group at the intended region-category level.
Finally, remember the filtering distinction:
WHERE   -- filters source rows before aggregation
HAVING  -- filters completed groups after aggregation
Next, you will combine tables using INNER JOIN and LEFT JOIN. The grain discipline from this lesson will become even more important there, because an incorrect join can inflate COUNT and SUM results without producing an obvious error.
Can't find a good explanation? Sign up and we'll make it for you
Sign up