
Hello! Welcome to your third lesson in the module on Torsion and Bending in Beams.
In our last lesson, we explored how to analyze shafts under torsional loads. A key skill you practiced was creating an internal torque diagram by making imaginary "cuts" along the shaft and applying equilibrium to find the torque in each section. This method is fundamental, and today we will apply the exact same logic to beams under transverse loads (loads perpendicular to their length).
The goal of this lesson is to construct shear force and bending moment diagrams for beams under various loads. These diagrams are arguably the most important tools in beam analysis. They provide a complete picture of the internal forces and moments acting throughout the beam, allowing us to pinpoint locations of maximum stress.
1. What are Shear Force and Bending Moment?
When you apply loads to a beam, it doesn't just sit there; internal forces develop within the material to resist the external loads and keep the beam in equilibrium. We can represent these internal forces at any cut section with two resultants:
- Shear Force (V): The resultant of vertical internal forces. It's a measure of the tendency for one part of the beam to slide vertically with respect to an adjacent part.
- Bending Moment (M): The resultant of normal internal forces (tension and compression). It's a measure of the tendency for the beam to bend or rotate at the section.
The following video provides an excellent visualization of what these internal forces are and how they arise.
Understanding Shear Force and Bending Moment Diagrams
Watch this segment from 'Understanding Shear Force and Bending Moment Diagrams' by The Efficient Engineer. It clearly explains the origin of internal shear forces and bending moments.
Watch from the beginning to 1:50. Focus on how the external loads create internal compressive and tensile stresses, which result in an internal bending moment, and vertical shear stresses, which result in an internal shear force.
Sign Convention
To construct these diagrams consistently, we need a standard sign convention. While different conventions exist, the one based on how the beam deforms is the most common in mechanics of materials.
Shear and Moment Diagrams – An Ultimate Guide
Please read this short section from 'Shear and Moment Diagrams – An Ultimate Guide' by EngineeringSkills. It clearly defines the deformation-based sign convention we will be using.
Read only section 5.4, 'Sign convention for shear force and bending moment'. Pay close attention to the diagrams showing positive vs. negative shear and moment.
Here is a summary of the key points on sign convention:
-
Bending Moment (M):
- Positive (+M): Causes the beam to "sag" or hold water (concave up). This puts the bottom fibers in tension and the top fibers in compression.
- Negative (-M): Causes the beam to "hog" or shed water (concave down). This puts the top fibers in tension and the bottom fibers in compression.
-
Shear Force (V):
- Positive (+V): The forces on the segment tend to cause a clockwise rotation.
- Negative (-V): The forces on the segment tend to cause a counter-clockwise rotation.
2. Method 1: The Equation Method (Method of Sections)
This method is the most fundamental and is identical to the process you used to find internal torque. You will make a cut, isolate a segment of the beam, and use the equations of static equilibrium to derive functions for shear force, , and bending moment, .
The general procedure is:
- Calculate Support Reactions: Draw a Free-Body Diagram (FBD) of the entire beam and use the equilibrium equations (, , ) to find all unknown support reactions.
- Make a Cut: For each region of the beam between loads, make an imaginary cut at a variable distance from the origin.
- Apply Equilibrium: Draw an FBD of the segment to one side of the cut. Apply the equilibrium equations to this segment to solve for and as functions of .
- Plot the Equations: Plot the functions and for each region to create the final diagrams.
The following video demonstrates this "segment method" with a clear, step-by-step example.
How to Draw Shear Force and Moment Diagrams | Mechanics Statics | (Step by step solved examples)
This video from Question Solutions shows how to use the equation method to construct the SFD and BMD for a simply supported beam with a point load.
Watch the first example from 1:12 to 5:48. Notice how a different set of equations is needed for the segment before the load (0 < x < 2m) and after the load (2m < x < 6m).
This method is robust and always works, but it can be time-consuming for complex loading.
3. Method 2: The Graphical Method (Relationships)
A much faster way to construct these diagrams is by understanding the mathematical relationships between the load (), shear force (), and bending moment (). These relationships allow us to sketch the diagrams by inspection.
The key relationships are:
| Relationship (Differential) | Relationship (Integral) | Practical Meaning |
|---|---|---|
| The slope of the shear diagram at a point is the negative of the load intensity. | ||
| The slope of the moment diagram at a point is equal to the value of the shear force. |
This means:
- The change in shear between two points is the negative area under the loading curve.
- The change in moment between two points is the area under the shear diagram.
The following video explains these powerful relationships.
Understanding Shear Force and Bending Moment Diagrams
Let's return to The Efficient Engineer video, which masterfully explains these graphical relationships.
Watch from 8:39 to 12:35. This section explains the differential and integral relationships and shows how to use them to construct and check your diagrams. A critical takeaway is that maximum bending moment occurs where the shear force is zero.
Let's look at a practical example of applying this graphical method.
How to Draw Shear Force and Moment Diagrams | Mechanics Statics | (Step by step solved examples)
The 'Question Solutions' video also demonstrates this faster method. Watch this example for a beam with multiple concentrated loads.
Watch from 10:00 to 12:55. See how the shear diagram is constructed by 'following the forces' up and down, and the moment diagram is constructed by calculating the areas under the shear diagram.
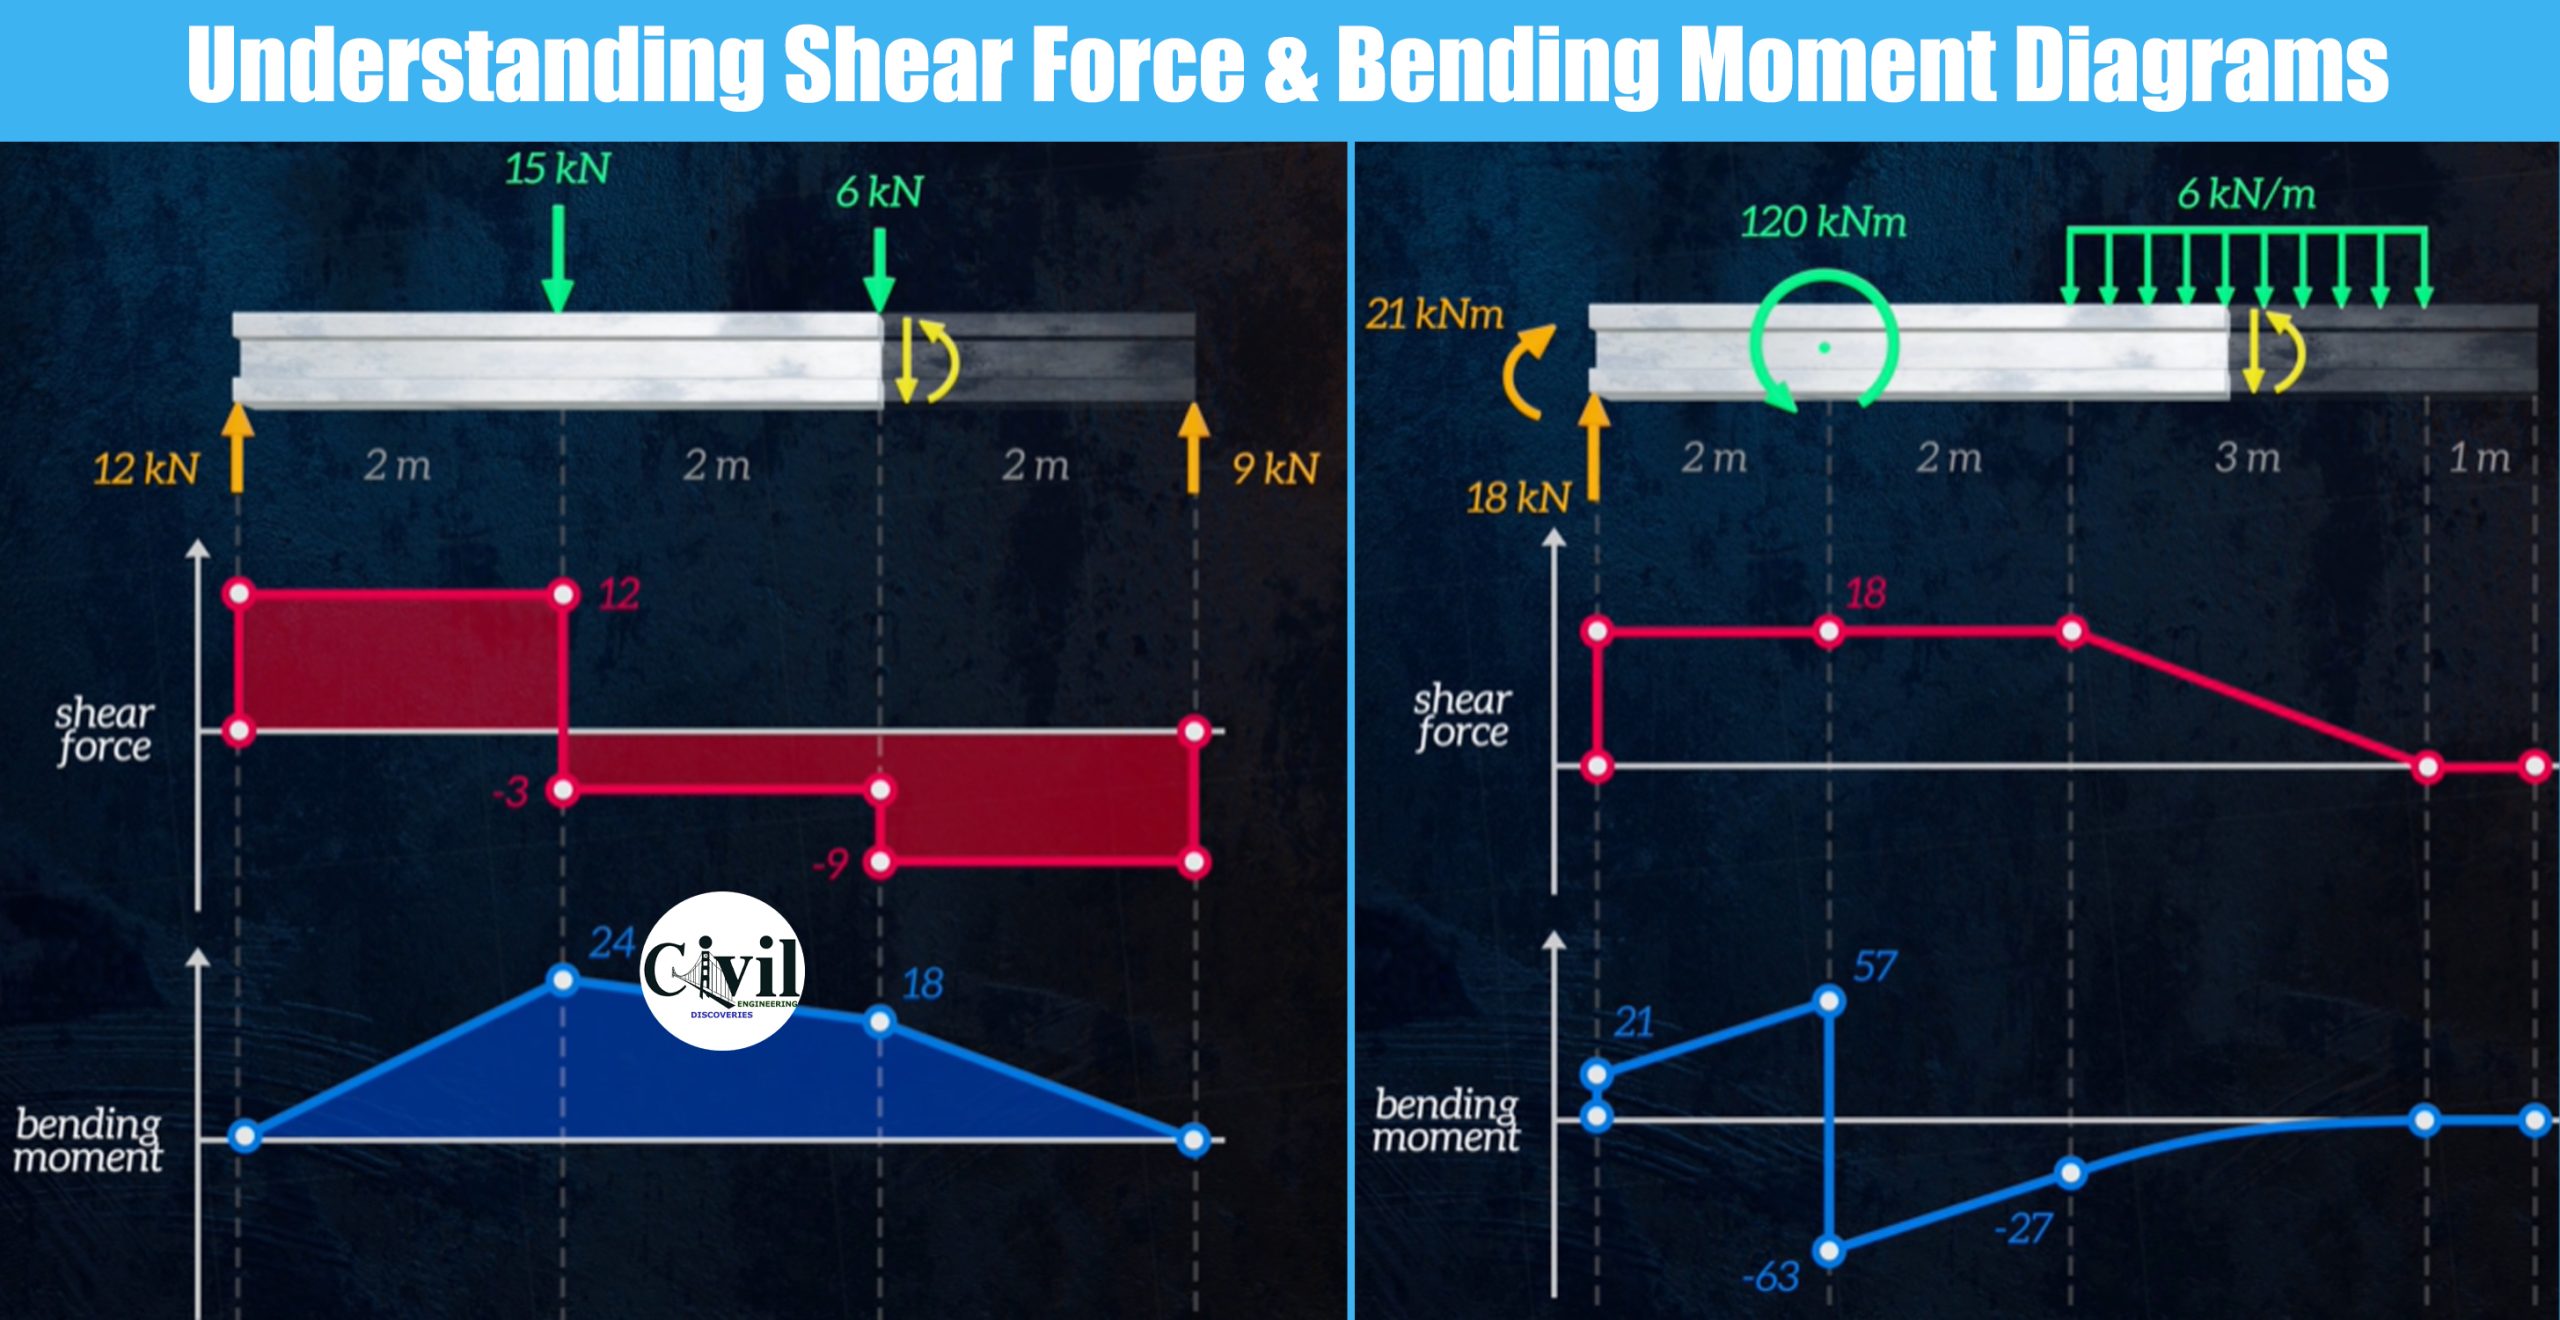
The image below shows diagrams for two common cases. On the left, point loads create constant shear sections and linear moment sections. On the right, a uniformly distributed load (UDL) creates a linear shear diagram and a parabolic (2nd-degree) moment diagram.
Test your understanding!
Look at the right-hand example in the image above (the cantilever beam).
- At the fixed wall (left end), the shear force is at its maximum positive value. According to the relationship , what should the slope of the bending moment diagram look like at that point?
- Where the shear force diagram crosses the x-axis (V=0), what happens on the bending moment diagram?
Show answer
- Since is large and positive at the wall, the slope of the bending moment diagram should be large and positive (steeply increasing). The diagram shows this.
- Where , the slope of the moment diagram must also be zero. This corresponds to a local maximum or minimum on the bending moment diagram. In this case, it's the point of maximum negative moment (maximum hogging).
4. A Comprehensive Example
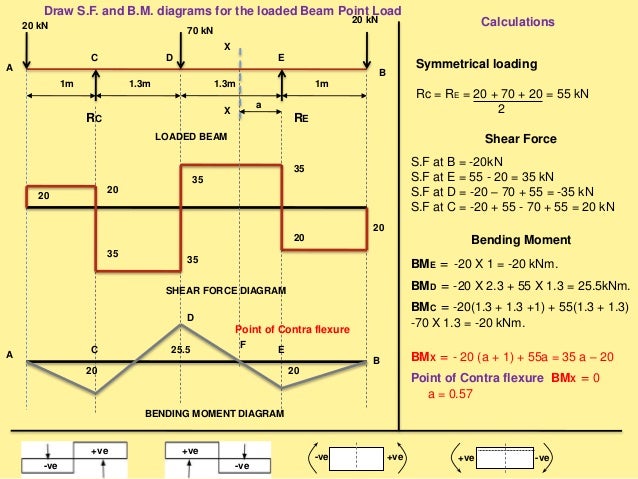
Now let's see how these methods are applied to a beam with a mix of point loads and distributed loads. Calculating the reactions is always the first step. Then, you can use the graphical method to quickly sketch the shapes and find the values at key points.
The following text provides a few more standard examples.
Shear Force and Bending Moment Diagram Examples
This PDF document from Rohini College of Engineering & Technology provides several clear, formula-based examples.
Skim through the first three examples (sections 2.3, 2.3.1, and 2.3.2) covering a central point load, multiple point loads, and a uniformly distributed load. You don't need to read every line of calculation, but observe the process: 1. Find reactions. 2. Calculate V at key points. 3. Calculate M at key points. 4. Draw the diagrams.
Conclusion
In this lesson, you learned the two primary methods for constructing shear force and bending moment diagrams, which are indispensable tools for any engineer designing structures.
Key Takeaways:
- Shear force () and bending moment () diagrams are graphical representations of the internal forces along a beam's length.
- The Equation Method involves writing and plotting equations and derived from equilibrium. It is thorough but can be slow.
- The Graphical Method uses the relationships and to quickly sketch the diagrams. This is the preferred method for most engineers.
- A point load causes a "jump" in the shear diagram. A point moment causes a "jump" in the moment diagram.
- Maximum bending moment always occurs where the shear force is zero (). This is the most critical point for design against bending failure.
Next Lesson Preview:
Constructing the bending moment diagram is not the end goal, but a means to an end. The entire purpose of this process is to find the maximum bending moment, . In our next lesson, we will take the value from the BMD and plug it into the flexure formula to calculate the maximum bending stress in the beam, bringing us one step closer to a complete beam design.
Can't find a good explanation? Sign up and we'll make it for you
Sign up