
Good to see you again. In the previous lesson, you extracted profit and cash-flow figures and learned why net income is not the same thing as cash generation. Now we add the missing snapshot: the balance sheet.
A balance sheet helps answer three practical questions before you form a stock view:
- Can the company meet obligations due soon?
- Is its debt burden proportionate to its resources and earning power?
- Is the shareholders' claim on the business strengthening or weakening, and why?
By the end of this lesson, you will be able to read those questions from an annual or quarterly balance sheet, calculate a compact set of ratios, and identify when the headline numbers need investigation in the notes.
The balance sheet: a dated map of resources and claims
Where an income statement and cash-flow statement cover a period, the balance sheet is a snapshot at a particular date, such as 31 December or the end of a fiscal quarter.
Its governing identity is:
- Assets are resources controlled by the company: cash, inventory, customer receivables, equipment, intellectual-property-related assets, and more.
- Liabilities are obligations to other parties: supplier invoices, taxes, deferred revenue, lease obligations, and borrowings.
- Shareholders' equity is the residual book value after liabilities are deducted from assets.
Equity is therefore:
This is book equity, an accounting value. It is not the same as market capitalization. A profitable company can have a market value far above its book equity; a distressed company may trade below it.
US reports usually call this document a balance sheet. UK and IFRS reports may call it a statement of financial position. The essential structure is the same. As before, write down the reporting date, currency, and unit scale before calculating anything.
How to Analyze a Balance Sheet Like a Hedge Fund Analyst
Watch How to Analyze a Balance Sheet Like a Hedge Fund Analyst from Investor Center for a compact visual orientation to the balance-sheet equation, the current versus non-current split, and the logic of net debt.
Watch the structure for the accounting equation and the meaning of current assets and liabilities. Then watch the debt analysis for the process of consolidating debt lines and comparing borrowings with liquid cash. Focus on the procedure rather than treating the historical company figures or any single ratio threshold as universal.
A useful first distinction is the one-year boundary:
| Category | Usually includes | Main analytical question |
|---|---|---|
| Current assets | Cash, short-term investments, receivables, inventory, prepayments | What resources may support the next 12 months? |
| Non-current assets | PP&E, long-term investments, goodwill, intangible assets | What longer-lived resources support operations? |
| Current liabilities | Accounts payable, accrued costs, current debt maturities, deferred revenue | What is due within roughly a year? |
| Non-current liabilities | Long-term debt, lease liabilities, deferred taxes | What obligations extend beyond a year? |
The order of current assets is informative. Cash is already cash. Marketable securities may be highly liquid. Receivables depend on customers paying. Inventory has to be sold, and prepayments may not be recoverable as cash at all. A ratio that treats all current assets as equally available is only a starting approximation.
Liquidity: can the company cover near-term obligations?
Liquidity concerns the ability to meet short-term obligations without needing to sell long-lived assets, raise emergency finance, or disrupt normal operations.
Three related measures give progressively stricter views.
A Financial Statement Analysis - Principles of Accounting, Volume 1: Financial Accounting | OpenStax
Read the liquidity and solvency sections of OpenStax's A Financial Statement Analysis. It establishes the purpose of the ratios before you apply them to an investor's balance-sheet screen.
In “Overview of Financial Ratios,” read the “Liquidity Ratios” section and its “Working Capital,” “Current Ratio,” and “Quick Ratio” subsections. Start with the liquidity overview; focus on why inventory and prepaid expenses receive more cautious treatment in the quick ratio. Then read “Solvency Ratios” through “Debt to Equity Ratio,” beginning with the solvency overview.
Working capital
Working capital is the monetary buffer between current resources and current obligations:
Positive working capital is often reassuring, but its size alone is not enough. A million buffer means something very different to a small business than to a multinational. More importantly, it may consist mainly of slow-moving inventory or doubtful receivables.
Current ratio
The current ratio expresses the same relationship in scalable form:
A value of means reported current assets equal reported current liabilities. A value below deserves attention, but it does not automatically mean imminent failure. A supermarket may operate safely with lower liquidity because it sells inventory quickly and pays suppliers later. A subscription software company can carry substantial deferred revenue, which is a liability despite the company already having the customer's cash.
Conversely, a ratio well above is not automatically excellent. It may result from excessive stock, overdue customer invoices, or cash that is restricted and cannot be deployed freely.
Quick ratio
The quick ratio excludes assets that may not be quickly converted to cash:
An alternative calculation is current assets less inventory and prepayments, divided by current liabilities. The company’s line items determine which form is more transparent. State the formula you used.
Cash ratio
The strictest simple version considers only immediately available cash and highly liquid investments:
This does not mean a company needs a cash ratio above . Most healthy operating businesses expect to collect receivables and generate cash during the year. The cash ratio instead tells you how much of the short-term obligation base is covered before assuming those normal operating inflows.
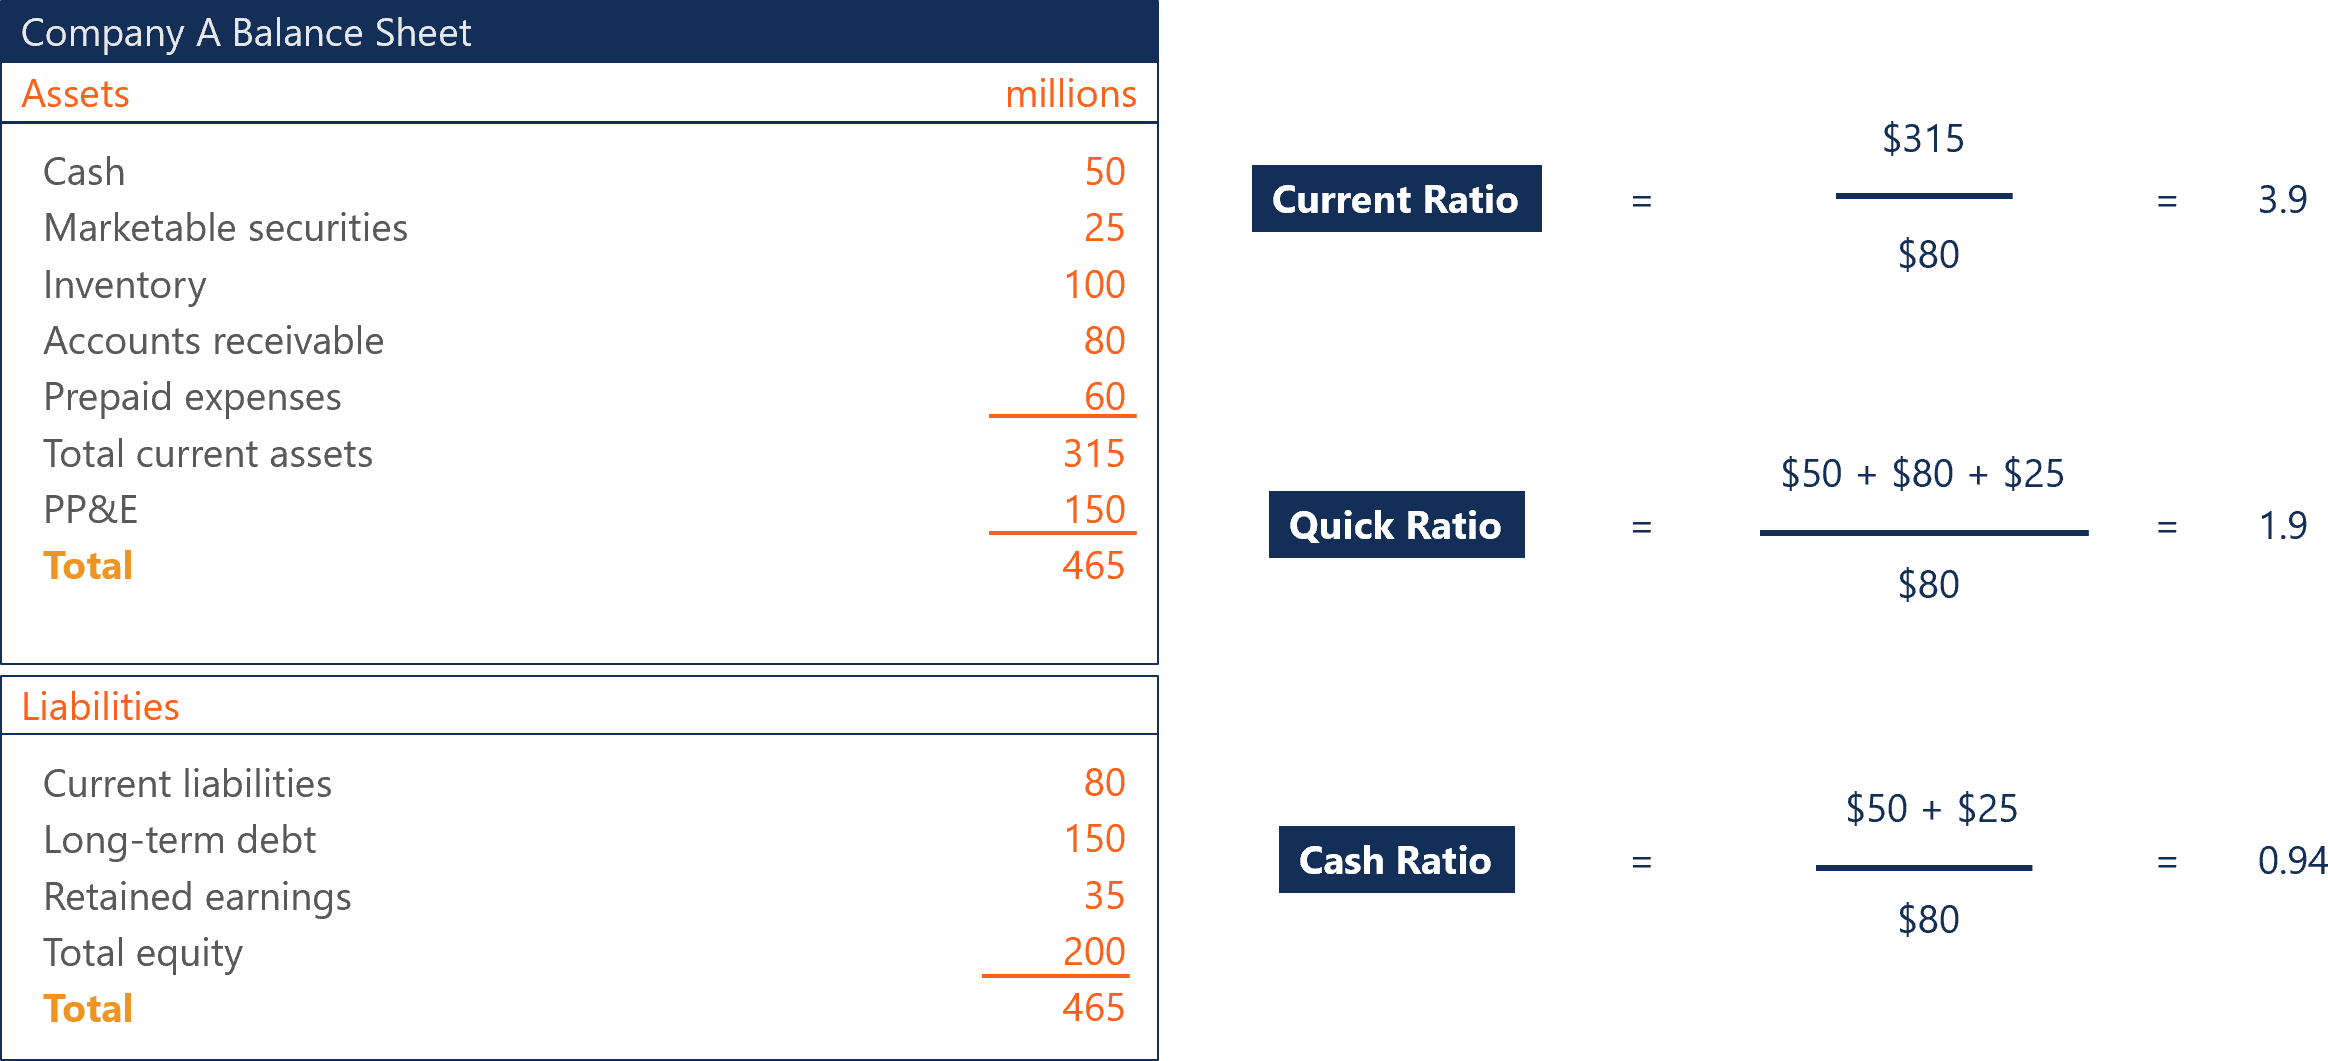
Using the figures in the illustration, in millions:
The interpretation is more useful than the arithmetic:
- Current assets cover current liabilities nearly four times over.
- Even after excluding inventory and prepaid expenses, quick assets cover current liabilities about 1.9 times.
- Immediate cash and marketable securities cover of current liabilities.
That appears liquid on this simplified data. Yet a proper analysis still asks: Are the receivables collectible? Is inventory becoming obsolete? Is any cash restricted? The illustration is useful for liquidity calculations, but its abbreviated equity presentation should not be used as a full balance-sheet reconciliation.
Liquidity quality: look beneath the totals
When current ratio and quick ratio give different messages, the difference itself is evidence.
- A high current ratio but weak quick ratio means liquidity depends heavily on inventory or prepayments.
- Rapidly rising receivables relative to revenue may indicate slower customer payment, more aggressive credit terms, or collection problems.
- Rising inventory faster than sales can signal weak demand, overproduction, or an impending write-down.
- A sharp fall in cash, particularly alongside rising current debt, deserves an explanation from the cash-flow statement and management discussion.
- Deferred revenue is a liability, but it can be less alarming than debt because it often means the company received customer cash in advance and still owes the service.
For a retailer, inventory quality and turnover are central. For a software firm, deferred revenue and receivables often matter more. This is why a single target such as “current ratio must exceed two” is a weak investing rule.
Debt burden: separate financing debt from ordinary liabilities
A common beginner error is to treat total liabilities as debt. They are not the same.
Accounts payable, taxes payable, and deferred revenue are liabilities, but they arise from operating the business. For debt analysis, start with interest-bearing borrowings:
- short-term borrowings and commercial paper;
- the current portion of long-term debt;
- bonds, bank loans, and notes due after one year;
- lease liabilities, if your analysis includes leases as financial debt.
The exact classification should be consistent across companies. A debt note in the annual report tells you the maturity dates, interest rates, currencies, and contractual terms hidden behind a single “long-term debt” line.
How to Read a Balance Sheet - A Beginner's Guide
Read the liabilities and equity sections of Corporate Finance Institute's guide to connect the balance-sheet line items with the notes that make them meaningful.
Under “2. Liabilities,” read “Current Liabilities” and “Non-Current Liabilities.” Start with the current-liability discussion. In the non-current-liability subsection, focus on the debt-note discussion, especially maturity, interest-rate, and term information. Then read “3. Shareholders’ Equity,” paying particular attention to paid-up capital, retained earnings, and other comprehensive income.
Gross debt and net debt
First consolidate all interest-bearing debt:
Then compare it with accessible liquidity:
If the result is negative, the company has net cash under your stated definition.
This calculation needs judgment. Do not subtract restricted cash. Also, a company cannot necessarily use every pound or dollar of cash to repay debt: it may require operating cash for payroll, inventory, regulatory capital, or overseas operations. Net debt is a useful screen, not a statement that repayment would literally happen tomorrow.
Debt-to-equity and debt-to-capital
Two balance-sheet ratios put borrowing into the context of the financing structure:
Suppose a company has million of interest-bearing debt and million of shareholder equity:
These measures do not tell you whether the debt is affordable on their own. A stable utility, a heavily capital-intensive railway, and an early-stage software company can all have very different appropriate financing structures.
Use ratios comparatively:
- Compare the company with its own three-to-five-year history.
- Compare it with genuinely similar firms in the same industry.
- Inspect whether the debt is increasing because of productive investment, an acquisition, share buybacks, or cash-flow weakness.
- Read the debt-maturity table. A large amount due soon creates refinancing risk even when total debt looks manageable.
The prior lesson provides the essential second check: operating cash flow and free cash flow. Debt is much safer when a business repeatedly converts profit into cash. Later, when you calculate valuation and returns, you will also use operating profit and interest expense to judge interest coverage. For now, recognize the limit of the balance sheet: it tells you how much debt exists and when it is due, but not fully whether future earnings will service it.
Shareholders' equity: why did the residual claim change?
The equity section commonly contains:
- Share capital / common stock and additional paid-in capital: funds raised from issuing shares.
- Retained earnings: cumulative profits retained in the business, less dividends and other distributions.
- Accumulated other comprehensive income or loss: certain gains and losses recorded outside ordinary net income.
- Treasury shares: the company’s own repurchased shares, usually shown as a deduction from equity.
- Non-controlling interests: a separate claim held by outside owners of consolidated subsidiaries, when applicable.
The key question is not simply whether total equity rose or fell. It is why.
For common shareholders, a simplified reconciliation is:
Imagine beginning equity of million. During the year, the company earns million, records a million other-comprehensive loss, pays million in dividends, and repurchases million of shares:
Equity rose by only million despite million of profit. That is not inherently bad: capital was deliberately returned to shareholders. But it is different from a business that retained the entire profit to strengthen its balance sheet.
Interpreting changes in equity carefully
| Observation | Possible interpretation | What to check |
|---|---|---|
| Retained earnings rise steadily | Profits have accumulated in the business | Whether profits also convert into operating cash flow |
| Equity rises mainly after issuing shares | More capital was raised, but existing holders may be diluted | Share count and reason for the issuance |
| Equity falls despite profit | Dividends or buybacks may exceed earnings | Financing cash flows and debt trend |
| Equity falls after a large loss | The business may have had weak operating performance or an asset impairment | Income statement, impairment note, asset quality |
| Equity is very low or negative | Leverage risk may be substantial; debt-to-equity may become misleading | Debt maturities, cash generation, and reasons for the deficit |
Share repurchases deserve special care. Buybacks reduce cash and equity, which can mechanically make debt-to-equity appear worse and can later make return-on-equity appear unusually high. Neither result proves that the business became economically weaker or stronger. You need the full capital-allocation context.
Similarly, goodwill and intangible assets can make equity look larger than the tangible assets that might be recoverable in distress. A company built through acquisitions may later record a goodwill impairment, reducing both assets and equity. That does not create the underlying economic problem, but it can reveal that a prior acquisition was overvalued.
A repeatable balance-sheet screen
For each US or UK company you examine, use the consolidated annual balance sheet first. Quarterly reports are useful for updates, but annual data makes a cleaner initial comparison. A spreadsheet is better than relying only on a financial-data portal, because it records your definitions and lets you compare periods consistently.
Use this compact worksheet:
| Area | Extract or calculate | Interpretation note |
|---|---|---|
| Context | Report date, currency, units | Compare equivalent reporting dates to reduce seasonal distortion |
| Liquidity | Cash, short-term investments, receivables, inventory, current assets, current liabilities | Identify which assets actually support liquidity |
| Liquidity ratios | Working capital, current ratio, quick ratio, cash ratio | Compare with history and appropriate peers |
| Debt | Current debt, long-term debt, lease liabilities if included | Reconcile total debt from the debt note |
| Net debt | Debt less clearly available cash and liquid investments | Flag restricted cash and operational-cash needs |
| Capital structure | Debt-to-equity and debt-to-capital | Label whether you used gross or net debt |
| Equity movement | Beginning equity, ending equity, retained earnings, dividends, buybacks, issuance, OCI | Explain the change rather than merely reporting it |
| Quality checks | Receivables, inventory, goodwill, short-term maturities | Write the one or two biggest uncertainties |
A sensible final note might read:
Liquidity is adequate because quick assets exceed current liabilities, but the current ratio is supported partly by rising inventory. Gross debt increased, and a meaningful portion matures within the next year. Equity increased modestly due to retained earnings, while the company also returned capital through dividends. The next check is whether operating cash flow and free cash flow can support debt service and shareholder distributions.
That is a factual assessment, not a buy or sell recommendation. It is exactly the kind of evidence you will later combine with profitability, valuation, price structure, and risk controls.
TradingView can help you observe price reaction around earnings releases and maintain a watchlist, but use the company’s filed annual report and its notes as the source for balance-sheet interpretation. Aggregated financial-data screens often omit maturity detail, restricted cash, lease treatment, and equity reconciliations.
Key takeaways
- The balance sheet is a snapshot of assets, liabilities, and shareholder equity at a reporting date.
- Liquidity is not just a current ratio. Compare working capital, current ratio, quick ratio, and cash ratio, then inspect the quality of receivables, inventory, and cash.
- Total liabilities are not total debt. Identify interest-bearing borrowings, inspect their notes and maturity profile, then calculate gross debt and net debt using a clearly stated definition.
- Debt-to-equity and debt-to-capital describe financing structure, but they need context from peers, history, operating cash flow, and future maturities.
- Equity changes because of profit, dividends, buybacks, share issuance, other comprehensive income, and accounting adjustments. A change in equity is evidence to explain, not a verdict by itself.
- The most reliable basic analysis combines the balance sheet with the profit and cash-flow work from the previous lesson.
Next, you will turn these extracted figures into investor-oriented measures: earnings growth, return on equity, P/E, price-to-sales, and free-cash-flow yield, always comparing a company with its own history and appropriate peers.
Can't find a good explanation? Sign up and we'll make it for you
Sign up