
Welcome. This begins the Fundamental Analysis of US and UK Stocks module. Charts tell you what the market has priced; financial statements help you investigate what business performance may lie beneath that price. In this lesson, you will build a repeatable way to pull a small set of core figures from an annual or quarterly report and, crucially, avoid treating reported profit as if it were cash.
By the end, you should be able to locate revenue, operating profit, net income, operating cash flow, capital expenditure, and free cash flow; calculate useful margins; and explain why a profitable company can still have weak cash generation.
The financial-statement map: two views of the same business
A public company’s financial reporting contains three connected statements:
- Income statement: performance over a period. It records revenue earned and expenses incurred, arriving at profit.
- Balance sheet: a snapshot at a date. It records what the company owns, owes, and the residual value belonging to shareholders.
- Cash flow statement: cash movements over a period. It reconciles accounting profit with actual changes in cash.
For this lesson, think of the income statement as answering:
“Did the business earn a profit during this quarter or year?”
The cash flow statement asks a different question:
“Did the business’s normal operations actually produce cash during that period, after the timing effects of accounting?”
That distinction is fundamental to stock analysis. A business can report strong earnings while cash is tied up in unpaid customer invoices or inventory. Conversely, a company can report weak profit in a period while operating cash flow is temporarily strong because customers paid old invoices or the company delayed paying suppliers.
Before comparing companies, always record:
- Period: annual versus quarterly, and the fiscal year-end.
- Currency: USD for many US firms; GBP for many UK firms, though some UK-listed companies report in USD or another currency.
- Units: “in thousands,” “in millions,” or “in billions.”
- Scope: continuing operations, total group, or profit attributable to common shareholders.
Absolute figures in GBP and USD are not directly comparable without currency conversion. Ratios such as margins, however, remain useful because they scale each number to the company’s own revenue.
Reading the income statement: from sales to profit
The income statement is usually arranged as a descending sequence: revenue at the top, then the costs required to create and run the business, then taxes and other items, with net income near the bottom.
A US company might call revenue net sales, revenue, or net operating revenues. A UK company may use revenue or turnover. The labels vary, but the job is the same: locate the amount earned from customers during the reporting period.
The core extraction path is:
| Metric | Typical line-item labels | What it tells you |
|---|---|---|
| Revenue | Revenue, net sales, turnover | Scale of customer sales |
| Gross profit | Gross profit | Revenue left after direct costs of providing goods or services |
| Operating profit | Operating income, income from operations, operating profit | Profit from core business operations |
| Net income | Net income, net earnings, profit for the year | Profit after interest, tax, and other non-operating items |
| Operating cash flow | Net cash provided by operating activities | Cash generated or used by normal operations |
| Capital expenditure | Purchases of property, plant and equipment; additions to PP&E | Cash invested in long-lived operating assets |
| Free cash flow | Often company-defined; commonly operating cash flow less capital expenditure | Cash remaining after operational investment under a stated definition |
Revenue: the top line
Revenue is not necessarily cash received. Under accrual accounting, a company records revenue when it has earned it, not necessarily when the customer has paid.
Suppose a software company signs a customer and provides services worth on credit. It may record revenue of this quarter. If the invoice is unpaid at quarter-end, the company has reported revenue and potentially profit, but it has not yet received the in cash.
This is not automatically a problem. Credit sales are ordinary in many industries. The question is whether revenue is ultimately converted into cash on a reasonable timetable.
Operating profit: core-business profitability
Operating profit is the profit after direct costs and operating expenses, but before financing costs and taxes. It is often the cleanest first view of the economics of the operating business.
For a retailer, operating expenses can include store staff, rent, logistics, advertising, and head-office costs. For a software company, the cost structure may include cloud hosting, sales and marketing, research and development, and administration.
Operating profit is especially useful because it reduces noise from items such as:
- interest paid on debt;
- interest earned on cash;
- tax rates;
- some investment gains or losses;
- one-off non-operating items.
It is not a perfect measure of “normal” earnings, because a company may classify unusual costs as operating expenses. But it is generally more informative about the core business than net income alone.
Net income: the bottom line, with caveats
Net income is the residual profit after interest, taxes, and other non-operating items. It matters: shareholders ultimately own the business’s residual earnings. But it can move sharply because of factors that do not necessarily reflect a change in day-to-day trading.
Examples include:
- a large tax adjustment;
- interest expense following new borrowing;
- a gain from selling an investment;
- accounting revaluations;
- restructuring or impairment charges.
When you extract net income, prefer the figure attributable to common shareholders when it is separately presented. It is usually closer to the earnings that relate to the listed ordinary shares you might buy.
How to Read In Income Statement - For Beginners - Profit vs Profit Margin
Watch “How to Read In Income Statement - For Beginners - Profit vs Profit Margin” from Rational Investing with Cameron Stewart, CFA. It gives a practical line-by-line view of how revenue, direct costs, operating expenses, operating income, and net income appear in a real company report.
Start with revenue, focusing on why reported revenue is usually “net” and why a business-specific operating measure can give it context. Continue through cost structure to see how direct costs, gross profit, and operating expenses differ. Finish with profit measures, paying particular attention to the definition of operating income and the items between operating profit and net income.
Margins: convert monetary figures into comparable percentages
A large company will usually report more profit in pounds or dollars than a small company. That does not automatically make it more efficient or more attractive. Margins express profit relative to revenue, letting you compare a company against its own history or against firms of a similar business type.
The basic form is:
The three margins you should be able to calculate are:
Imagine a company with revenue of million, operating profit of million, and net income of million.
The operating margin means that the company retained of operating profit for each of revenue, before interest and tax. The net margin means it retained of final accounting profit per of revenue.
A margin is more informative as a trend than as an isolated number:
- Rising operating margin can indicate improved pricing, cost control, or operating scale.
- Falling operating margin can indicate higher costs, discounting, or weaker unit economics.
- A widening gap between operating and net margin may reflect higher interest costs, taxes, or unusual items.
- Different industries naturally have different margin levels. Comparing a supermarket with a software firm using one “good margin” benchmark would be misleading.
Beginners' Guide to Financial Statement
Read the SEC’s beginner guide as a reliable reference for the structure of income and cash flow statements. It reinforces the exact line-item vocabulary you will encounter in US filings; UK reports use closely related concepts even where labels differ.
In the Income Statements section, read the income-statement path, beginning with the explanation of revenue and continuing through operating profit and net profit. Then scroll to Cash Flow Statements and read the cash-flow overview, including the three activity categories. In the Operating Activities subsection, read the reconciliation to see why net income must be adjusted. Finally, in Financial Statement Ratios and Calculations, read the surrounding short section containing the margin definition; focus on why a percentage of sales is more comparable than a raw profit amount.
Why profit and cash are different
The central bridge between the income statement and cash flow statement is cash flow from operating activities, often shortened to operating cash flow or CFO/OCF.
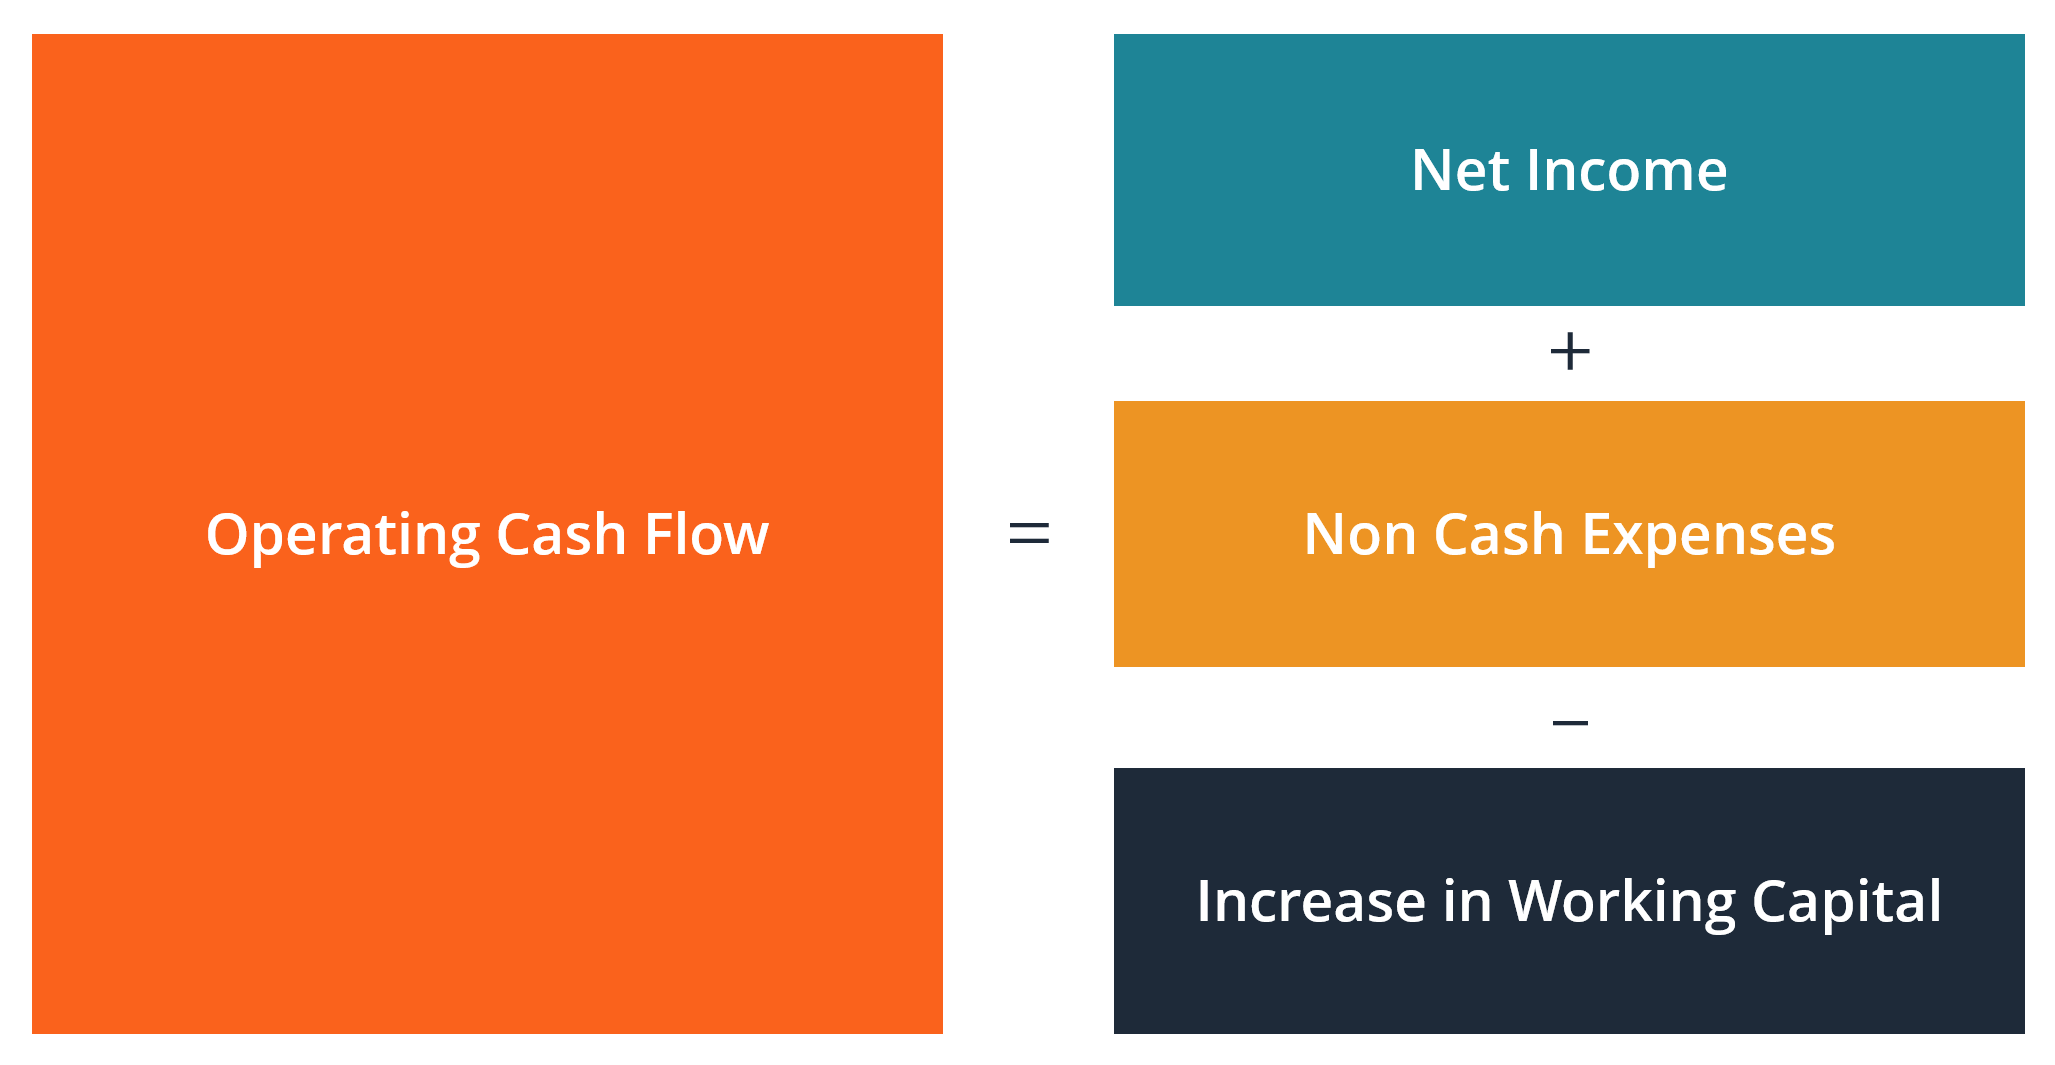
In the common indirect presentation, a cash flow statement begins with net income and adjusts it for two broad categories:
- Non-cash expenses, such as depreciation and amortization.
- Changes in working capital, such as receivables, inventory, and payables.
A useful simplified model is:
Non-cash expenses
Depreciation spreads the cost of a long-lived physical asset, such as machinery, across the years it is expected to be used. Amortization performs a similar function for certain intangible assets.
If a company buys equipment for cash today, the full cash outflow generally appears in investing activities at purchase. The income statement may then recognize depreciation expense over several years. Depreciation reduces accounting profit each year, but it is not a new cash payment in each of those years. Therefore, it is added back when reconciling net income to operating cash flow.
This does not mean depreciation is economically irrelevant. The asset will eventually need maintenance or replacement. That future reinvestment is one reason we also examine capital expenditure and free cash flow.
Working capital: the timing engine
Working capital accounts explain many ordinary gaps between profit and cash.
| If this account increases | Typical cash-flow effect | Intuition |
|---|---|---|
| Accounts receivable | Decreases operating cash flow | Customers owe more cash that has not yet been collected |
| Inventory | Decreases operating cash flow | The company has spent cash building goods not yet sold |
| Accounts payable | Increases operating cash flow | The company has delayed paying suppliers |
| Deferred revenue | Increases operating cash flow | Customers paid before the company recognized all related revenue |
An increase in receivables is not necessarily bad: a rapidly growing company may have sold more on credit. But if receivables consistently grow faster than revenue, it deserves investigation. Similarly, cash flow inflated by ever-increasing payables may mean the company is taking longer to pay suppliers, which may not be sustainable.
Cash Flow Statement: How to Read & Analyze it in 11 Minutes
Watch “Cash Flow Statement: How to Read & Analyze it in 11 Minutes” from Career Principles. It directly connects accrual profit to cash flow and introduces a practical definition of free cash flow.
Watch profit versus cash for the credit-sale example and the high-level distinction among operating, investing, and financing cash flows. Then skip to operating reconciliation, concentrating on the signs of receivables, inventory, and payables adjustments. Finish with free cash flow to see why capital expenditure is separated from routine operating cash generation.
Free cash flow: cash left after operating investment
Operating cash flow tells you whether the normal business generated cash. But a business may need substantial spending on factories, stores, vehicles, data centres, or equipment to sustain and grow that operation.
A common introductory definition of free cash flow is:
For this purpose, capital expenditure, often called capex, is usually found in the investing section as a line such as:
- purchases of property, plant and equipment;
- additions to property, plant and equipment;
- purchases of PP&E.
Free cash flow is not a fully standardized accounting measure. One company may subtract only PP&E purchases; another may make additional adjustments. For your own analysis, write down the definition you use and apply it consistently. Do not compare your calculated figure blindly with a company’s reported “adjusted free cash flow” without checking its definition.
Also, do not treat total cash used in investing activities as capex. Purchases of marketable securities, business acquisitions, and other investments may appear in that section but are conceptually different from spending on the operating asset base.
Walk through a cash flow statement
The sample below presents a statement of cash flows for Company A, in millions. The highlighted groups are the operating, investing, and financing sections.
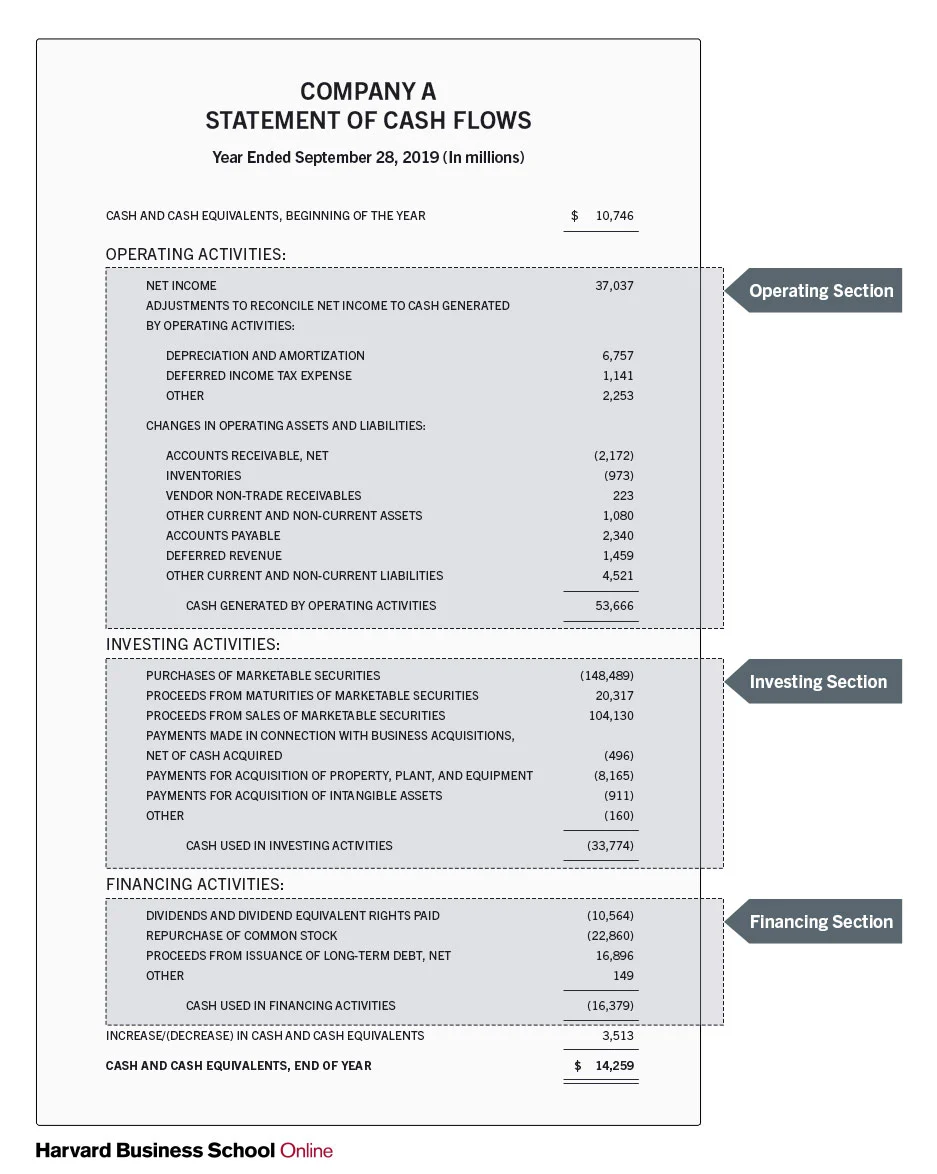
Read the operating section as a reconciliation, not as a random list.
Company A begins with net income of million. It then adds back depreciation and amortization of million, because that expense reduced reported profit but did not require a current-period cash payment.
Next, it adjusts for working-capital movements:
- Accounts receivable increased by million, reducing cash flow because more sales had not yet been collected in cash.
- Inventories increased by million, reducing cash flow because cash was committed to goods held for sale.
- Accounts payable increased by million, increasing cash flow because the company had not yet paid all suppliers.
- Deferred revenue and other liabilities also increased cash flow.
After all listed adjustments, Company A reports cash generated by operating activities of million. Operating cash flow exceeds net income, but the reason is visible in the reconciliation; it is not an assumption that higher cash flow is always better.
In the investing section, the line payments for acquisition of property, plant and equipment is million. Using the simple definition:
The large purchases and sales of marketable securities elsewhere in the investing section should not be substituted for capex in this calculation.
Finally, the financing section shows what the company did with funding and capital: it paid dividends, repurchased shares, and issued long-term debt. These are important shareholder decisions, but they are not part of operating cash flow and are not deducted in the basic free-cash-flow calculation above.
A repeatable extraction routine
When you open a company’s annual report, quarterly report, or investor-results release, use this sequence. It should take roughly five to ten minutes once you become familiar with a company’s reporting format.
- Set the reporting context. Write the company name, period end, period length, reporting currency, and units.
- Open the consolidated income statement. Record revenue, operating profit, and net income attributable to shareholders if available.
- Calculate margins. At minimum, calculate operating margin and net margin. Record gross margin too if gross profit is reported and meaningful for that industry.
- Open the consolidated cash flow statement. Record net cash from operating activities.
- Find capex in investing activities. Look for PP&E purchases or additions. Do not substitute the total investing outflow.
- Calculate free cash flow. State your formula directly beside the number.
- Explain the profit-to-cash gap. Scan the operating-cash-flow reconciliation for depreciation, receivables, inventory, payables, and deferred revenue.
A compact worksheet can look like this:
| Field | Value | Notes |
|---|---|---|
| Revenue | Currency, units, and reporting period | |
| Operating profit | Income statement | |
| Net income | Preferably attributable to common shareholders | |
| Operating margin | Operating profit divided by revenue | |
| Net margin | Net income divided by revenue | |
| Operating cash flow | Cash flow from operating activities | |
| Capex | PP&E purchases or equivalent | |
| Free cash flow | Operating cash flow less capex | |
| Profit-to-cash explanation | Main working-capital and non-cash drivers |
For now, the goal is not to declare a stock “good” or “bad” from one year of data. The goal is to create a reliable factual base. Once extraction is consistent, later analysis can compare trends, peers, debt, valuation, and the market’s expectations.
Key takeaways
- Revenue, operating profit, and net income come from the income statement; they measure accounting performance over a period.
- Margins convert profit into a percentage of revenue, allowing more meaningful comparisons across time and company size.
- Operating cash flow starts with net income but adjusts for non-cash expenses and working-capital timing.
- A company can be profitable without immediately generating equivalent cash, especially when receivables or inventory rise.
- A practical free-cash-flow definition is operating cash flow less capital expenditure, but free cash flow is not fully standardized and its definition must be stated.
- Always extract figures with their period, currency, and units, then explain rather than merely observe the gap between net income and operating cash flow.
Next, you will move to the balance sheet: liquidity, debt burden, and shareholder equity. That will complete the basic three-statement view needed to assess whether a company’s profit and cash generation are supported by a sound financial position.
Can't find a good explanation? Sign up and we'll make it for you
Sign up