
Hello. In the last lesson, you separated an individual share from an index, mutual fund, and ETF. Now we narrow the focus to the information shown for an individual listed share.
A quote screen is often the first thing an analyst sees, but it is not an investment conclusion. It is a dated market snapshot: it describes what was traded, at what prices, and in what quantity. Your task is to read it accurately, distinguish market activity from business value, and avoid drawing more from one day’s figures than the data can support.
By the end of this lesson, you should be able to interpret basic Indian equity quote data: price, traded volume, market capitalization, free float, and delivery quantity.
Start with the date, exchange, and security
Before interpreting any figure, identify:
- The company and symbol: for example, Coal India Limited and
COALINDIA. - The exchange and series:
EQgenerally denotes the normal equity segment. - The date and time: a live quote can change continuously; end-of-day figures refer to a completed session.
- The unit: shares, rupees, lakhs, or crores are not interchangeable.
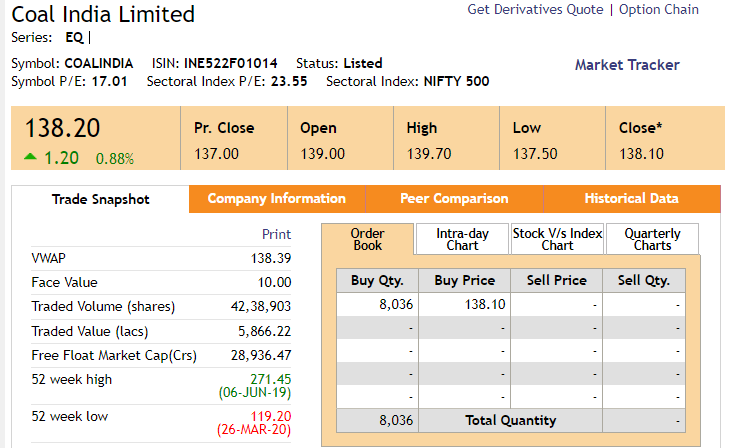
The Coal India stock quote snapshot below is useful because it groups common fields in one place. However, it includes historical 52-week reference dates, so treat it as an illustration of quote-screen structure, not current market data.
A quote screen often also displays an ISIN. An ISIN is a unique security identification code; it helps distinguish the security precisely, especially when company names or symbols can be similar.
Price: one number with several useful reference points
The headline price is the price per share. It tells you what one share is currently trading at, but it does not tell you the size or quality of the business. A share at is not automatically more valuable than one at .
The common price fields describe different moments in a trading session.
| Field | Meaning | What it helps you see |
|---|---|---|
| Previous close | The official closing price from the prior trading day | Reference point for daily price change |
| Open | The first traded price of the current session | How the session began relative to the previous close |
| High | Highest traded price during the session | Upper end of the day’s trading range |
| Low | Lowest traded price during the session | Lower end of the day’s trading range |
| Last price / LTP | Most recent traded price at the time of viewing | The current live market level |
| Close | Exchange-defined closing price for the session | A consistent end-of-day price for return calculations |
| VWAP | Volume-weighted average price | Average trading price weighted by quantities traded |
Reading the Coal India example
The snapshot shows:
- Previous close:
- Displayed price:
- Open:
- High:
- Low:
The displayed increase of is measured against the previous close:
The percentage change is:
That calculation explains the green figure. It does not mean that every investor in Coal India earned : their return depends on the price at which they bought, transaction costs, taxes, and holding period.
Notice that the displayed price of and the field labelled “Close” at differ slightly. This can happen because one value may be a live last-traded price while another is a closing or reference figure calculated under the platform’s convention. Always read the label, date, and market status rather than assuming every “price” on a screen means the same thing.
VWAP: the quantity-weighted average trading price
The volume-weighted average price, or VWAP, answers a different question from the last price: At what average price did shares trade during the period, giving more weight to trades involving more shares?
Coal India’s displayed VWAP is . Since this is above the displayed price, the most recent price in that snapshot was below the session’s quantity-weighted average. That is a factual observation for that session, not a reliable prediction of tomorrow’s price.
For company research, price fields are most useful for calculating returns, comparing a company with a benchmark later in the course, and understanding the context in which a valuation is being discussed.
Volume and turnover: how much trading occurred?
Traded volume is the total number of shares that changed hands during a defined period, commonly one trading day. It measures trading activity, not the number of distinct investors and not the number of shares outstanding.
The Coal India snapshot reports traded volume of 42,38,903 shares. In the Indian numbering format, that is:
A share can be bought and sold more than once in a day. Therefore, volume can exceed the number of shares actually added to or removed from investors’ holdings.
Turnover is the rupee value of trading. It is approximately:
Using the snapshot’s figures:
This is approximately crore, or lakh, matching the displayed traded value.
What volume can—and cannot—tell you
Higher volume often indicates that a share was easier to trade that day than usual. It may occur because of earnings announcements, index rebalancing, block deals, broad market stress, news, or simple short-term speculation.
The useful comparison is generally the company’s own historical volume, not another company’s raw volume. For example, a one-million-share day may be ordinary for a large liquid company but unusually high for a smaller company.
Volume alone cannot tell you:
- whether the dominant activity was buying or selling;
- whether participants were retail investors, mutual funds, foreign institutions, or traders;
- whether a price move was justified by business fundamentals;
- whether the company has become more valuable.
It describes activity, not intent.
Market capitalization: the market value of the company’s equity
Market capitalization, commonly shortened to market cap, estimates the market value of a company’s equity.
Suppose a company has 100 crore shares outstanding and its share price is .
Its market capitalization would be crore.
Market cap changes when the share price changes. It can also change when the number of shares changes through actions such as a new share issue, buyback, conversion of securities, or stock split.
What market cap is not
Market cap is not:
- the company’s annual revenue;
- the cash in its bank account;
- the original amount raised from shareholders;
- the price required to acquire the company, because an acquirer would also need to consider debt and cash.
The distinction between equity value and enterprise value will become important in the valuation modules. For now, use market cap as a quick measure of the market’s value for shareholders’ ownership claims.
A platform may show market cap in rupees, lakhs, crores, or billions. Always check the unit before comparing companies. Confusing crore with lakh creates an error of one hundred times.
Free float: the part of equity considered available to the market
Not every outstanding share is treated as readily available for market trading. Promoters, governments, founders, strategic investors, and certain long-term holders may own shares that are not normally considered part of the active public float.
Free-float shares are the shares regarded as available for trading by public investors under the relevant platform or index methodology.
The Coal India snapshot reports Free Float Market Cap of crore. This is not the same as the company’s total market capitalization. It represents the market value of the portion classified as freely tradable under that data provider’s methodology.
The free-float percentage can be expressed as:
Why free float matters
Free float matters for three related reasons:
-
Index construction
Many Indian market indices use free-float market capitalization when determining company weights. A company with a large total market cap but substantial promoter ownership may receive a lower index weight than its total market cap alone suggests. -
Trading liquidity
A smaller float can mean fewer shares are regularly available for trade. That can sometimes contribute to sharper price moves when demand or supply changes. -
Research context
Free float helps you distinguish a company with broad public ownership from one where a controlling shareholder owns much of the equity.
However, free float is not a direct measure of daily liquidity. Some public shareholders may rarely trade, while a company with a modest float can still have active trading. Read free float together with actual volume, bid-ask spreads, and ownership disclosures when you reach those topics.
Delivery quantity: how much trading resulted in settlement?
A day’s traded volume includes both short-term intraday activity and transactions that result in shares being settled into a buyer’s holdings. Deliverable quantity refers to the number of shares that result in delivery through settlement.
The delivery percentage is calculated as:
Watch this brief explanation of the distinction and calculation.
How to Use Delivery Percentage for Better Trading Decisions?
In “How to Use Delivery Percentage for Better Trading Decisions?” from Trading with Groww, the opening example gives a concise definition of delivery percentage and its formula.
Watch the definition. Focus on the distinction between intraday trading and positions carried beyond the session, then note how the example divides deliverable shares by total volume.
A delivery percentage of means that half of the day’s reported traded quantity resulted in delivery. It does not mean that “50% of investors are bullish,” nor does it reveal the identity of buyers or sellers.
Read an archived NSE data row to see the fields together in an exchange-report format.
All Reports- Equities, Indices, Mutual Fund, Securities Lending & Borrowing, SME - NSE India
NSE India’s report page shows the standard end-of-day fields for an equity security. The SBIN example is historical, so use it to understand the data layout and calculations rather than as current market information.
Find the table headed “Data for SBIN from 28-11-2018 to 27-11-2018.” In its row dated 14-Jan-2019, read the SBIN data row. Follow the columns from previous close through VWAP, total traded quantity, number of trades, deliverable quantity, and delivery percentage. Check that the stated 29.02 percentage is consistent with deliverable quantity divided by total traded quantity.
Worked interpretation of the NSE row
The historical SBIN row reports:
- Total traded quantity: shares
- Deliverable quantity: shares
- Delivery percentage:
Using the Indian commas correctly:
The price fields provide a separate observation. The close was , below the previous close of :
A disciplined one-day summary would be:
SBIN closed about below its previous close. About million shares traded, of which approximately million were deliverable, producing a delivery percentage of .
That summary is factual. It does not claim that a particular institution sold, that the decline will continue, or that the share has become attractive or unattractive.
Use delivery data carefully
Delivery data can be a useful descriptive clue when compared with the company’s own history. For example, a sharp price move accompanied by unusually high volume and an unusually high delivery quantity may warrant further investigation.
But it cannot establish a trading or investment conclusion on its own:
- High delivery can occur while the price rises or falls.
- A delivered share purchased by one holder was sold by another; the data does not identify either party.
- Delivery is not a substitute for analyzing earnings, debt, governance, or valuation.
- Compare like with like: same stock, same exchange scope, same time period, and preferably several prior sessions.
For equity research, delivery data is a market-activity input, not evidence of business performance.
A practical quote-reading routine
When you open a quote for a company you may later analyse, use this sequence:
- Confirm the security and date. Record company name, symbol, exchange, series, and whether data are live or end-of-day.
- Read the price context. Note previous close, open, high, low, last price, close, and percentage change.
- Separate price from value. A share price is the value of one share; market cap incorporates the number of shares outstanding.
- Read activity figures. Identify total traded quantity, VWAP, and turnover. Compare volume with the stock’s own recent history where possible.
- Check free float. Recognize that it reflects the publicly tradable portion of equity under a stated methodology, not the business’s full value.
- Calculate delivery percentage. Divide deliverable quantity by traded quantity, then interpret it only as a settlement-related activity measure.
- Write an observation, not a verdict. Record what happened in the data before asking why it happened.
This routine is particularly useful for an entry-level analyst. It establishes clean factual notes and prevents a common mistake: treating a noisy trading-day statistic as if it were evidence about a company’s long-term prospects.
Key takeaways and next step
A share quote combines different kinds of information:
- Price fields describe where a share traded during a session and how it changed relative to the previous close.
- Volume is the number of shares traded; turnover is their rupee value.
- Market capitalization is share price multiplied by total shares outstanding, representing the market value of equity.
- Free-float market capitalization values only the shares considered available for public trading under the relevant methodology.
- Deliverable quantity is the portion of traded shares that resulted in delivery through settlement, while delivery percentage expresses that quantity relative to total volume.
The essential discipline is to keep these categories separate: price movement, trading activity, ownership structure, and business fundamentals are connected, but they are not the same thing.
Next, you will move beyond quote screens and learn how to locate the primary evidence behind company analysis: annual reports, exchange filings, shareholding patterns, and corporate announcements.
Can't find a good explanation? Sign up and we'll make it for you
Sign up