
Hello! Welcome to the first lesson in our module on Customer Value and Segmentation Strategy.
In the last module, we focused on attributing value to the customer journey—the series of touchpoints leading to a conversion. Now, we're making a crucial pivot from valuing the path to valuing the person. This shift from short-term events to long-term relationships is central to strategic marketing leadership.
Your learning outcome for today is to interpret cohort retention curves and LTV calculations to assess business health. We will explore how these two powerful analytical tools move beyond vanity metrics to reveal the true sustainability and profitability of your business model. Mastering this will allow you to diagnose problems, identify opportunities, and make compelling, data-backed arguments for strategic shifts in product, marketing, and customer experience.
1. The Foundation: Understanding Cohort Retention
At its core, marketing is about acquiring and retaining valuable customers. But how do you know if you're actually succeeding? A simple "monthly active users" number can be dangerously misleading. It might be growing, but are you just filling a leaky bucket as fast as it empties?
Cohort analysis solves this by grouping users based on a shared characteristic—most commonly, the month they were acquired—and tracking their behavior over time. This allows you to see if the customers you acquire today are still with you tomorrow.
To get a solid grasp of this foundational concept, let's watch a segment from a presentation by a Y Combinator partner. It explains why cohort analysis is so critical and how to set one up conceptually.
How To Keep Your Users | Startup School
This video from Y Combinator, a leading startup accelerator, makes a compelling case for why cohort retention is the best way to quantitatively measure if you've built something people want. It clearly explains the core principles.
Watch the first part of the video (from 00:00 to 06:46). As you watch, think about these from a leader's perspective: The Cohort Definition: What group of users are we tracking (e.g., by acquisition month, by first campaign)? The Critical Action: What action signifies 'active use' (e.g., app open, purchase, specific feature usage)? The Time Period: What is the natural frequency of use for our product (daily, weekly, monthly)? Your team would execute the analysis, but you would guide the strategic definitions of these three variables.
2. Interpreting the Retention Curve: The Shape of Your Business
Once your team has the data, they will present it to you, typically in one of two ways: a table of percentages (often called a "triangle chart") or, more intuitively, a line graph showing retention curves. Your job is to interpret this graph to diagnose the health of your customer relationships.
Let's continue with the YC video to see how these charts are built and, more importantly, what to look for.
How To Keep Your Users | Startup School
Now that you understand how cohorts are defined, let's focus on interpreting the output. This next segment reveals the single most important insight you can gain from a retention curve.
Continue watching from 06:46 to 13:59. Pay close attention to: The transition from the data table to the line graph. The crucial insight: The shape of the curve matters more than the absolute numbers. The key signal of a healthy, sustainable product is whether the curve flattens out.
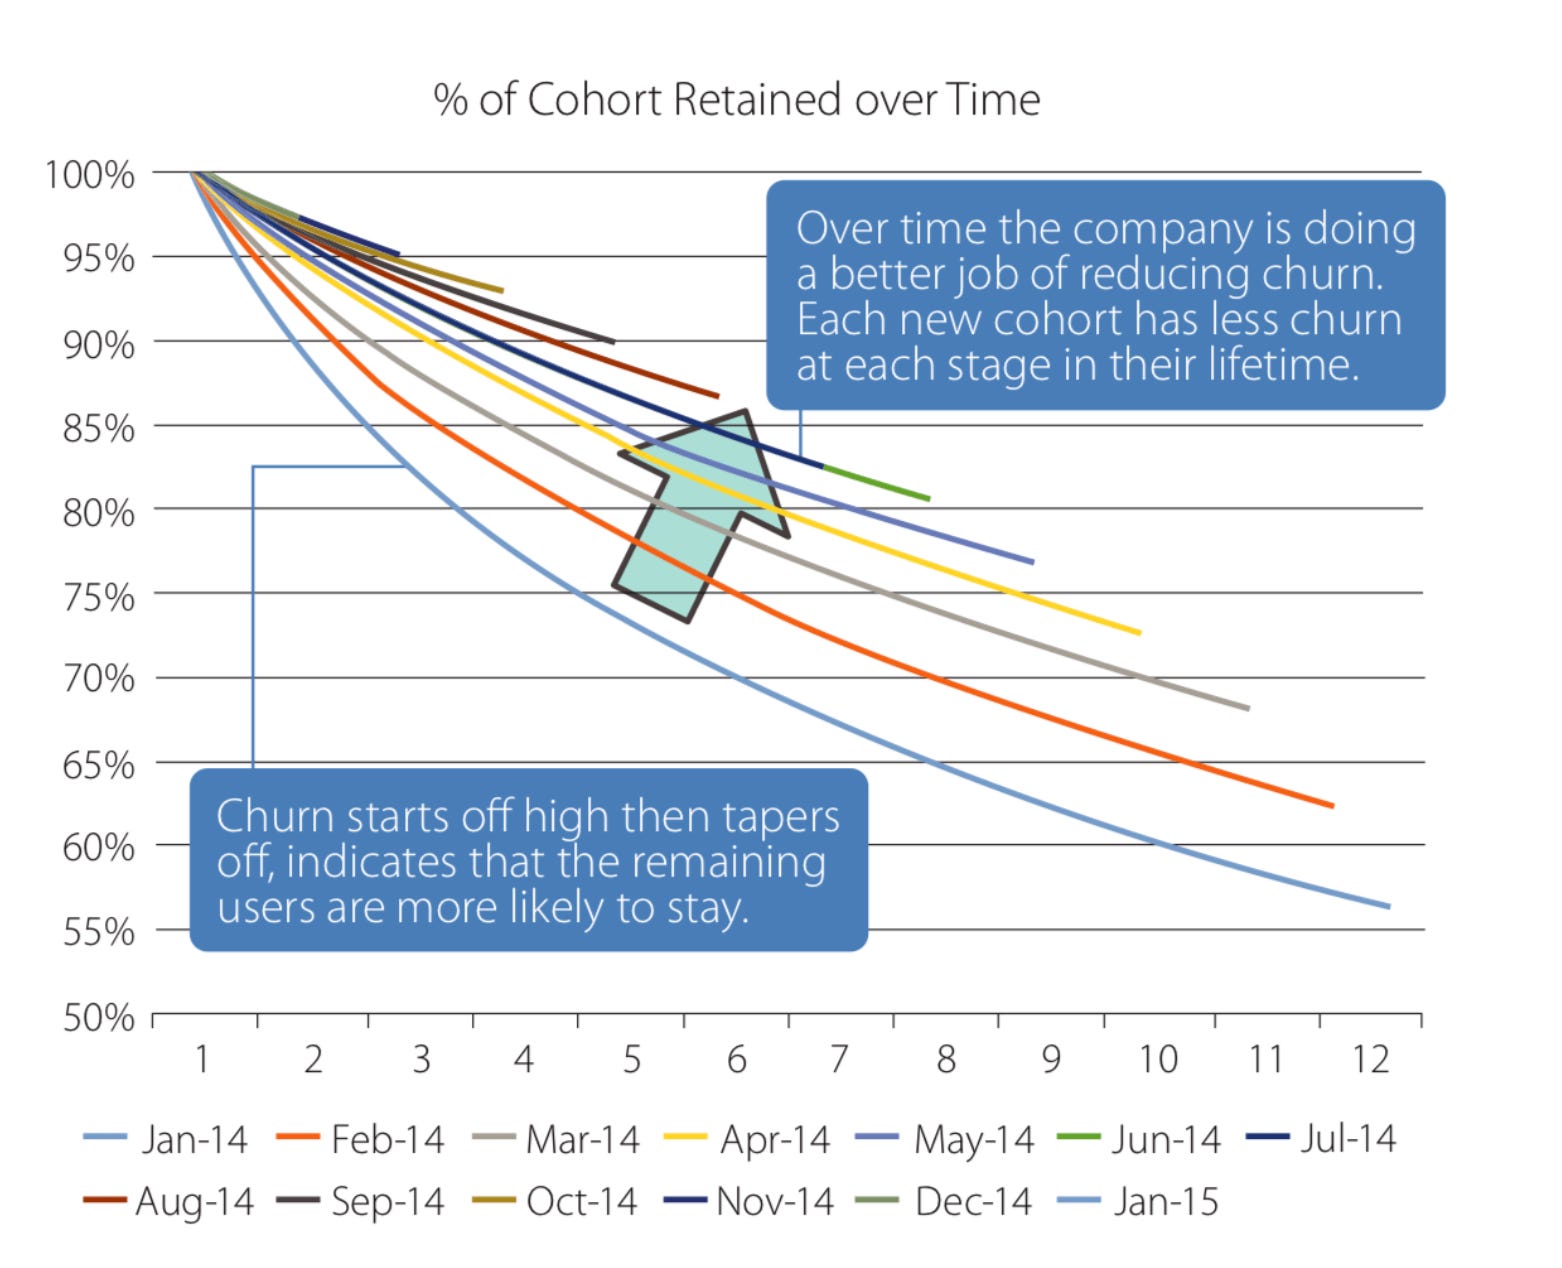
A flattening curve signals that you have found product-market fit with a core group of customers who derive long-term value from your product. This is the foundation of a sustainable business.
Here are the common shapes you'll encounter:

When you overlay the curves from different cohorts (e.g., January vs. June), you can assess the impact of your team's efforts over time.
To solidify this, here is a concise written summary.
Cohort Analysis Dashboards for SaaS Founders: Measure Retention, NRR, and LTV
This article from a guide for SaaS founders reinforces the key takeaway about interpreting retention curves.
Read the short subsection titled '1. The User Retention Curve' under 'Section 2: The Three Core Views for Your First Dashboard'. Notice how it directly links a flattening curve to 'a powerful sign of product-market fit'.
Test your understanding!
You are presented with a cohort retention chart showing that the retention curve for customers acquired in Q4 is significantly lower and steeper (less flat) than the curves for Q1 and Q2.
What are two different business hypotheses you could form to explain this negative trend? What data would you ask your team to pull to investigate each hypothesis?
Show answer
Here are two plausible hypotheses:
-
Hypothesis 1 (Marketing-related): "Our aggressive Q4 holiday marketing campaign attracted a high volume of low-intent, discount-seeking customers who were never a good fit for the product and churned quickly after their initial purchase."
- Data to request: Ask your team to segment the Q4 cohort by acquisition channel or campaign. Is the poor retention driven primarily by users from a specific campaign (e.g., a "50% off first month" social media ad)? Compare the LTV of these users to those from other channels.
-
Hypothesis 2 (Product-related): "We launched a major redesign of the user onboarding flow at the end of Q3. We hypothesize that the new flow is confusing or failing to demonstrate the product's core value, causing new users to abandon the product."
- Data to request: Ask for a funnel analysis of the new onboarding flow for the Q4 cohort. Where are users dropping off? Also, compare feature adoption rates between the Q4 cohort and earlier, more successful cohorts. Are new users failing to engage with the key features that drive long-term value?
3. From Users to Profit: Calculating and Interpreting LTV
Strong user retention is the engine, but revenue is the fuel. As a leader, you must connect the two. This is where Customer Lifetime Value (LTV) comes in. LTV, in its simplest historical form, is the total profit a customer has generated for your business to date.
By calculating LTV at the cohort level, you can understand the true financial value of the customers you acquire.
Customer Retention & Cohort Analysis | How VCs Calculate Customer Retention
Let's now connect user retention to financial health. This video gives a clear, step-by-step walkthrough of how cohort data is used to calculate Customer Lifetime Value (LTV).
Watch from 07:29 to 14:58. You don't need to memorize the spreadsheet formulas. Instead, focus on understanding the logical flow: Start with Net Revenue by Cohort (which can grow even if user count shrinks—a great sign!). Sum this over time to get Cumulative Lifetime Revenue per cohort. Finally, divide by the initial number of customers and apply a gross margin to find the Customer Lifetime Value (LTV).
An LTV number on its own is not enough. Its strategic power is unleashed when you compare it to your Customer Acquisition Cost (CAC)—what you spent to acquire that customer in the first place.
Customer Retention & Cohort Analysis | How VCs Calculate Customer Retention
This final clip shows the most critical business application of LTV: determining profitability. It demonstrates how the LTV to CAC ratio answers the fundamental question: 'Are my marketing investments paying off?'
Watch from 14:58 to 17:11. Absorb the narrative: you might lose money on a customer initially (CAC > initial profit), but strong retention drives LTV up over time, leading to a highly profitable relationship. This is the core justification for sustained marketing investment.
The LTV:CAC ratio is one of the most important metrics for assessing business health. It tells you whether your growth engine is profitable. A healthy ratio (often cited as 3:1 or higher) means that for every dollar you invest in acquiring a customer, you generate three dollars or more in profit over their lifetime. This ratio directly answers strategic questions like:
- How much can we afford to spend on Google Ads or Meta Ads to acquire a new customer?
- Which channels are not just cheap, but bring in the most profitable customers long-term?
- How long does it take to earn back our marketing spend on a new customer (the "payback period")?
4. From Interpretation to Action
Interpreting these charts is only the first step. The real value is turning insights into action.
Cohort Analysis Dashboards for SaaS Founders: Measure Retention, NRR, and LTV
This article provides a simple but powerful framework for translating a dashboard observation into a concrete business action. This is the loop you would guide your team through.
Read 'Section 3: From Dashboard to Decision'. Internalize the 'Observe, Hypothesize, Act, Measure' loop. This structured approach turns your dashboard from a passive reporting tool into an active driver of business strategy.
As a leader, your role is to look at a retention curve and say, "I see our Q4 cohort is underperforming. My hypothesis is that our new ad campaign is attracting the wrong audience. Let's act by pausing that campaign and measure if the retention of our next cohort improves."
Conclusion
In this lesson, we moved from short-term metrics to a long-term view of business health. You learned to interpret the two most important canvases for this view: cohort retention curves and LTV calculations.
Key Takeaways:
- Cohort retention curves diagnose the health of your product and its fit with your customers. The key is to look for the flattening of the curve, which signals a sustainable, retained user base.
- LTV calculations, derived from cohort revenue data, diagnose the health of your business model. When compared to CAC, the LTV:CAC ratio determines the long-term profitability of your customer acquisition strategy.
- As a leader, your job is to synthesize these views. A flat retention curve with a poor LTV:CAC ratio means you have a great product but a broken business model. A high LTV that hides a leaky bucket is equally dangerous.
- Use the Observe, Hypothesize, Act, Measure framework to translate your interpretations into decisive, data-informed actions.
Preview of the Next Lesson:
Today, we focused on calculating LTV based on what customers have done in the past (historical LTV). This is essential for evaluating performance. However, to make forward-looking decisions—like deciding how much to bid for a brand new customer—we need to predict their future value. In our next lesson, we'll explore the strategic difference between historical LTV and predictive LTV (pLTV).