
Hello! Welcome to your sixth lesson in the "Statistical Foundations for Marketing Leaders" module.
In our last lesson, we delved into linear regression and saw how to interpret coefficients and R-squared to understand marketing drivers. We ended on a critical point: we decided not to act on a marketing channel's apparent effect because its p-value was too high, meaning the result was not statistically significant.
Today, we will explore the "why" behind that decision. This lesson is dedicated to explaining the risks of making business decisions based on statistically insignificant data. For a leader, understanding these risks is fundamental to fostering a data-driven culture that avoids costly mistakes, protects your team's credibility, and ensures that resources are invested in initiatives with a real, measurable impact.
By the end of this lesson, you will be able to explain the key risks associated with acting on insignificant results and guide your team to make more robust, evidence-based decisions.
1. The Primary Risk: Chasing Ghosts with False Positives
The most significant risk of acting on statistically insignificant data is making a false positive error. In statistics, this is known as a Type I error.
A false positive occurs when you conclude that there is a real effect (e.g., a new ad creative is better than the old one) when, in reality, the difference you observed was just due to random chance or statistical noise.
Imagine your team tests a new email subject line. The new version gets a 1% higher open rate, and the A/B testing tool reports a p-value of 0.20. While a 1% lift might seem appealing, the high p-value indicates there's a 20% chance you'd see a lift of this size or greater even if the new subject line was no better than the original. Acting on this result means you have a 1 in 5 chance of being wrong. You would be "chasing a ghost."
The following image provides a standard framework for thinking about these types of errors.
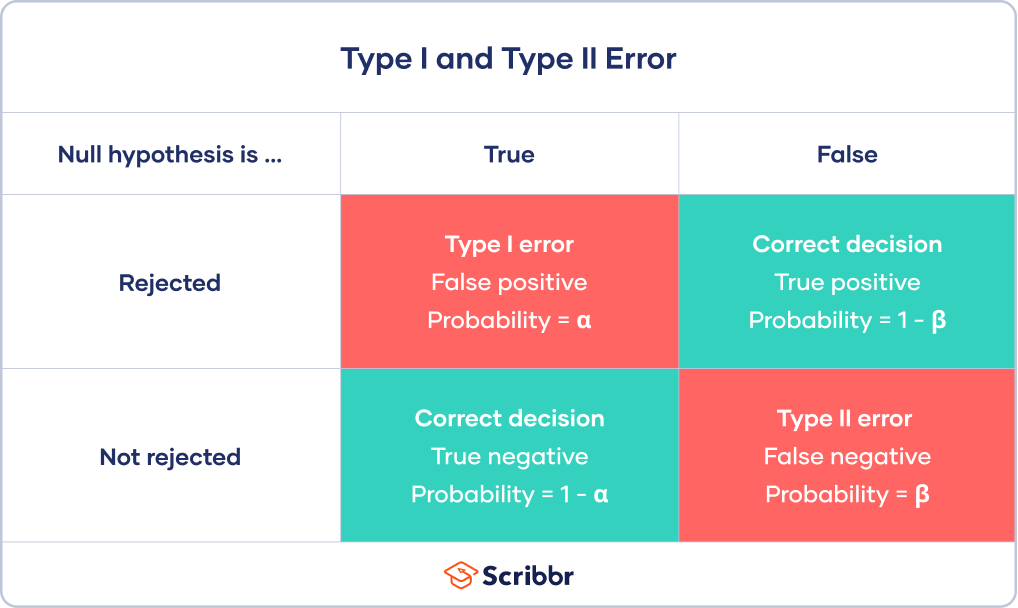
To solidify this concept, let's turn to a clear definition.
Ten common A/B testing pitfalls and how to avoid them
The article 'Ten common A/B testing pitfalls and how to avoid them' from Adobe provides an excellent, concise explanation of Type I errors and their relationship to the significance and confidence levels you learned about in a previous lesson.
Please read the first section, 'Pitfall 1: Ignoring the effects of the significance level.' Focus on understanding the definition of a false positive (Type I error) and how it directly relates to the confidence level you choose for a test (e.g., a 95% confidence level accepts a 5% chance of a false positive).
The business risk here is one of wasted effort and opportunity cost. If you roll out a new "winning" campaign that was actually a false positive, your team spends time and resources implementing a change that delivers no real value. Worse, it might unknowingly displace a campaign that was performing just as well or better.
2. How Marketing Teams Accidentally Inflate Their Risk
A 5% risk of a false positive might seem acceptable. However, certain common practices in marketing can dramatically increase this risk without the team even realizing it. As a leader, it's crucial to be able to spot and correct these behaviors.
Pitfall #1: "Peeking" and Stopping Tests Too Early
One of the most common mistakes is continuously monitoring a test and stopping it as soon as it hits statistical significance. This is often called "peeking."
Imagine you launch an A/B test. After one day, Variant B shows a 20% lift with a p-value of 0.04. The team gets excited and wants to roll it out immediately to capitalize on the gains. The risk is that this early result is often an outlier based on a small sample size. As more data comes in, this impressive lift is likely to shrink—a phenomenon known as regression to the mean.
The following resources explain this pitfall and its consequences clearly.
A/B Test Like a Pro #3: Understanding Experiment Results
First, let's watch a practical example from the Firebase channel. The video 'A/B Test Like a Pro #3: Understanding Experiment Results' explains why you need to let tests run their course.
Please watch from 0:42 to 2:07. The video discusses the 'novelty effect' and the need to wait for results to level off, giving a practical rule of thumb of about two weeks to account for weekly variations in user behavior.
Ten common A/B testing pitfalls and how to avoid them
The Adobe article we looked at earlier formalizes this concept. It explains exactly why monitoring tests and stopping them prematurely invalidates the statistical guarantees.
Now, please read the sections 'Pitfall 5: Monitoring tests' and 'Pitfall 6: Stopping tests prematurely.' Focus on the example that shows how the false positive rate can jump from 5% to 16% just by peeking at the results.
By stopping the test the moment it looks good, you don't allow it the chance to regress back to its true, likely more modest, value. You essentially rig the game in favor of finding a positive result, dramatically increasing your risk of a false positive.
Pitfall #2: The "Shotgun Approach" and P-Hacking
Another common pitfall is running a large number of comparisons at once and then cherry-picking the one that happens to look significant. This is often called p-hacking.
This can happen in two ways:
- Multiple Variants: Testing 20 different headlines at once for a landing page.
- Post-Test Segmentation: Running a simple A/B test, finding no overall winner, and then slicing the data by 20 different segments (geography, device, new vs. returning) until you find a "pocket of success."
If you run enough tests, you are guaranteed to find a false positive. Remember, a 95% confidence level means there's a 1 in 20 chance of a fluke. If you run 20 comparisons, you should expect to find one "significant" result by pure luck.
p-hacking: What it is and how to avoid it!
The StatQuest channel provides one of the clearest explanations of p-hacking and why it's so dangerous. This video will give you a strong intuition for the problem.
Please watch from the beginning to 7:23, and then from 8:39 to 11:10. Focus on the two main forms of p-hacking discussed: testing many options and cherry-picking the winner, and sequentially adding more data until you cross the significance threshold.
As a leader, if a team member brings you a surprising result found after slicing the data many different ways, your first question should be, "Was this hypothesis planned before the test, or discovered after?" If it was discovered after, the finding should be treated as a new hypothesis to be validated with a fresh experiment, not as a confirmed result.
Test your understanding!
Your social media team runs an A/B test on a new ad creative on Meta. After a full week, the overall results are not statistically significant (p = 0.35). A junior analyst, eager to find a win, digs into the data. They segment the results by age, gender, device, and 10 largest US states. They discover that for "males aged 25-34 in California on iOS devices," the new creative has a p-value of 0.04 and a 15% lift. They recommend immediately shifting budget to target this specific segment.
What are the risks of following this recommendation? What questions should you ask your team?
Show answer
The primary risk here is p-hacking through post-test segmentation. By running dozens of comparisons, the analyst was highly likely to find a "significant" result just by random chance. Acting on this could mean wasting budget on a highly specific segment where there is no real lift.
As a leader, you should ask:
- Was this segment a pre-defined hypothesis? Did we believe before the test that this specific group would respond differently? (The answer is likely no).
- How many different segments did you look at to find this one? This helps you gauge the likelihood that this is a false positive due to multiple comparisons.
- Does this result make business sense? Is there a strong, logical reason why this very specific niche would prefer the new creative while no one else did?
Your guidance should be: "This is an interesting finding, but we can't treat it as a conclusive result. Let's frame this as a new hypothesis. If we believe this segment is important, we should design a new, targeted experiment to validate whether this lift is real."
3. Beyond Yes/No: A Strategic Approach to Uncertainty
So far, we've focused on the dangers of acting on insignificant data. But that doesn't mean insignificant results are useless. A strategic leader knows how to extract value even from a "failed" test. The key is to shift your mindset from a simple "significant/insignificant" binary to understanding the range of plausible outcomes.
When a test result is insignificant, it's not telling you "there is no effect." It's telling you "I am not confident enough to distinguish a potential real effect from random noise." The confidence interval is your best tool here.
A wide confidence interval (e.g., a lift between -10% and +15%) is a sign of high uncertainty. A narrow one (e.g., -1% to +2%) tells you that any effect, if one exists, is likely very small.
What to Do When Your Marketing Experiment Isn’t Statistically ...
The article 'What to Do When Your Marketing Experiment Isn’t Statistically Significant' from Recast offers a fantastic strategic perspective on this. It argues that the goal isn't just to get a p-value below 0.05, but to reduce uncertainty.
Please read the sections 'How to interpret noisy or inconclusive test results' and 'The Problem with Midpoint ROI Estimates.' Focus on the examples of how an insignificant result can still be useful for decision-making (e.g., by ruling out an extremely high CPA or ROI).
Let's revisit the Firebase video for a visual of this concept.
A/B Test Like a Pro #3: Understanding Experiment Results
The Firebase video explains this perfectly with its 'range of improvement' graphic, which is another name for a confidence interval.
Watch from 4:42 to 7:58. Pay close attention to the explanation of why the result is a range and not a single number. The presenter's point about a range of +4% to +6% versus -25% to +35% perfectly illustrates how the width of the interval signals confidence.
As a leader, this is your key takeaway:
- Don't just ask: "Is it significant?"
- Instead, ask: "What's the confidence interval? What range of outcomes is the data compatible with?"
An insignificant result with a confidence interval for ROI of [-0.5x, 2.0x] is incredibly useful. It tells you that even in the best-case scenario, this channel is unlikely to hit your company's 3x ROI target. You can confidently decide to deprioritize it without needing statistical significance.
Conclusion
Mastering the risks of statistical insignificance is less about memorizing statistical rules and more about cultivating a disciplined, critical mindset. It's about resisting the temptation of a quick, exciting win in favor of a more robust, long-term understanding of what truly drives your business.
Key Takeaways:
- Making business decisions on statistically insignificant data exposes you to the risk of false positives (Type I errors)—acting on random noise as if it were a real effect.
- The business costs are wasted resources, opportunity costs, and a loss of credibility when the "lift" fails to materialize.
- Common marketing behaviors like peeking at results and p-hacking (through multiple variants or segmentation) dramatically inflate the risk of false positives.
- Insignificant results are not useless. Shift from a binary "yes/no" to using confidence intervals to understand the range of plausible outcomes and strategically reduce uncertainty.
Preview of the Next Lesson:
In this lesson, we focused on the danger of mistaking statistical noise for a real pattern. In our next lesson, we will address a related but distinct challenge: "Apply the concept of correlation vs. causation to common marketing scenarios." You'll learn why even a statistically significant relationship doesn't automatically prove that one thing causes another—a critical distinction for every marketing strategist.