
Hello! Welcome to your fifth lesson in the "Statistical Foundations for Marketing Leaders" module.
In our last lesson, we explored the crucial difference between statistical significance (is a result real?) and business significance (does the result matter?). This distinction is vital for making sound decisions on A/B tests.
Today, we'll expand our analytical toolkit beyond comparing one variant against another. We'll dive into one of the most powerful and widely used methods in marketing analytics: linear regression. This technique helps us understand the relationships between a key business outcome (like sales) and the various marketing activities that might be driving it.
Your learning outcome for this lesson is to interpret the key outputs of a linear regression model (coefficients, R-squared) to understand marketing drivers. By the end of this lesson, you'll be able to look at a standard regression output and confidently answer questions like, "Which of my marketing channels is providing the most bang for the buck?" and "How well do our current activities explain our performance?"
1. What is Linear Regression? A Model for Understanding Relationships
At its core, linear regression is a statistical method for modeling the relationship between variables. In a marketing context, you can think of it as a way to build a formula that explains how your marketing inputs relate to your desired outcomes.
Given your background in computer science, you can think of linear regression as a classic and foundational machine learning algorithm. It aims to find the "best-fit" line through a series of data points that represent the relationship between:
- A Dependent Variable (Y): The main outcome you want to predict or explain. For a marketer, this is often
Sales,Revenue,Conversions, orSign-ups. - One or more Independent Variables (X): The factors you believe influence your dependent variable. These are your marketing levers, such as
Ad Spend,Website Traffic,Number of Emails Sent, orDiscount Levels.
Linear Regression: The Classic Machine Learning Algorithm ...
To get a solid conceptual grounding, let's read a brief introduction from the article 'Linear Regression: The Classic Machine Learning Algorithm You Need to Know.' It clearly defines the key terms and visualizes the concept.
Please read the sections 'What is Linear Regression?' and 'Linear Regression Visualized'. Focus on understanding the roles of the dependent and independent variables, and the visual representation of the regression line.
When we use only one independent variable, it's called simple linear regression. When we use multiple independent variables (which is almost always the case in real-world marketing), it's called multiple linear regression. The logic is the same, but multiple regression allows us to model a more realistic scenario where several activities happen at once.
2. Interpreting the Key Outputs of a Regression Model
When your analytics team runs a regression analysis, they will present you with a summary table of results. It might look intimidating at first, but for your strategic purposes, you only need to focus on a few key numbers. We'll break them down one by one: coefficients and R-squared.
A. The Coefficients: Quantifying the Impact of Each Driver
The coefficient is a number that tells you the strength and direction of the relationship between an independent variable and the dependent variable.
For each independent variable in your model (e.g., Google Ads spend, Meta Ads spend), you will get a coefficient. Here’s how to interpret it:
A coefficient's value represents the predicted change in the dependent variable (Y) for a one-unit increase in the independent variable (X), holding all other variables in the model constant.
This "holding all other variables constant" part is what makes regression so powerful for a strategist. It allows you to isolate the impact of a single channel.
Let's look at an example from the world of Marketing Mix Modeling (MMM), which heavily relies on multiple regression.
Multiple regression (MMM analysis) explained for marketers
The article 'Multiple regression explained for marketers' provides an excellent explanation of coefficients in a practical marketing context.
Please read the section 'How multiple regression is used in marketing mix modeling (MMM)' and then jump to 'A sample multiple regression formula'. Focus on how the article explains the meaning of a regression coefficient (β) for a marketing channel.
Practical Interpretation:
- Sign (Positive or Negative): If the coefficient for
Meta Ad Spendis positive, it means more spend is associated with more sales. If it were negative (unlikely for spend, but possible for other variables likePrice), it would mean more spend is associated with fewer sales. - Magnitude: If the coefficient is
3.5, it means that for every additional$1you spend on Meta Ads, the model predicts a$3.50increase in revenue, assuming your other activities (like Google Ads spend) remain unchanged.
Don't Forget the p-value!
Just as in A/B testing, each coefficient has a p-value. This tells you if the relationship found is statistically significant. Before you get excited about a large coefficient, check its p-value. If the p-value is high (e.g., > 0.05), the model is telling you that it's not confident this relationship is real—it could just be random noise. As a leader, you should only base decisions on drivers with statistically significant coefficients.
B. R-squared (R²): How Well Does the Model Explain Performance?
While coefficients tell you about the impact of individual drivers, R-squared tells you about the explanatory power of your model as a whole.
R-squared is a value between 0 and 1 (or 0% and 100%) that represents the proportion of the variance in the dependent variable that can be explained by the independent variables in the model.
In simpler terms, it answers the question: "How much of the change in our sales is explained by the marketing activities we've included in our model?"
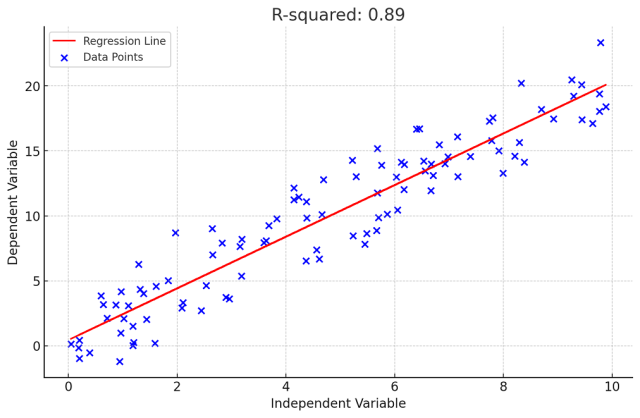
A high R-squared is generally desirable, but "good" depends on the context.
- An R-squared of 0.85 means that 85% of the weekly fluctuations in your revenue can be explained by your model's inputs (e.g., your ad spend, email campaigns, and seasonality). The remaining 15% is due to factors not in your model (e.g., competitor actions, PR mentions, economic climate).
- An R-squared of 0.20 means your model only explains 20% of the variation. This suggests you are missing some key drivers in your model.
To build a strong intuition for R-squared, the following video is one of the best explanations available.
R-squared, Clearly Explained!!!
The channel StatQuest is famous for making complex topics intuitive. This video, 'R-squared, Clearly Explained!!!', does exactly that. It will give you a lasting mental model for what R-squared really means.
Please watch from 1:30 to 7:54. The video walks through the calculation conceptually, showing how R-squared measures the improvement of the regression line over just using the average. Focus on the core idea: R-squared is the percentage of variation explained by the model.
3. Putting It All Together: How to Read a Regression Output Table
Now let's combine these concepts and learn how to read a typical regression output. The video below provides a fantastic walkthrough of a standard results table, highlighting the key questions a leader should ask.
Interpreting Linear Regression Results
In 'Interpreting Linear Regression Results,' Dr. Sergio Garcia provides a clear, step-by-step guide to reading a regression output. He frames it around four critical questions, which is a perfect mental model for a strategic leader.
Watch from 3:50 to 6:00 (for R-squared), then from 6:30 to 10:29 (for overall model significance), and finally from 10:29 to the end (for interpreting coefficients and summarizing). Focus on the four questions he outlines for interpreting the results.
Based on the video, here is the strategic framework for reading a regression output:
- Check R-squared: How much of our outcome does this model explain? (Is it a high enough percentage to be useful?)
- Check the Model's Overall Significance (F-statistic p-value): Is the model as a whole statistically significant? (Is it better than random guessing? A p-value < 0.05 is a good sign).
- Examine the Coefficients: For each marketing driver:
- What is the relationship (positive or negative)?
- How large is the effect (the coefficient's value)?
- Is this driver statistically significant (p-value < 0.05)?
- Apply Business Sense: Do these results make sense? This final check is crucial. If the model says that reducing ad spend increases sales, you should be highly skeptical and question the model's assumptions or data quality.
Let's look at a concrete example using data from a Meta ad campaign.
Linear Regression: The Classic Machine Learning Algorithm ...
Now let's apply this framework to a real-world marketing example. The article 'Linear Regression: The Classic Machine Learning Algorithm...' analyzes a Meta ad campaign and shows the regression output in both R and Python.
Please read the section 'Step 2 — Perform Linear Regression'. You'll see two regression summary tables (one from R, one from Python—they show the same information). Read the author's interpretation of the intercept, slope (coefficient), and R-squared. Notice how they connect the numbers back to the marketing context of impressions and clicks.
Test your understanding!
Your analytics team presents you with the following (simplified) regression output. The model's goal is to explain Weekly Sales ($) based on spend in two channels: Google Ads Spend ($) and Meta Ads Spend ($).
Regression Statistics
- R-squared: 0.78
Coefficients Table
| Variable | Coefficient | p-value |
|---|---|---|
| (Intercept) | 5,000 | 0.03 |
| Google Ads Spend | 4.2 | 0.001 |
| Meta Ads Spend | 1.5 | 0.25 |
Based on this output, answer the following questions:
- How would you interpret the coefficient for Google Ads Spend?
- Your team lead for social media argues that Meta Ads are contributing to sales. What is your response, based on this model?
- A senior executive asks you, "How well do our paid channels explain our sales?" How would you answer?
- If you were given an extra $10,000 for marketing next week, where would you recommend investing it and why?
Show answer
-
Interpretation of Google Ads Coefficient: For every additional $1 spent on Google Ads, the model predicts a $4.20 increase in weekly sales, holding Meta Ads spend constant. This relationship is highly statistically significant (p-value is 0.001), so we can be confident it's a real effect.
-
Response Regarding Meta Ads: While the model shows a positive relationship (a coefficient of 1.5), the p-value is 0.25, which is much higher than the standard 0.05 threshold for statistical significance. Therefore, based on this model, we cannot confidently say that Meta Ads spend has a real, measurable impact on sales. The observed effect could be due to random chance. We should not make budget decisions based on this driver until we have more evidence.
-
Answering the Executive: The R-squared value is 0.78, or 78%. You would say: "Based on our analysis, spend on Google and Meta Ads explains about 78% of the weekly fluctuations in our sales. This indicates that our paid channels are major drivers of performance, though other factors account for the remaining 22%."
-
Budget Allocation Recommendation: You should recommend investing the extra $10,000 in Google Ads. The model shows that Google Ads have a strong, statistically significant positive return (4.2x), whereas the impact of Meta Ads is not statistically significant. Therefore, investing in Google is the most data-driven decision to maximize sales.
Conclusion
You are now equipped to interpret one of the most common and powerful analytical tools in a marketer's arsenal. By focusing on coefficients and R-squared, you can cut through the complexity and extract the strategic insights needed to guide your team.
Key Takeaways:
- Linear Regression models the relationship between marketing inputs (independent variables) and a business outcome (dependent variable).
- Coefficients quantify the impact of each individual marketing driver. Always check the coefficient's p-value to ensure the driver's effect is statistically significant.
- R-squared (R²) tells you how much of your business outcome is explained by your model as a whole. It measures the model's overall explanatory power.
- As a leader, your job is to use these outputs to identify which levers are working, which are not, and to make informed, data-driven decisions about strategy and budget allocation.
Preview of the Next Lesson:
In today's mini-exercise, we decided not to invest in Meta Ads because the coefficient was not statistically significant. This is a critical discipline. In our next lesson, we will focus specifically on this challenge by exploring the topic: "Explain the risks of making business decisions based on statistically insignificant data." You'll learn why acting on exciting but unproven "trends" in your data can be a costly mistake and how to communicate these risks to stakeholders.