
Hello again. In the previous lesson, you created a safe workspace and learned to manage files deliberately with mkdir, cp, mv, rm, and wildcards. Those skills let you organize artifacts; this lesson makes the contents of those artifacts useful.
Infrastructure work produces more text than anyone can read manually: service logs, process listings, configuration output, test results, and diagnostics. You will learn to direct that text into files, connect commands into pipelines, search it with grep, arrange it with sort, and inspect recent or live log activity with tail.
Treat command output as a stream of data
When you run a command, it usually prints a result in the terminal:
ls
That visible result is called standard output, or STDOUT. Programs also receive input and report problems through conventional streams:
| Stream | Purpose | Default destination/source |
|---|---|---|
STDIN | Input given to a program | Keyboard |
STDOUT | Normal results from a program | Terminal |
STDERR | Error messages and diagnostics | Terminal |
The shell gives you two complementary ways to reroute these streams:
- Redirection connects a command to a file.
- Pipes connect one command’s output to another command’s input.
The distinction matters operationally:
command > report.txt
saves a result for later, while:
command-a | command-b
passes a result immediately to another tool without first creating an intermediate file.
Watch the following short demonstration before practicing. It establishes the visual mechanics of pipes, grep, overwrite redirection, append redirection, and combining them.
Linux Terminal Commands: Pipes and Redirection
Watch “Linux Terminal Commands: Pipes and Redirection” from Gary Explains. It shows the shell’s data-flow model with concrete terminal examples.
Start with pipes, where command output is passed to less. Continue with grep filtering to see a multi-command pipeline. Then watch overwrite redirection, followed by append and combine. Focus on what changes: the command’s data destination, not the command’s underlying result.
For a concise reference on pipelines and common filters, read these two sections.
Learning the shell - Lesson 7: I/O Redirection
Read LinuxCommand.org’s “Learning the shell - Lesson 7: I/O Redirection.” These sections explain why pipelines are useful and identify the roles of filters such as sort, grep, and tail.
Read the complete “Pipelines” and “Filters” sections. In “Pipelines,” begin with the pipeline examples; notice that each command has one focused responsibility. Then read the full filter table, from the filter descriptions, paying particular attention to sort, grep, and tail.
Build a harmless log-analysis workspace
Avoid experimenting with system logs such as /var/log/... for now. Some require elevated permissions, vary between Linux distributions, and may contain information you should not casually copy or share. Instead, create a small synthetic application log in the sandbox from the prior lesson.
mkdir -p ~/ai-infra-lab/log-analysis
cd ~/ai-infra-lab/log-analysis
pwd
Create a sample inference-service log. Copy the whole block exactly. The trailing backslashes mean that the command continues onto the next displayed line.
printf '%s\n' \
'2025-03-08T10:00:01Z INFO request_id=req-101 route=/health status=200 latency_ms=2' \
'2025-03-08T10:00:04Z INFO request_id=req-102 route=/predict status=200 latency_ms=41 model=sentiment-v1' \
'2025-03-08T10:00:06Z WARN request_id=req-103 route=/predict status=429 latency_ms=1 message=rate_limited' \
'2025-03-08T10:00:11Z ERROR request_id=req-104 route=/predict status=500 latency_ms=815 message=model_timeout' \
'2025-03-08T10:00:15Z INFO request_id=req-105 route=/predict status=200 latency_ms=39 model=sentiment-v1' \
'2025-03-08T10:00:19Z ERROR request_id=req-106 route=/predict status=503 latency_ms=3 message=upstream_unavailable' \
'2025-03-08T10:00:23Z INFO request_id=req-107 route=/metrics status=200 latency_ms=5' \
> api.log
printf '%s\n' prints each quoted item on its own line. The final > api.log redirects all normal output into a new file named api.log.
Inspect it:
cat api.log
The structure is deliberately similar to production application logging: a timestamp, severity level, request identifier, route, HTTP-style status, latency, and possibly a message. In a later production observability module, you will design structured logs more systematically; today, the goal is to extract useful evidence from text.
Save, append, and separate command results
Overwrite with >
The > operator sends standard output to a file:
grep -nF 'ERROR' api.log > errors-report.txt
Break this down:
grepsearches lines.-nincludes matching line numbers.-FtreatsERRORas literal text rather than as a regular-expression pattern.api.logis the file being searched.>writes the matching output toerrors-report.txt.
View the report:
cat errors-report.txt
The key safety rule is:
>creates the destination if needed, but overwrites it if it already exists.
So this is appropriate when generating a fresh report, but dangerous if the destination is an important file. You are safe here because this is a dedicated lab and errors-report.txt is explicitly a disposable generated artifact.
Append with >>
Use >> when you intend to preserve existing contents and add new output at the end.
grep -cF 'ERROR' api.log > incident-summary.txt
printf '%s\n' 'source=api.log' >> incident-summary.txt
cat incident-summary.txt
The first command creates a summary file containing the number of log lines with ERROR. The second command appends where the number came from.
The difference is small in syntax but large in effect:
| Operator | Effect on an existing file |
|---|---|
> | Replaces its contents |
>> | Adds output at the end |
A common diagnostic habit is to use > for a report that should represent this run only, and >> for an intentionally cumulative record.
Feed a file into a command with <
The less-than operator redirects a file into a command’s standard input:
printf '%s\n' embedding-worker api-server cache api-server embedding-worker > services.txt
sort < services.txt > services-sorted.txt
cat services-sorted.txt
Here:
services.txtis used as the input tosort.sortarranges the lines alphabetically.- The sorted result is saved in
services-sorted.txt.
For sort, these two forms are often equivalent:
sort services.txt
sort < services.txt
The input-redirection form becomes especially clear when a command is part of a larger pipeline or when you want to make its data flow explicit.
To produce a sorted list with duplicates removed:
sort -u services.txt
By default, sort compares text lexically. If you later sort a file containing one numeric value per line, such as memory measurements or latency values, sort -n performs a numeric sort instead.
Keep errors distinct from normal output
Errors are often valuable evidence. Do not routinely discard them while diagnosing a problem.
Run this harmless command:
ls api.log does-not-exist.txt > listing.txt 2> listing-errors.txt
Then inspect both files:
cat listing.txt
cat listing-errors.txt
ls successfully finds api.log, so that normal result goes to listing.txt. It cannot find does-not-exist.txt, so the error goes to listing-errors.txt.
The 2 in 2> means “redirect stream number 2,” which is STDERR.
Sometimes you want one combined diagnostic record:
ls api.log does-not-exist.txt > combined-diagnostic.txt 2>&1
Read this from left to right:
> combined-diagnostic.txtsends standard output to the file.2>&1sends standard error to wherever standard output is currently going.
The order is significant. For incident investigation, retaining both streams can prevent an error message from being separated from the normal output that provides context.
Search and filter with grep
grep prints the lines that match a pattern. It is one of the most frequently used tools in infrastructure work because the first question during investigation is often: Which records mention the event I care about?
Search the log directly:
grep -F 'ERROR' api.log
Use grep directly on a file when that is all you need. This is clearer than the longer equivalent:
cat api.log | grep -F 'ERROR'
The second form works, but grep already knows how to read a file, so the cat adds no value.
Useful beginner options include:
| Command | Meaning |
|---|---|
grep -nF 'ERROR' api.log | Find literal ERROR and include line numbers |
grep -iF 'error' api.log | Ignore upper/lowercase differences |
grep -vF 'ERROR' api.log | Show lines that do not contain ERROR |
grep -cF 'ERROR' api.log | Count matching lines |
grep -F 'route=/predict' api.log | Find requests to the prediction route |
Try these commands one at a time:
grep -nF 'ERROR' api.log
grep -cF 'ERROR' api.log
grep -vF 'ERROR' api.log
grep -F 'route=/predict' api.log
A few interpretation details matter:
grep -ccounts matching lines, not necessarily every occurrence of a word.grepis case-sensitive by default.ERRORanderrorare distinct unless you add-i.-Fis a good default when you are looking for literal log text such asstatus=500,/predict, ormodel_timeout.
Compose commands with pipes
A pipe, written |, passes the standard output of the command on its left to the standard input of the command on its right.
For example:
grep -nF 'ERROR' api.log | sort > errors-report.txt
This pipeline has three stages:
api.log → grep matching error lines → sort those lines → errors-report.txt
Build pipelines incrementally. First verify the search:
grep -nF 'ERROR' api.log
Then add sorting:
grep -nF 'ERROR' api.log | sort
Only when that output looks correct should you add redirection:
grep -nF 'ERROR' api.log | sort > errors-report.txt
This incremental habit is important. A long one-line pipeline may look impressive, but a problem in any stage can make its final result misleading. Checking each stage lets you identify whether the issue is the source command, the filter, the ordering, or the file destination.
For this small time-ordered log, sorting errors is not especially useful—timestamps already establish order. The point is the pattern: produce → filter → transform → save. You will reuse it for process output, disk reports, container logs, and eventually Kubernetes diagnostics.
Inspect the latest events with tail
Logs generally grow by appending new records. tail is designed for that pattern.
Show the last four lines:
tail -n 4 api.log
This is useful when an event has just occurred and you want recent context rather than the whole file.
The order of tail and grep changes the question you are asking:
tail -n 4 api.log | grep -F 'ERROR'
This means: “Among the four most recent events, which are errors?”
grep -F 'ERROR' api.log | tail -n 1
This means: “Among all recorded error entries, show the latest one.”
In chronological logs, the second form is often a quick way to locate the most recent matching failure.
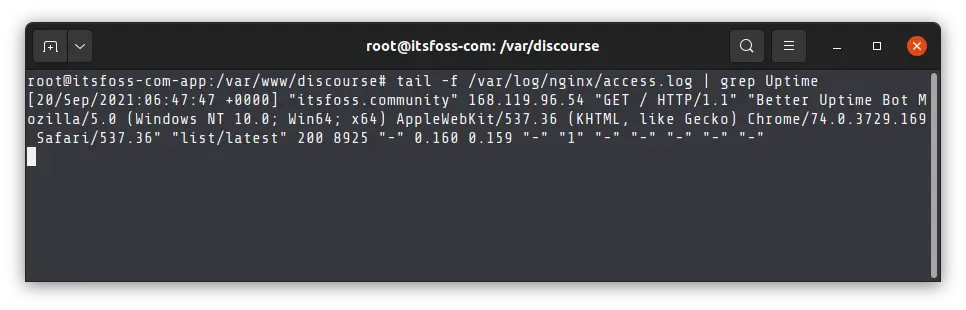
The continuous-monitoring example below shows the same idea against an Nginx access log: tail -f follows a file as new lines arrive, while grep limits the display to lines containing a chosen term.
To try a live version in your own sandbox, open a second terminal window. In that second terminal, run:
cd ~/ai-infra-lab/log-analysis
tail -n 0 -f api.log | grep --line-buffered -F 'ERROR'
This begins with zero old lines and waits for future additions. --line-buffered helps grep display each matching line immediately when it is used in a live pipeline.
Back in your first terminal, append a new error event:
printf '%s\n' \
'2025-03-08T10:01:02Z ERROR request_id=req-108 route=/predict status=500 latency_ms=902 message=timeout' \
>> api.log
The second terminal should print that new line. End the live monitor with Ctrl+C in the second terminal. This stops the foreground tail | grep pipeline; it does not delete or alter the log file.
In production, log files may be renamed and recreated during rotation. Once you are comfortable with basic following, tail -F is often preferable to tail -f because it can continue following a file name after rotation. For now, tail -f is the essential behavior to understand.
Key takeaways
- Commands communicate through
STDIN,STDOUT, andSTDERR. >writes standard output to a file and overwrites an existing destination;>>appends instead.<supplies a file as a command’s standard input.2>captures error output separately;> file 2>&1captures normal output and errors together.- A pipe (
|) sends one command’s output directly into the next command. grepsearches matching lines;-n,-i,-v, and-care especially useful options.sortorders lines, whilesort -uorders them and removes duplicate lines.tail -nshows recent lines, andtail -ffollows a growing log.- Build pipelines a stage at a time, inspect intermediate output, and redirect only after you trust the result.
Next, you will learn why some files can be read or executed while others produce “Permission denied,” by working with Linux ownership and read, write, and execute permissions.
Can't find a good explanation? Sign up and we'll make it for you
Sign up