
Hello! Welcome back to your system design course.
In our last lesson, we focused on how different parts of a system communicate by designing API contracts using REST and RPC. We defined the "rules of engagement" for how services talk to each other. Now, it's time to zoom out and visualize the entire system.
Today, we'll learn how to create the blueprints for our systems. As a product designer, you know that before manufacturing begins, you need detailed assembly drawings that show every major part and how they connect. In system design, we have a similar tool for visualizing the high-level structure of our software.
Today's Goal
This lesson will teach you how to create component diagrams that effectively communicate system architecture. By the end, you'll be able to read and draw these diagrams, which are a fundamental way to represent and discuss the structure of any complex system.
1. What is a Component Diagram?
A component diagram is a type of diagram in the Unified Modeling Language (UML) that provides a high-level, structural view of a system. Instead of focusing on the details of individual functions or classes, it shows the system's major modular parts—or components—and the relationships between them.
These components can be:
- Software services: A payment gateway, an authentication service, a user profile manager.
- Databases: A user database, a product catalog.
- User Interfaces: A web front-end or a mobile app.
- Third-party systems: An external email-sending service or a maps API.
To get a formal definition and understand the purpose of these diagrams, let's start with a short reading.
What Is a Component Diagram? | UML Component Diagram Tutorial
This article from the Creately blog provides a clear and concise introduction to component diagrams, explaining what they are and why they are useful.
Please read the introduction and the sections 'Purpose of a Component Diagram' and 'Use Cases'. Focus on how these diagrams help visualize the system's structure and communicate its design to different stakeholders.
As the article points out, the main goals are to visualize the architecture, understand dependencies, and provide a common language for everyone on the team, from architects to project managers.
2. The Language of Component Diagrams: Core Symbols
To create effective diagrams, we need to learn the standard notation. The good news is that you only need to know a few core symbols to create powerful and clear diagrams.
Let's watch a short video that introduces the most essential symbols one by one.
How to draw component diagram?
This video from MADE_EASY_FOR_YOU gives a very straightforward introduction to the basic symbols used in component diagrams.
Please watch the following segments to get a feel for the basic shapes: Component Symbol (0:23 - 3:18) Interface Symbols (5:41 - 10:07) Relationship (Dependency) Symbol (12:15 - 14:27) Don't worry about memorizing everything; just get familiar with the visual language.
Let's solidify those concepts. Here are the key symbols and what they mean:
-
Component: A rectangle with the
<<component>>stereotype or a small component icon. This is the main building block of your system (e.g.,Authentication Service). -
Provided Interface (Lollipop): A solid line with a circle at the end. This represents an interface that the component offers or provides to other components. This is the visual representation of the API contract we discussed in the last lesson. If a
Payment Servicecomponent has a provided interface, it means it's offering payment processing functions to the rest of the system. -
Required Interface (Socket): A solid line with a semi-circle (or socket) at the end. This represents an interface that the component needs or requires from another component. If an
Order Servicehas a required interface for payments, it means it needs to use the services offered by thePayment Service. -
Assembly Connector: When you "plug" a required interface (socket) into a provided interface (lollipop), you are showing how two components are wired together.
-
Dependency: A dashed arrow (
--->). This is a more general way to show that one component depends on another. For example, aWeb Servercomponent might depend on aDatabasecomponent.
The "lollipop and socket" notation is incredibly powerful because it makes the provider/consumer relationship explicit. Let's watch one more short clip that connects this directly to the concept of APIs.
UML Structural Diagrams: Component Diagram - Georgia Tech - Software Development Process
This clip from a Georgia Tech course on Udacity gives a slightly more formal explanation of the lollipop and socket notation, explicitly calling them out as APIs.
Watch from 1:19 to 2:38. Notice how the speaker describes the provided interface (lollipop) as the API a component offers, and the required interface (socket) as the API a component needs from another.
3. How to Create a Component Diagram
Now that we know the symbols, how do we go about creating a diagram? It's a structured process, much like the design process you're familiar with.
Component Diagram Tutorial | Complete Guide ... - Creately
The Creately article we looked at earlier also has an excellent, practical guide on how to draw a component diagram step-by-step.
Please read the section 'How to Draw a Component Diagram'. It breaks the process down into five clear steps, from defining the scope to reviewing the final diagram.
Let's summarize those steps:
- Define the Purpose and Scope: Decide what you want to show. Are you mapping out the entire system, or just one part of it? Don't try to diagram everything at once.
- Identify the Components: List the major functional blocks of your system. Think about services, databases, UIs, and external systems.
- Map Interfaces and Dependencies: For each component, ask:
- What services does it provide to others? (Add lollipops).
- What services does it require from others? (Add sockets).
- Connect the sockets to the lollipops. Use dependency arrows for more general relationships.
- Add Ports and Details (Optional): For very complex components, you can use ports (small squares on the component's edge) to group interfaces.
- Review and Annotate: Clean up the diagram. Add notes to clarify any complex parts. Ensure it's easy to read and understand.
Example Walkthrough
Let's apply this to an example. Look at this diagram for an online store.

Let's break down the "Online Store Process" diagram using our steps:
- Scope: The diagram shows the high-level architecture of an e-commerce platform.
- Components: The architect identified three major subsystems (shown as large component boxes):
WebStore,Warehouses, andAccounting. Inside these, they identified smaller components likeSearchEngine,ShoppingCart,Inventory, andOrders. - Interfaces/Dependencies:
- The
WebStorecomponent depends on theWarehousesandAccountingcomponents (indicated by the dashed arrows). This makes sense; the web front-end needs to check inventory and process orders. - Inside the
WebStore, theShoppingCartcomponent depends on theAuthenticationcomponent to know which user is shopping.
- The
- Review: The diagram is clean and uses grouping to manage complexity, making it easy to understand the main parts of the system at a glance.
Here is another, more detailed example.
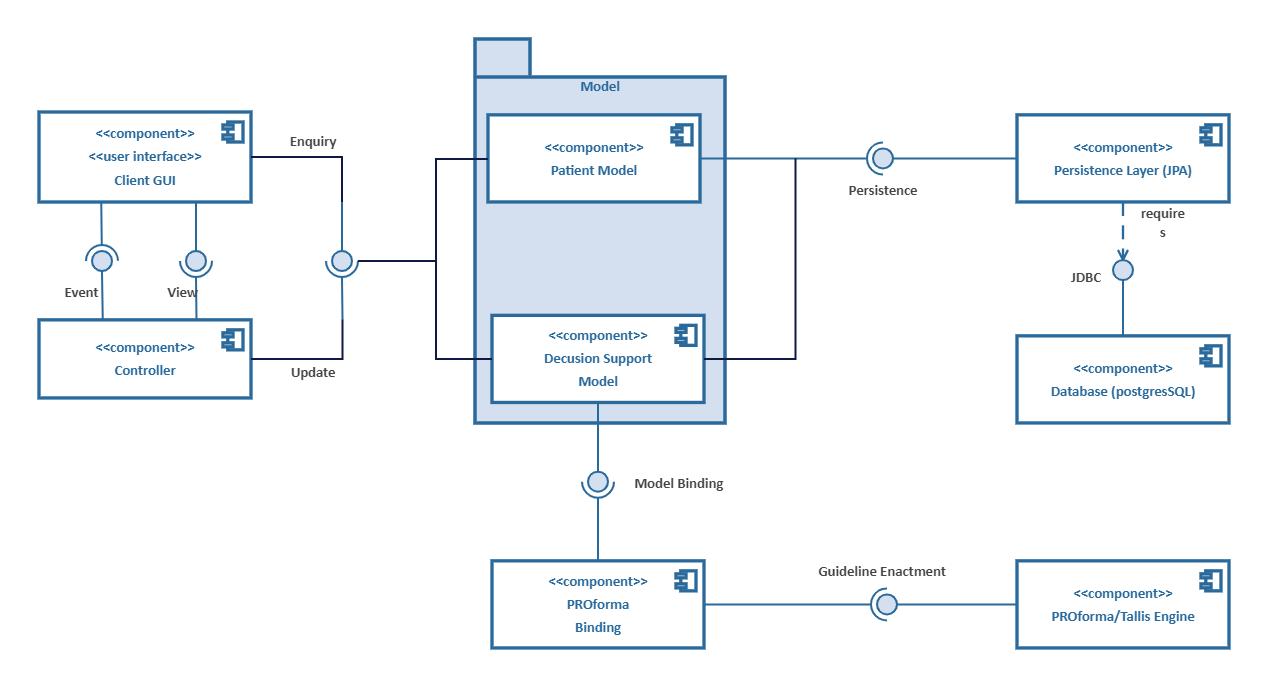
In this diagram, you can clearly see the API contracts in action:
- The
ControllerprovidesEnquiryandUpdateinterfaces. - The
Client GUIrequires those same interfaces to function. - The
Controllerin turn requires theModelAccessinterface, which is provided by thePersistence Layer.
This visual syntax makes it immediately obvious how the system is wired together.
Conclusion
Today, you've learned how to translate a system's abstract structure into a clear, standardized visual format. Component diagrams are an essential tool for thinking about and communicating system architecture.
Key Takeaways:
- Component diagrams are blueprints that show the high-level, modular structure of a system.
- The core symbols are the component, the provided interface (lollipop), the required interface (socket), and the dependency arrow.
- The lollipop/socket notation is a powerful way to visualize the API contracts between components, showing who provides a service and who consumes it.
- Creating a diagram is a step-by-step process of identifying components and mapping their interactions.
Preview of the Next Lesson:
In our diagrams, we've frequently drawn a box labeled "Database" or "Persistence." This is often one of the most critical components in any system. But what kind of database should it be? In our next lesson, we will dive into that box and learn how to select appropriate database types (SQL, NoSQL, NewSQL) based on a system's specific requirements.
Can't find a good explanation? Sign up and we'll make it for you
Sign up