
Good work getting the script into shape. In the previous lesson, you turned verified research into a concise spoken explanation: a hook, a causal mechanism, an essential tradeoff, and a closing line. Now you will make it producible.
Your task is to convert that narration into a timed audiovisual plan: small narration beats, each paired with a clear visual action that helps a beginner understand the words at the moment they hear them. For your first 30–60 second explainer, this plan matters more than polished artwork. It prevents the common failure mode of drawing attractive scenes that do not actually explain the mechanism.
A script tells; a beat plan coordinates
A spoken script is linear. It tells you what the viewer will hear. An engineering explainer is audiovisual: while the viewer hears “four rope sections support the load,” they should see four rope sections, the shared load, and an action that makes the relationship legible.
A narration beat is a short unit of speech organized around one change in understanding. A beat may be one sentence, part of a sentence, or occasionally two very short sentences that belong together.
A visual action is the specific change the audience sees during that beat. “Pulley diagram on screen” is not an action. “Four supporting rope sections draw in one at a time, then pulse upward” is an action.
For this course, your production plan needs five fields:
| Field | What to write | Example |
|---|---|---|
| Beat | A simple reference code | B4 |
| Timecode | Start and end on the timeline | 0:14–0:20 |
| Narration | The exact spoken words for that window | “When you pull the free end…” |
| Visual action | What changes on screen | A hand pulls the rope; each support line gains an upward pulse. |
| Screen text / sound note | Only if needed | Small label: “tension” |
The Canva template in the image uses the same core idea: scene, timestamp, narration, and visuals. You do not need a complex studio document. A notes app, spreadsheet, or Canva page with those columns is enough.
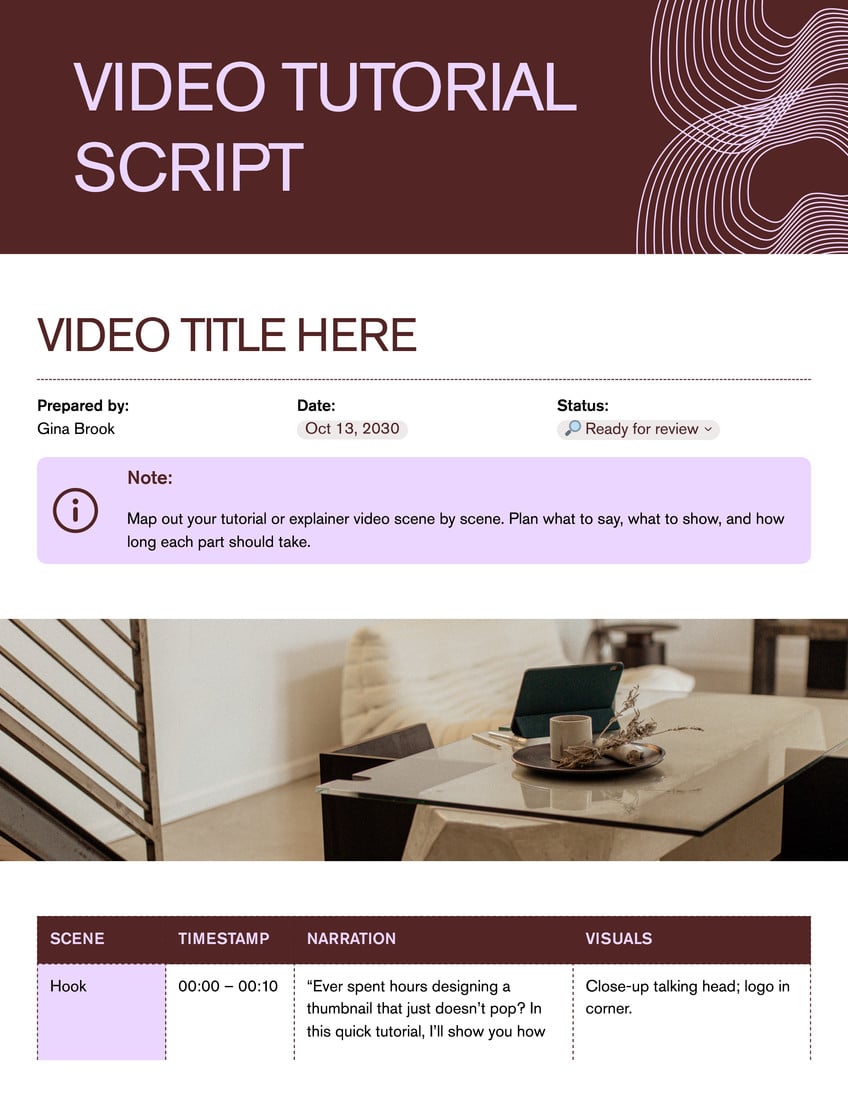
How to write a video script | Canva
Read Canva’s explanation of audiovisual scripting. It gives you a production-friendly format for placing visual direction beside the narration, then shows how pacing and timing turn a written draft into a usable video plan.
In the section “Audiovisual (AV) or two-column format,” read the AV format explanation. Your animation is a one-person production, but the format still separates what viewers see from what they hear. Then read “Pacing or words per minute (WPM)”, from the pacing discussion. Finally, in “How to write a video script,” find the subsection “Time your script” and read the timing instruction. Notice that a word count is only an estimate; visuals and readable on-screen text also need time.
Time the spoken track before designing the animation
A narration rate around 150 words per minute is a useful upper planning estimate, but technical explainers often need a little more breathing room. Your viewer must process both the explanation and the diagram. Begin by reading your script aloud at a clear, conversational pace and timing it on your phone.
You can use this estimate before recording:
For example, a 90-word script at 135 words per minute takes about 40 seconds. But do not treat the calculation as a command. A pause after a surprising claim, a moment to count four visible supports, or a label that must be read can all justify a slower delivery.
Use this timing rule:
The narration sets the deadline; comprehension sets the pacing.
If your recorded read runs long, resist the temptation to speed up every word. First cut a nonessential aside, repeated phrase, or decorative adjective. If the central mechanism itself does not fit, your topic is too broad for the chosen duration.
Give a visual enough time to communicate
A beat needs enough screen time for four things:
- Recognition — the viewer identifies the object or diagram.
- Change — the relevant visual action occurs.
- Connection — the viewer links that action to the narration.
- Hold — the result stays visible briefly before the next idea replaces it.
This does not mean every shot must be slow. A quick hook may change in under a second. But when a new engineering relationship appears, such as force sharing or heat flow, do not introduce it and immediately cut away.
A useful test is to mute the audio. If you can still tell what physical relationship is being shown, the visual action is probably doing real explanatory work. If you cannot, that may be fine for a decorative transition—but not for the central mechanism.
Turn words into visible evidence
When mapping narration to visuals, look for the words that carry the explanation:
- Objects and components need to appear before or as they are named.
- Action verbs should usually become motion: pulls, rotates, compresses, flows, transfers, pushes.
- Numbers and quantities should become countable shapes, repeated marks, or simple comparison graphics.
- Cause-and-effect language needs a visible relationship, not merely a label.
- Tradeoffs need both sides present long enough to compare.
For instance, consider this narration:
“With four supporting sections, the load is shared four ways, so ideally you need about a quarter of the pulling force.”
A weak visual note would say:
“Show a pulley system.”
That visual does not reveal why the force changes. A useful visual action note could say:
“Hold the moving pulley block and crate in place. Draw four taut supporting rope sections in sequence. Add one equal upward force mark to each section. As all four marks pulse, shorten the pull-force arrow at the free end and label it ‘about one quarter, ideally.’”
The visual is not simply illustrating the topic. It is making the causal claim inspectable.
Match visual complexity to the sentence
A simple practical rule is one main visual idea per beat. You can animate several small elements, but they should all support one thought.
| Narration purpose | Appropriate visual action |
|---|---|
| Present a puzzle | Show the surprising outcome first: a person lifting a large crate. |
| Name an object | Reveal the whole object, then highlight only relevant parts. |
| Explain a mechanism | Animate the component movement or force relationship. |
| Show a quantity | Count, repeat, divide, compare, or use a simple meter. |
| State a limitation | Introduce the condition visually, such as friction marks or a longer rope path. |
| Deliver the closing | Simplify the scene into the core contrast or takeaway. |
Avoid putting every noun from the narration on screen as text. Use labels only for terms that genuinely reduce confusion, such as “moving block,” “tension,” or “friction.” In most beats, the moving diagram should do more work than the words printed on it.
Choose a view that serves the idea
You will storyboard more formally later in the course. At this stage, make a simpler decision: what is the most useful view for this particular beat?
TipTut’s storyboard example demonstrates the basic principle: use a wide view to establish context, then move closer when a detail matters. The same principle works well in flat-vector engineering animation.
How to Write a Script & Storyboard for Animation
Watch TipTut’s “How to Write a Script & Storyboard for Animation” for a compact demonstration of turning written lines into visual shots. Focus on the decision behind each view, not on copying the character-animation style.
Watch script to shots. Notice how a wide view establishes setting and relevant objects, while closer and over-the-shoulder views direct attention to a particular action or emotional response. Then watch refining pacing. The useful takeaway for your project is that visual planning is iterative: revise, add, remove, or reposition a visual beat when the read-through exposes a missing idea or rushed moment.
For a mechanical diagram, think of “view” less as a camera and more as what portion of the system deserves attention:
- Use a wide view to establish the complete machine and the outcome.
- Use a closer view when the mechanism depends on a small component, joint, valve, gear, or rope path.
- Use a cutaway view when the relevant process is internal.
- Use a simplified diagram view when realism hides the relationship you need to explain.
Do not switch views merely to make the video feel busy. Change the view when the viewer needs a new scale of information.
Worked example: map a pulley script to a 46-second plan
The previous lesson used a block-and-tackle script as an example. Below, the script has been divided into eight beats. Its roughly 99 words are paced across 46 seconds, leaving space for the crucial force-sharing diagram and the tradeoff.
| Beat | Time | Narration | Visual action | Screen text |
|---|---|---|---|---|
| B1 | 0:00–0:05 | “How can one person lift a load that seems far too heavy?” | A small person pulls a rope; a large crate rises slightly. Let the size contrast create the puzzle. | None |
| B2 | 0:05–0:09 | “A block and tackle does not make the load lighter.” | Freeze the crate. Show a downward weight arrow; briefly place a restrained “same weight” label beside it. | Same weight |
| B3 | 0:09–0:14 | “It gives the load more rope sections to hang from.” | Zoom closer to the pulley block. Draw the rope path and reveal four vertical supporting sections one at a time. | Four supports |
| B4 | 0:14–0:20 | “When you pull the free end, each taut section pulls upward on the moving block.” | The free rope end moves down. Each of the four support sections receives an upward pulse or arrow toward the moving block. | Upward pull |
| B5 | 0:20–0:28 | “With four supporting sections, the load is shared four ways, so ideally you need about a quarter of the load’s weight in pulling force.” | Keep all four supports visible. Divide the downward load arrow into four equal upward arrows. Shorten the pull-force arrow beside the person. | About one quarter, ideally |
| B6 | 0:28–0:35 | “But there’s no free energy. To lift the load one meter, you pull about four meters of rope.” | Keep the crate and pulley visible. Add a one-meter vertical ruler beside the crate and a four-meter rope-distance marker along the pulled rope. | 1 m lift / 4 m rope |
| B7 | 0:35–0:41 | “Real pulleys lose some advantage to friction.” | Add small contact marks at pulley wheels and make the pull-force arrow lengthen slightly from the ideal value. | Friction |
| B8 | 0:41–0:46 | “Less force, more rope. That is the trade.” | Return to a clean wide diagram: short force arrow on one side, long rope-distance marker on the other. Hold the final comparison still. | Less force / More rope |
Several choices make this plan clearer:
- The crate stays on screen through most of the explanation. The viewer does not have to remember what the rope forces are supporting.
- B3 introduces the four rope sections before B4 explains their action. The viewer sees the parts before being asked to reason about them.
- B5 uses equal repeated marks rather than a formula. For a beginner audience, the visual count supports the causal explanation without turning a 46-second video into a mechanics lecture.
- B6 immediately corrects the “free energy” misunderstanding. The longer rope-distance marker makes the tradeoff visible.
- B8 removes detail rather than adding a new image. A closing should compress the idea, not introduce another mechanism.
Notice also that B5 lasts eight seconds. That is not wasted time. It contains the central claim of the video, and the viewer needs to see the count, the equal sharing, and the reduced pull-force comparison.
Build your own timed beat sheet
Use your completed script and make a first-pass plan. Keep it rough. You are not drawing final artwork yet; you are deciding what must happen on the screen and when.
The Essential Guide To Writing Shot Lists for Video Success
Read the first three steps of TechSmith’s shot-list workflow. It is written for filmed video, but its structure transfers directly to animation: identify story beats, choose the viewer’s needed view, and attach a realistic duration and action to each planned shot.
In “How to make a shot list step by step,” read Steps 1. Identify scenes and script references, 2. Choose shot types and angles, and 3. Add camera movements and timing, from the planning sequence. For your vector explainer, translate camera movement into changes of composition, zoom, pan, or diagram focus. Keep the article’s core question in mind: what does the viewer need to see at this moment?
First-pass workflow
-
Record or perform a rough read-through. Use your phone’s voice recorder if possible. It does not need to be the final narration; it needs natural timing. Put a timestamp beside every sentence or logical clause where the idea changes.
-
Mark the anchor words. Underline the nouns, actions, numbers, and contrasts that a viewer must understand. These are candidates for visual evidence.
-
Divide the script into six to ten beats. For a 30-second video, five to seven beats are usually enough. For a 60-second video, aim for roughly eight to twelve. Do not create a new beat for every decorative motion.
-
Write a visible verb in each visual-action cell. Use words such as reveal, draw, split, rotate, pulse, zoom, slide, count, highlight, or hold. Replace vague notes such as “show engine” with “cut away engine casing, then highlight the piston as it moves downward.”
-
Add only essential on-screen text. Write the exact text, not “add label.” Keep most labels to a few words, and schedule a brief hold after they appear.
-
Add the durations. Your final beat must end at your target duration. If the timing does not fit, revise the narration or reduce the number of distinct visual claims; do not simply shrink every beat.
Use this blank structure:
| Beat | Time | Narration | Visual action | Screen text / sound |
|---|---|---|---|---|
| B1 | 0:00– | |||
| B2 | ||||
| B3 | ||||
| B4 | ||||
| B5 | ||||
| B6 | ||||
| B7 |
Check the plan without drawing it
Before moving on, read the narration aloud while pointing at each row in your beat sheet. During the read-through, check for three warning signs:
- A visual arrives after the narration has already relied on it. Introduce an unfamiliar component slightly before or as you name it.
- A single beat has too many jobs. If it introduces five components, labels them, explains their interaction, and changes viewpoint, split it.
- The narration finishes while the visual is still explaining. Either shorten the visual action, extend the beat with a purposeful pause, or simplify the visual idea.
A good timed beat sheet may still feel unglamorous. That is normal. Its purpose is to expose timing and explanation problems while changes are cheap.
Key takeaways
A timed beat sheet is the bridge between your written explanation and the animation you will eventually build. It places the exact narration beside the visual action, time window, and any essential label or sound cue.
For each beat, make the screen provide evidence for the narration: show components before explaining them, turn key verbs into visible motion, and make quantities and tradeoffs comparable. Let the central mechanism have enough time to be recognized, animated, and understood.
By the end of this lesson, you should have a first audiovisual plan containing:
- a target duration based on a rough spoken read-through;
- six to twelve timecoded narration beats;
- one clear visual action per beat; and
- only the labels and effects that support comprehension.
Next, you will begin the practical VectorMotion workflow by setting up a project with the right canvas size, frame rate, duration, and file organization for YouTube.
Can't find a good explanation? Sign up and we'll make it for you
Sign up