
Welcome back. You have already separated two major memory costs in an LLM server: fixed model weights and request-dependent KV-cache memory. That distinction becomes more useful once you can describe what the user actually experiences while those resources are working.
This lesson gives you a precise vocabulary for inference performance. By the end, you will be able to distinguish time to first token (TTFT), inter-token latency (ITL), end-to-end latency, throughput, and concurrency—and avoid the common mistake of treating “tokens per second” as a complete performance result.
A request has two main timing phases
An LLM response is not produced in one uniform operation. The server first processes the whole prompt, then generates output token by token. The previous lesson’s KV cache is what makes the second phase practical: after prefill, the model can reuse the prompt’s stored keys and values while decoding each new token.
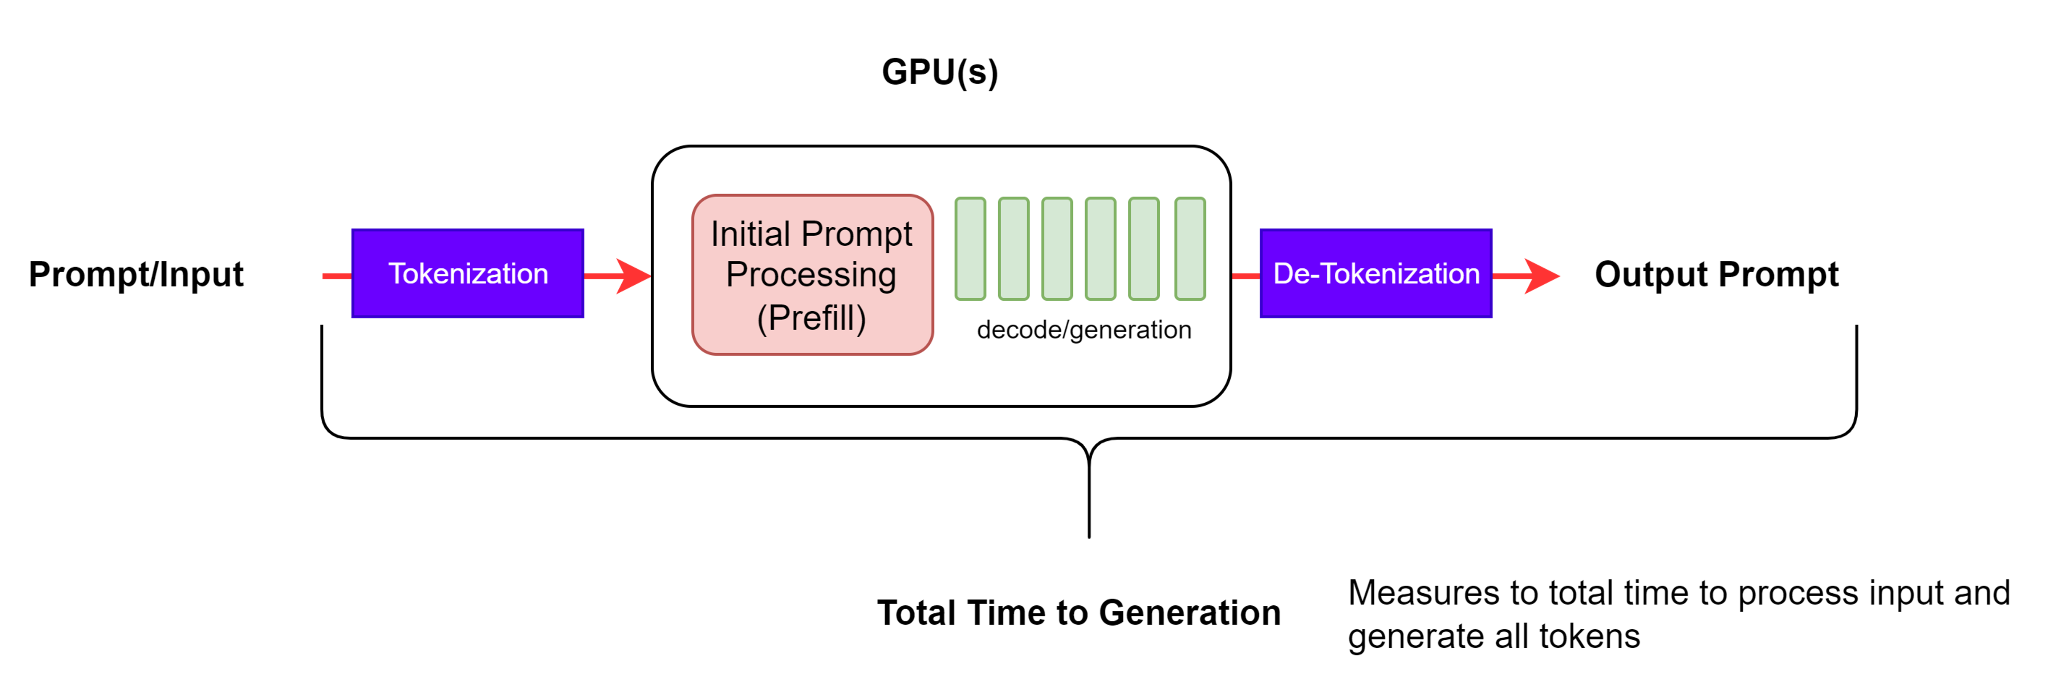
From a user’s perspective, the important observation points are:
- The client submits a request.
- The client receives the first meaningful output token.
- The client receives later tokens while streaming.
- The client receives the final token and completion signal.
The service may also spend time queueing before it begins model work. Therefore, a user-visible metric normally includes more than GPU computation: it may include network transfer, scheduling, tokenization, queueing, prefill, decoding, and streaming overhead.
Mastering LLM Inference Optimization From Theory to Cost Effective Deployment: Mark Moyou
Watch the metrics overview from “Mastering LLM Inference Optimization From Theory to Cost Effective Deployment” by AI Engineer. It connects the prefill and decode workload you have seen so far to the three latency measures used in production.
Watch the metrics overview. Focus on the distinction between processing the prompt before the first token, the gaps between later tokens, and the total time until completion.
A useful first mental model is:
- TTFT concerns the wait before anything appears.
- ITL concerns the smoothness of the visible stream after it starts.
- End-to-end latency concerns the wait for the whole answer.
- Throughput concerns how much useful work the system completes across users.
- Concurrency concerns how many requests overlap in time.
These are connected, but they are not interchangeable.
The five metrics, precisely
1. Time to first token: responsiveness
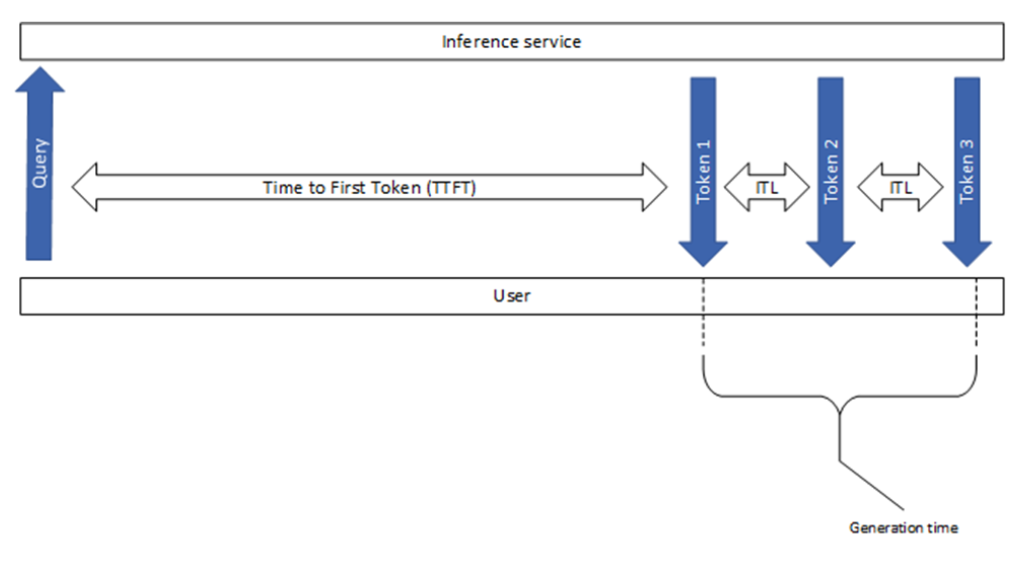
Time to first token is the elapsed time from request submission to receipt of the first non-empty output token.
For a streaming chat interface, TTFT is often the latency users notice most. A response can take several seconds to finish yet still feel responsive if it starts promptly. Conversely, a response that appears only after a long pause feels slow even if subsequent tokens arrive quickly.
TTFT can include:
- client-to-server network time;
- time waiting in a queue;
- request validation and tokenization;
- prefill, which processes every prompt token and builds the KV cache;
- the first decode step;
- transmission and detokenization of the first output.
Longer prompts usually increase TTFT because prefill has more tokens to process. Higher load can also increase TTFT even for a short prompt, because the request may wait before prefill starts.
2. Inter-token latency: streaming smoothness
Inter-token latency is the elapsed time between consecutive generated output tokens. It is also often called time per output token (TPOT) when reported as an average.
For output-token arrival times , individual token gaps are:
for:
The average inter-token latency is:
The first-token wait is deliberately excluded. ITL measures the decode portion after streaming has begun.
Low, stable ITL produces fluid output. High or erratic ITL produces visible pauses and bursts. Decode performance can change under load because multiple active requests share compute and memory bandwidth, while their KV caches continue to grow.
For a long response, a rough per-user streaming rate is:
If average ITL is ms, the steady decode rate is about output tokens per second for that request. This is not the same as overall system throughput.
3. End-to-end latency: time until completion
End-to-end latency, also called E2E latency or time to completion, is the time from request submission until the complete response has been received.
For a streamed response with output tokens, and assuming the final token is the final response event, the relationship is approximately:
E2E latency is particularly important when the application cannot act until it has the full result. Examples include a batch summarization pipeline, a structured JSON response, or a code-generation workflow that waits before testing the output.
A short response may have excellent E2E latency despite mediocre ITL, because it contains few output tokens. A long response may have a good TTFT but poor E2E latency simply because decoding many tokens takes time.
4. Throughput: system work per unit time
Throughput measures the rate at which a system completes useful work. In LLM serving, the most common form is output tokens per second (TPS).
For a benchmark covering multiple requests, system output TPS is commonly measured as:
This is a system-wide number. It totals output from all requests and divides by the wall-clock duration of the whole run.
A deployment can have high system TPS while an individual user sees slow token delivery. For example, a server may generate tokens for 32 users at once, producing many total tokens per second, while each user receives tokens less frequently than they would at low concurrency.
Always state which throughput you mean:
| Metric | Meaning | Primary use |
|---|---|---|
| System TPS | Total output tokens per second across all requests | Capacity planning and cost analysis |
| Per-user TPS | Output rate experienced by one request | Streaming experience |
| RPS | Completed requests per second | Capacity for request-oriented workloads |
| Prompt throughput | Input tokens processed per second | Prefill-focused workloads |
“Tokens per second” without a scope, request mix, concurrency level, and token type is incomplete evidence.
5. Concurrency: overlapping in-flight requests
Concurrency is the number of requests that are in progress at the same time. It is a count, not a rate.
A request is often considered in flight from submission until the final response. Under that client-facing definition, requests waiting in the queue are concurrent even if the model has not started processing them.
In serving-engine terminology, you may instead see:
- offered concurrency: client requests submitted and not yet complete;
- active sequences: requests admitted to the model engine and holding execution or KV-cache capacity;
- configured maximum concurrency: the upper limit the server is willing to accept or run.
These values can differ. If 50 requests have been submitted but the engine can only run 16 active sequences, some requests are concurrent from the client’s perspective while queued from the engine’s perspective.
This connects directly to KV-cache sizing: active long-context requests consume cache memory together. A higher configured concurrency can improve hardware utilization, but it also raises memory pressure and can worsen queueing, TTFT, and ITL.
Metrics — NVIDIA NIM LLMs Benchmarking
Read NVIDIA’s metric definitions to establish a consistent measurement vocabulary. The most important theme is that tools can calculate similar-sounding metrics differently, so definitions and measurement boundaries must be recorded with every benchmark.
In “Time to First Token,” read the TTFT explanation. Notice both the queueing and prefill components. Then read the opening of “End-to-End Request Latency,” from the end-to-end definition. In “Inter-token Latency,” read the ITL definition, paying attention to the fact that TTFT is excluded. Finally, in “Tokens Per Second,” read the system-throughput discussion. Compare system TPS with the later paragraph on TPS per user rather than treating them as the same statistic.
One request trace, measured correctly
Suppose a streamed request produces four output tokens. The client records the following timestamps:
| Event | Time since submission |
|---|---|
| Request submitted | ms |
| Token 1 received | ms |
| Token 2 received | ms |
| Token 3 received | ms |
| Token 4 and completion received | ms |
The metrics are:
The three inter-token gaps are:
So average ITL is:
End-to-end latency is:
The response began after ms, then took another ms to stream from its first to final token. That is why TTFT and ITL need separate reporting: neither one alone describes the complete experience.
There is also an instrumentation detail worth keeping in mind. Streaming APIs often send text chunks, not exactly one model token per network event. A chunk may contain several tokens, or transport buffering may delay several decoded tokens before delivery. For precise engine-level ITL, use server-side token timestamps when the engine exposes them. For client-observed experience, record arrival timestamps but label the metric honestly as stream-chunk latency when individual token boundaries are unavailable.
Throughput and concurrency create trade-offs
Consider a separate benchmark at concurrency 10. Across the full run, the server generates 4,000 output tokens. The first request is submitted at the start of the run, and the final response arrives 20 seconds later.
That result does not mean each of the 10 users received 200 tokens per second. It means the service collectively produced 200 output tokens per second across the workload.
Increasing concurrency frequently has this pattern:
| Load condition | System TPS | TTFT and E2E latency | Per-user token rate |
|---|---|---|---|
| Very low concurrency | Often below hardware capacity | Usually low | Usually high |
| Moderate concurrency | Often rises substantially | May rise modestly | Often declines somewhat |
| Near saturation | Plateaus | Rises sharply, especially from queueing | Declines and may become uneven |
| Beyond saturation | Can stop improving or decline | Often poor | Poor |
The underlying reason is that batching overlapping work can make better use of the accelerator. But each request shares finite compute, memory bandwidth, and KV-cache capacity with other requests. More concurrency is therefore not automatically better; its value depends on whether you are optimizing for interactive responsiveness, batch capacity, or a mixture.
How To Serve a Local LLM to Many Users at Once
Watch this short excerpt from “How To Serve a Local LLM to Many Users at Once” by Devsplainers for an intuition about why one-request-at-a-time serving underuses an accelerator and why serving several users changes the meaning of TPS.
Watch the single-user limit, then continue with the concurrency trade-off. Do not focus on the implementation details of continuous batching yet; focus on the distinction between total system output and each user’s generation speed.
A useful capacity relation, under stable conditions, is Little’s law:
For example, if a service receives requests per second and each request takes seconds end to end on average, it will have roughly concurrent in-flight requests. This is why a seemingly moderate request rate can still require substantial active-request capacity when generations are long.
A practical measurement contract
Before comparing model servers, quantizations, or hardware, write down the measurement contract. Without it, a benchmark number is difficult to interpret or reproduce.
For each benchmark run, record:
-
Workload
- prompt-token length distribution;
- maximum output tokens;
- sampling settings;
- model and quantization.
-
Load model
- requested concurrency;
- whether requests are sent all at once or at a fixed arrival rate;
- queue and timeout behavior.
-
Metric boundaries
- whether timestamps are taken at the client or server;
- what counts as the first token;
- whether TTFT is excluded from ITL;
- whether TPS includes output tokens only or input and output tokens.
-
Results
- TTFT;
- mean and tail ITL;
- E2E latency;
- system TPS;
- achieved concurrency and error rate.
This discipline prevents misleading conclusions such as “Server A is faster because it has higher TPS.” Server A may have used much higher concurrency, longer queueing, a different output length, or a different TPS definition.
Key takeaways
- TTFT is the wait from submission to the first meaningful streamed token. It is heavily affected by queueing and prompt prefill.
- ITL is the gap between later output tokens. It describes the smoothness and speed of decoding after the first token.
- E2E latency is the full time from submission to complete response. It combines the initial wait with all subsequent generation.
- Throughput is system work per unit time, commonly output tokens per second. System TPS and per-user TPS answer different questions.
- Concurrency is the number of overlapping in-flight requests, not requests per second. It can include queued requests, depending on the definition.
- A performance claim should always include the workload, concurrency, timing boundaries, and exact metric definitions.
Next, you will use the memory calculations from the first lessons together with these workload concepts to select an open-weight model and quantization that fit a specific memory budget.
Can't find a good explanation? Sign up and we'll make it for you
Sign up