Hello! Welcome to your next lesson in the "Portfolio Management and Value Creation" module.
In our last session, we defined the essential KPIs and reporting standards for monitoring the health of your portfolio companies. We covered what data to track—from financial metrics like runway and burn rate to customer metrics like LTV:CAC—and established that quarterly reporting is the industry standard.
Now that you know what information you need, today's lesson will focus on building the system to manage it. Our learning outcome is to design a process for collecting, analyzing, and acting on portfolio performance data.
For you, as a future solo-led incubator manager, creating an efficient and scalable process is not just good practice—it's essential for survival. A robust system will be your co-pilot, helping you manage your time effectively, identify which founders need your help most, and make data-driven decisions. We will design this process in three distinct stages: Collection, Analysis, and Action.
1. The Collection Process: Building Your Data Pipeline
The first step is to create a reliable and founder-friendly pipeline for gathering data. The goal is to get consistent, high-quality information with minimal friction. This process begins the moment you invest.
Portfolio Data Collection Tips for VCs
To start, let's review some best practices for data collection from the venture capital firm Visible. This article provides highly practical, actionable tips on how to set up your collection process.
Please read the sections titled 'Set Reporting Expectations Early On,' 'When and How Often to Collect Portfolio Data,' and 'What Data to Collect from Portfolio Companies.' Pay close attention to the tips on cadence, keeping requests concise, and defining your metrics clearly.
Based on these best practices, we can break down the collection process into a few key design choices.
A. Setting Expectations and Cadence
As highlighted in the Visible.vc article, consistency is key. Your data collection process should be predictable for both you and your founders.
- Formalize Expectations: Don't rely on verbal agreements. Include your reporting requirements in a side letter or other investment documents. Outline what you'll be asking for (e.g., specific KPIs, qualitative updates) and how often.
- Establish a Predictable Cadence:
- Frequency: Quarterly reporting is the standard. It balances your need for timely information with the founder's need to focus on their business. Monthly is often too burdensome for pre-seed companies, while annually is too infrequent to spot problems early.
- Timing: Send your data requests at the same time each quarter (e.g., the first week after a quarter closes) with a clear due date (e.g., 2-3 weeks later). This predictability helps founders build it into their own operational rhythm.
B. Choosing Your Tools
Given your computer science background and goal of building a tech-enabled firm, you should avoid manual processes where possible.
- The Manual Approach (Not Recommended): Using spreadsheets and email chains is a common starting point for new investors. However, as the article from Affinity notes, this often leads to "aged" data, input errors, and a lack of real-time insights. It's a system that doesn't scale.
- The Platform Approach (Recommended): A modern venture capital CRM or portfolio management platform (like Affinity, Visible, Rundit, or Carta) is a much better solution. These tools allow you to:
- Automate Requests: Schedule and send standardized data requests to all your companies automatically.
- Centralize Data: Create a single source of truth for all your portfolio data, eliminating scattered spreadsheets.
- Ensure Consistency: Use templates to ensure every company provides data in the same format, making analysis much easier.
This directly aligns with your goal of using technology for operational efficiency. Investing in a platform early on will save you significant time and effort as your portfolio grows.
C. Designing the Data Request
The Visible.vc article emphasizes a "less is more" approach. A bloated, confusing request form is the fastest way to get low-quality or incomplete data.
Your quarterly request template should have two parts:
-
Quantitative Metrics (5-15 KPIs):
- Stick to the essential KPIs we covered in the last lesson (e.g., MRR, Cash Balance, Net Burn, Runway, CAC, LTV, Headcount).
- For each metric, provide a clear, concise definition. For example, when asking for "Net Burn," specify whether it should include or exclude financing activities and if it should be the prior month's burn or a trailing 3-month average. This prevents ambiguity and ensures you're comparing apples to apples.
-
Qualitative Questions (3-4 Questions):
- Highlights/Wins: What went well last quarter? (product, team, sales)
- Lowlights/Challenges: What are your biggest hurdles right now?
- Key Goals for Next Quarter: What are the top 1-2 priorities?
- Asks: Where do you need help? Be specific about how you can help (e.g., intros to customers, recruiting support, strategic advice).
This combination provides the raw numbers and the crucial narrative context behind them.
2. The Analysis Phase: Turning Data into Insights
Once the data is collected and centralized in your platform, the next step is analysis. The goal is to quickly identify trends, spot outliers, and understand the overall health of your portfolio.
The ultimate guide to portfolio management for VC firms
The article 'The ultimate guide to portfolio management for VC firms' from Affinity explains why this analysis is so critical and introduces the role of technology in enabling it.
Please read the section 'Analyzing Key Performance Indicators (KPIs) and metrics' to understand the goal of this phase. Then, read 'Role of technology in portfolio management' to see how modern tools, including AI, are used to generate insights.
A. Visualizing Performance with Dashboards
Your portfolio management platform should allow you to create dashboards that visualize performance at both the individual company and portfolio level.
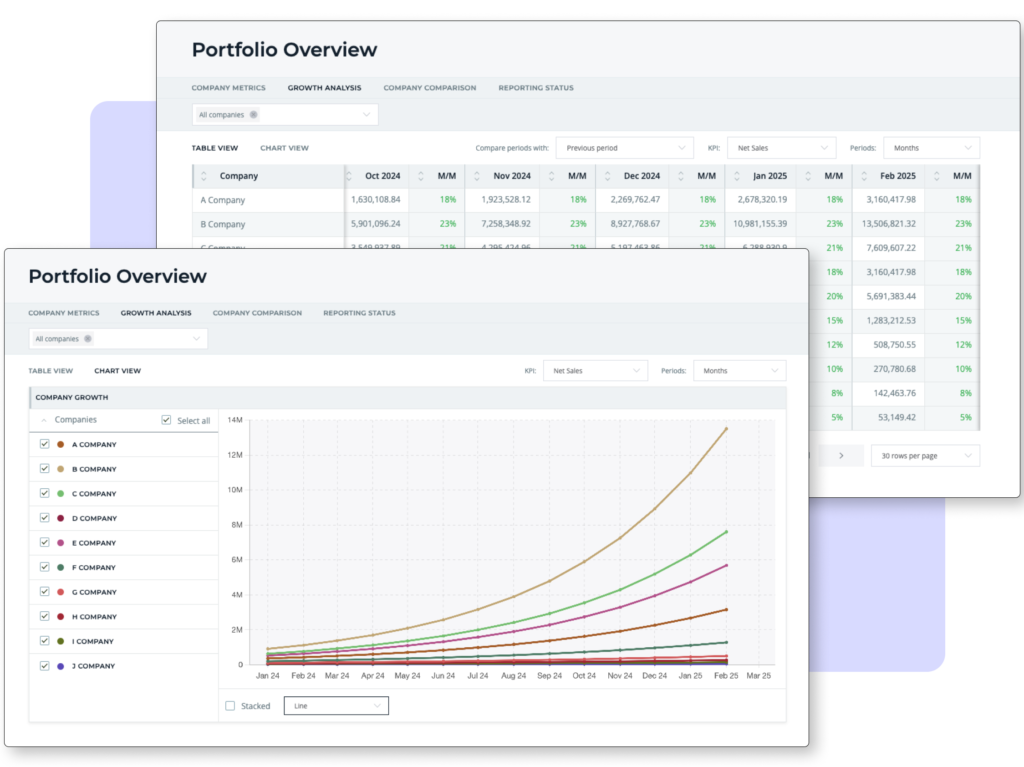
Your dashboard should help you answer key questions at a glance:
- Which companies are growing the fastest?
- Which companies have a critically short runway (e.g., less than 6 months)?
- Are there negative trends in key metrics like churn or CAC across the portfolio?
B. Identifying Signals: Red Flags and Green Shoots
Your analysis should be focused on identifying signals that require your attention.
-
Red Flags (Signals for Intervention):
- Shortening Runway: A runway under 6 months is an urgent signal to discuss fundraising or cost-cutting.
- Negative Unit Economics: A sustained LTV:CAC ratio below 1 means the company is losing money on every new customer.
- High or Increasing Churn: This indicates a problem with product-market fit or customer satisfaction.
- Stagnant Growth: Flat revenue for multiple quarters in an early-stage company is a major concern.
- Qualitative Alarms: The founder consistently reports team issues, product delays, or an inability to close customers.
-
Green Shoots (Signals for Acceleration):
- Strong, Accelerating Growth: Consistent high MoM growth is the clearest positive signal.
- Net Negative Churn: The company is generating more revenue from existing customers (through upgrades and expansion) than it's losing from cancellations. This is a powerful indicator of a strong product.
- Efficient Paid Acquisition: A low and stable Paid CAC means the company has found a scalable growth engine.
C. Leveraging AI for Deeper Analysis
As the Affinity article mentions, modern platforms are increasingly using AI and machine learning to augment this analysis. For your AI-focused accelerator, this is a key capability to leverage. AI can help you:
- Perform Anomaly Detection: Automatically flag a company whose burn rate suddenly deviates from its historical trend.
- Generate Forecasts: Project a company's future runway based on current revenue and burn trends.
- Benchmark Performance: Compare a portfolio company's growth rate against an anonymized, aggregated dataset of thousands of similar companies.
This allows you to move from simply reviewing data to proactively identifying risks and opportunities before they become obvious.
3. The Action Phase: From Insight to Value-Add
Collecting and analyzing data is meaningless unless it leads to action. This is where you transition from being a passive monitor to an active, value-add partner.
A. Triage and Prioritize Your Efforts
As a solo GP, your time is your most valuable asset. You must prioritize it. Based on your analysis, you can categorize your companies to guide your actions:
- Accelerate (Green Shoots): These are your winners. The goal is to pour gas on the fire. Your actions might include making introductions to top-tier follow-on VCs, helping them recruit key senior hires, or facilitating strategic partnership discussions.
- Monitor (On Track): These companies are performing as expected. They require standard support: regular check-ins, being a sounding board, and fulfilling their specific "asks" from the quarterly report.
- Intervene (Red Flags): These companies require immediate and focused attention. Your first step is a deep-dive conversation to diagnose the root cause of the problem. Is the high burn due to a one-time expense or a structural issue? Is the high churn caused by a recent product bug or a fundamental value proposition gap? Your action is to help the founder diagnose the problem and build a plan to fix it.
B. The Internal Portfolio Review
To ensure you act on these insights systematically, you need to schedule time for it. This is typically done through a formal Internal Portfolio Review.
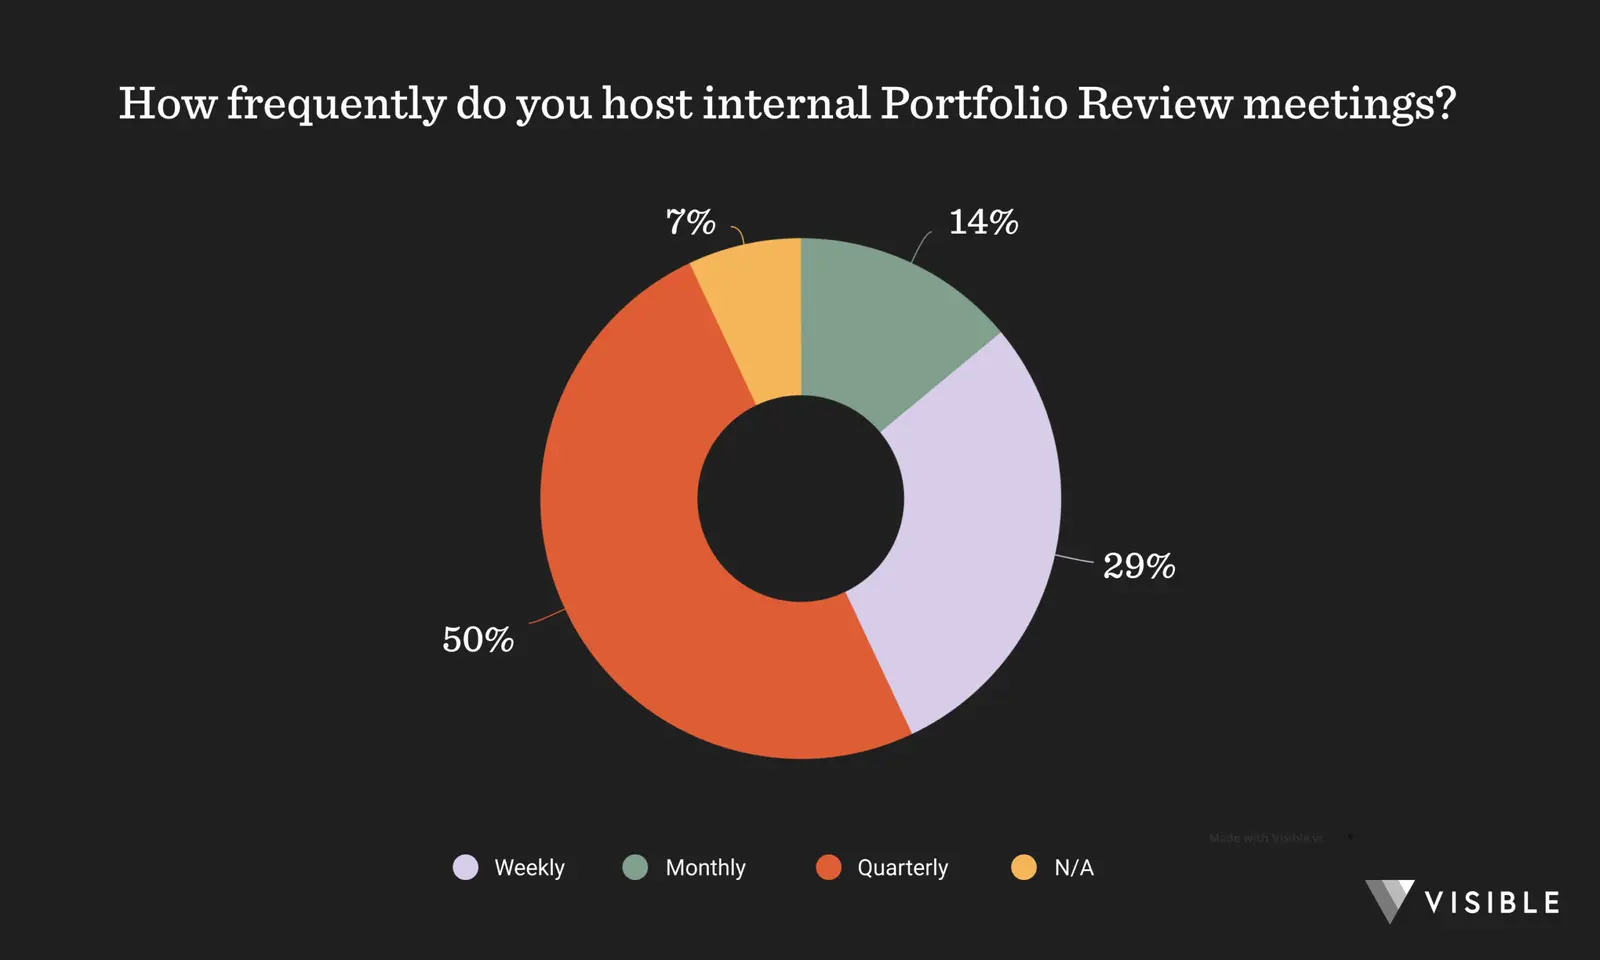
During your quarterly review, you should:
- Go through each company one by one.
- Review their KPIs against their goals and industry benchmarks.
- Update their status (Accelerate, Monitor, Intervene).
- Define a clear set of action items for yourself for the upcoming quarter for each company.
C. Closing the Loop with Founders
Finally, the process comes full circle. Use the insights from your analysis to have more meaningful, data-informed conversations with your founders. Instead of asking "How are things going?", you can say:
"I saw your MRR growth was flat last quarter, but your new user sign-ups are accelerating. It looks like you have a conversion problem, not a top-of-funnel problem. Let's brainstorm some experiments to improve your trial-to-paid conversion rate."
This demonstrates that you're paying attention, understand their business deeply, and can provide targeted, strategic value. This is how you build a reputation as a top-tier investor.
Test your understanding!
A pre-seed SaaS company in your portfolio submits its quarterly report with the following data:
- MRR: $15k (up from $14k last quarter)
- Runway: 4 months
- LTV:CAC Ratio: 4:1
- Qualitative Update: "We're struggling to hire a senior engineer, which is delaying our product roadmap. We need help with sourcing candidates."
Based on the 3-stage process (Collect, Analyze, Act), what is your analysis and what would be your primary action?
Show answer
-
Analysis:
- Red Flag: The 4-month runway is a critical issue. The company is in immediate danger of running out of cash.
- Red Flag: MRR growth is slow (~7% QoQ), which is concerning for a company at this stage.
- Green Shoot: The LTV:CAC ratio of 4:1 is very healthy, indicating the fundamental business model is sound. They have an efficient growth engine.
- Diagnosis: The primary bottleneck appears to be the hiring challenge, which is impacting product development and likely constraining growth. The core problem is operational and financial, not a lack of product-market fit.
-
Action:
- This company falls into the "Intervene" category due to the critical runway issue.
- Primary Action: Immediately schedule a meeting with the founder to create a plan for the runway. This involves two parallel paths:
- Extend Runway: Explore ways to cut non-essential costs to extend the runway beyond 4 months.
- Start Fundraising: Given the healthy unit economics (4:1 LTV:CAC), they have a strong story for a seed round. Your immediate priority is to help them prepare their narrative and start making introductions to your network of seed-stage investors.
- Secondary Action: Address their "ask" by leveraging your network to help source senior engineering candidates. Solving this bottleneck is key to unlocking future growth.
Conclusion
You have now designed a complete, three-stage operational process for managing your portfolio. This system turns raw data into actionable intelligence, enabling you to be a more effective and efficient investor.
Key Takeaways:
- Build a Process, Not a Task List: A successful portfolio management strategy is a repeatable system of Collection (standardized, automated), Analysis (dashboard-driven, AI-augmented), and Action (triaged, value-additive).
- Technology is Your Leverage: As a solo GP, using portfolio management platforms is crucial for automating collection and centralizing data, freeing up your time for high-value analysis and founder support.
- Be Founder-Friendly: A "less is more" approach to data requests, combined with clear definitions and a predictable cadence, respects founders' time and leads to higher-quality data.
- The Goal is Action: The entire purpose of this process is to identify where you can best deploy your time and resources to help your companies succeed.
Preview of the Next Lesson
We've built the system to identify which companies need help and why. But what does that help look like in practice? In our next lesson, we will establish a structured framework for regular founder coaching and performance check-ins, diving into the "how" of providing direct, hands-on support to your portfolio.