
Hello! Welcome back to our final lesson in the "Sales Funnels & Conversion Analytics" module.
In our last lesson, we dove into Customer Acquisition Cost (CAC), giving you a clear picture of the total cost to acquire a new customer through a specific channel. This is a crucial strategic metric for understanding the long-term health of your business model.
Today, we shift our focus from the broad cost of acquisition to the immediate efficiency of your advertising. We will tackle the learning outcome: Calculate Return on Ad Spend (ROAS) for a paid campaign to evaluate profitability.
While CAC tells you if your overall growth engine is sustainable, ROAS gives you the tactical, real-time feedback needed to manage your ad campaigns day-to-day. It answers a simple, powerful question: for every dollar I put into this ad campaign, how many dollars in revenue am I getting back right now? As a founder aiming to rapidly scale multiple SaaS companies, mastering ROAS is essential for making quick, data-driven decisions that protect your cash flow and maximize marketing impact.
What is Return on Ad Spend (ROAS)?
Return on Ad Spend (ROAS) is a marketing metric that measures the amount of revenue generated for every dollar spent on an advertising campaign. It's a direct measure of an ad campaign's effectiveness.
The formula is refreshingly simple:
ROAS is typically expressed either as a ratio (e.g., 4:1, meaning $4 in revenue for every $1 spent) or as a percentage (e.g., 400%).
What is ROAS? Advertising and Marketing ROAS Explained for Beginners
To start, let's watch a quick video from Surfside PPC that clearly defines ROAS, presents the formula, and walks through a basic calculation. This will give us a solid foundation.
Please watch the first 1 minute and 18 seconds of the video (00:00 - 01:18). Pay close attention to: The definition of ROAS. The formula: Revenue / Ad Spend. How the result is typically presented as a percentage.
ROAS vs. ROI: The Magnifying Glass and the Wide-Angle Lens
It is absolutely critical to understand the difference between ROAS and Return on Investment (ROI). Confusing them can lead to dangerously flawed business decisions.
- ROAS is a tactical metric. It measures the gross revenue generated from a specific ad campaign against its direct ad cost.
- ROI is a strategic metric. It measures the net profit from an entire business initiative against its total investment, which includes ad spend, salaries, software costs, and other overhead.
Think of it this way: ROAS is a magnifying glass you use to inspect the performance of a single ad. ROI is the wide-angle lens you use to assess the profitability of your entire marketing strategy.
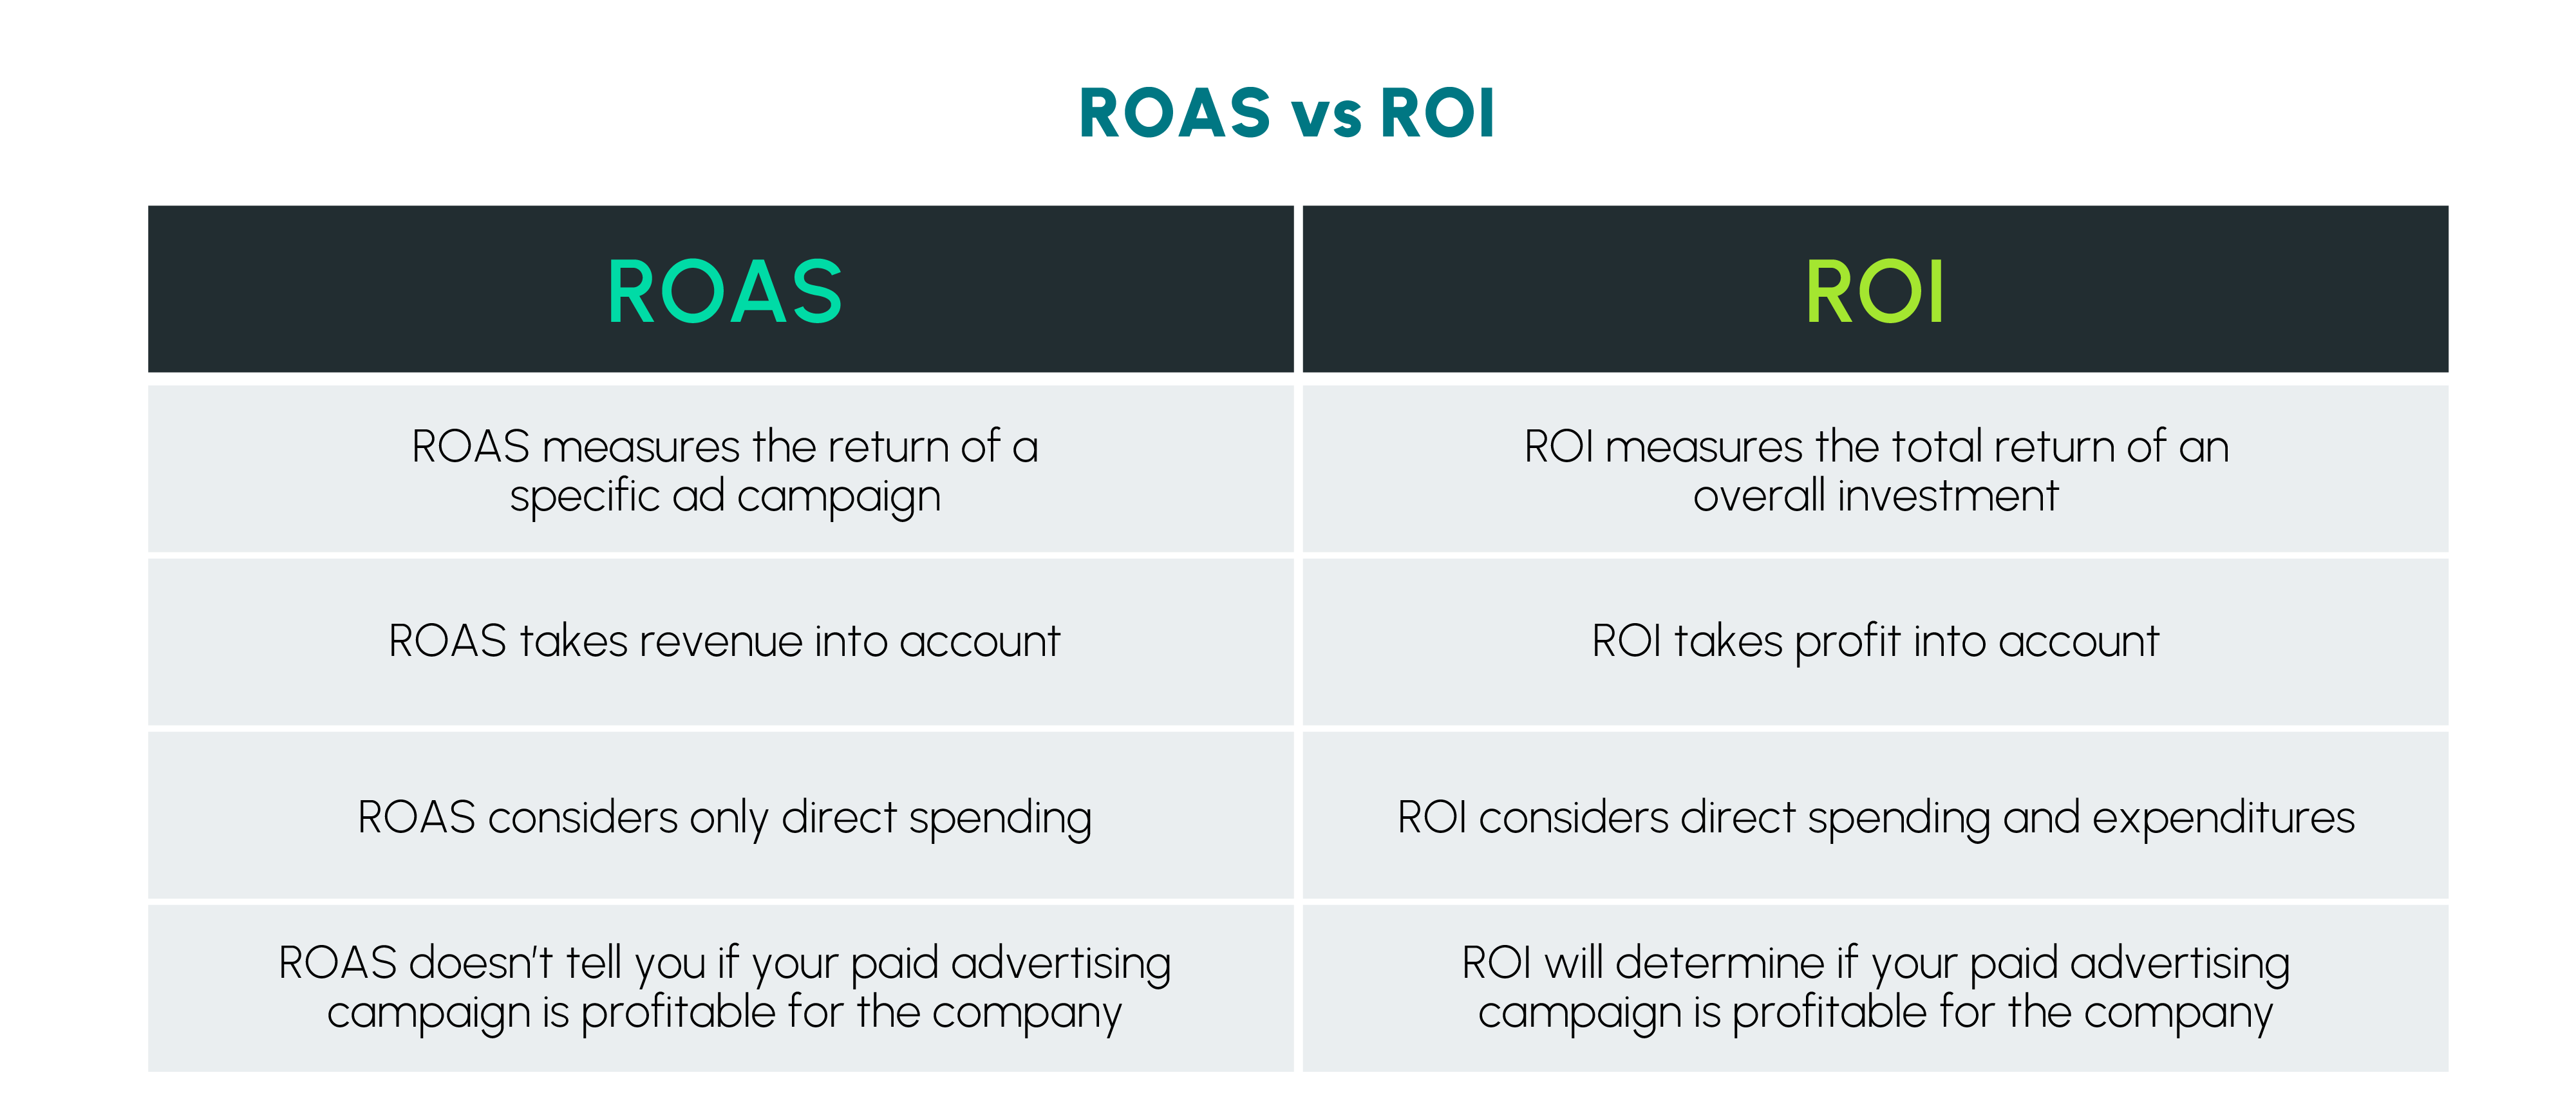
A high ROAS can create an illusion of success. You might have a 4:1 ROAS on a campaign, but if your other business costs are high, your overall ROI could be negative, meaning the business is losing money.
A ROAS vs ROI Guide to Profitable SaaS Growth
To fully grasp this crucial distinction, please read a section from the article 'A ROAS vs ROI Guide to Profitable SaaS Growth' by Proven SaaS. It contains an excellent example that illustrates this 'profitability illusion'.
Read the section titled 'The Hidden Danger of Chasing a High ROAS'. Focus on the example where a 4:1 ROAS actually results in a negative 11.1% ROI once all business costs are factored in. This is a scenario every founder needs to be wary of.
How to Calculate ROAS for a SaaS Campaign
Let's walk through a practical example for a SaaS business running a Google Ads campaign.
Scenario:
- Channel: Google Ads
- Time Period: May
- SaaS Product: A project management tool with a $50/month subscription plan.
Step 1: Identify Total Ad Cost
Log in to your Google Ads dashboard and find the total spend for the campaign in May.
- Ad Spend for May = $3,000
Step 2: Identify Revenue Attributed to the Campaign
This is where it gets nuanced for a SaaS business. You need to decide on a consistent timeframe for the revenue you'll attribute to the new sign-ups. Using the full Customer Lifetime Value (LTV) can be misleading for short-term campaign analysis. A common approach is to use the revenue from the first month or a 3-month period.
Let's use the first month's revenue for this example.
-
Go to your Google Analytics 4 report (
Reports > Acquisition > Traffic acquisition). -
Filter for
Paid Searchand the month of May. -
Find the number of
subscription_startedconversions.- New Customers from Google Ads in May = 80
-
Calculate the revenue from these new customers for the defined timeframe (one month).
- Revenue from Ads = 80 customers * $50/month = $4,000
Step 3: Apply the ROAS Formula
Now, plug the numbers into the formula:
This can be expressed as a 1.33:1 ROAS or 133%. This means for every $1 you spent on Google Ads in May, you generated $1.33 in initial revenue.
What is a "Good" ROAS? The Power of Break-Even ROAS
Is a 1.33:1 ROAS good? The answer depends entirely on your profit margins. A common benchmark is to aim for a 4:1 ROAS, but this is just a rule of thumb.
A more powerful concept is Break-Even ROAS. This is the ROAS you need to achieve to cover not just your ad spend, but also the cost of the goods or services you sold. At your break-even ROAS, you are neither making nor losing money on the transaction.
The formula is:
Let's calculate this for our SaaS example:
- Price: $50/month
- Cost of Goods Sold (COGS): This includes costs to serve the customer, like server hosting, third-party API fees, and a portion of customer support. Let's say your COGS per customer is $15/month.
- Profit: $50 (Price) - $15 (COGS) = $35
- Profit Margin: $35 (Profit) / $50 (Price) = 0.7 or 70%
Now, calculate the Break-Even ROAS:
Your break-even ROAS is 1.43:1. This means you must generate at least $1.43 for every $1 in ad spend just to cover your costs.
Our campaign's ROAS was 1.33:1, which is below our break-even point of 1.43:1. This campaign is currently losing money. This insight is invaluable for making immediate decisions, such as optimizing the ad campaign or re-evaluating pricing.
How To Quickly Calculate Your Break-Even ROAS | Facebook Ads & Ecommerce
The concept of Break-Even ROAS is a tactical superpower. This video from Nick Theriot provides a fantastic walkthrough of how to calculate it, though his example is for e-commerce, the principle is identical.
Watch the section from 02:28 to 05:25. Focus on: How he calculates Profit Margin (Sale Price - Cost of Goods) / Sale Price. (02:28 - 04:08) The formula for Break-Even ROAS: 1 / Profit Margin. (04:08 - 04:41) How this number becomes a clear target for whether your campaigns are profitable and need optimization. (04:41 - 05:25)
Test your understanding!
You are running a Meta Ads campaign for a different SaaS product. Here are the numbers for June:
- Meta Ads spend: $5,000
- New customers acquired: 50
- Product price: $200/month
- Cost of Goods Sold (COGS) per customer: $80/month
- What is the campaign's ROAS for the first month?
- What is the Break-Even ROAS?
- Based on these numbers, is the campaign profitable in its first month?
Show answer
-
Calculate ROAS:
- Revenue = 50 customers * $200 = $10,000
- ROAS = $10,000 (Revenue) / $5,000 (Ad Spend) = 2:1
-
Calculate Break-Even ROAS:
- Profit = $200 (Price) - $80 (COGS) = $120
- Profit Margin = $120 / $200 = 0.6 or 60%
- Break-Even ROAS = 1 / 0.6 = 1.67:1
-
Is it profitable?
- Yes. The campaign's ROAS of 2:1 is higher than the break-even ROAS of 1.67:1. For every dollar spent, the campaign is covering its costs and generating profit.
Where to Find ROAS in Your Ad Platforms
Most modern ad platforms calculate a form of ROAS for you, provided you have conversion tracking with values set up correctly.
- Google Ads: In your campaign view, you can add a column called "Conv. value / cost". This is Google's direct calculation of ROAS.
- Meta (Facebook) Ads: In Ads Manager, you can customize your columns to add the "Website Purchase ROAS (Return on Ad Spend)" metric.
For this to work, you must be passing conversion value data back to the platforms, not just the conversion count. This is typically done when you set up your conversion tracking pixel or event.
Conclusion
You have now added another essential financial metric to your analytics toolkit. By calculating ROAS, you can evaluate the immediate effectiveness of your ad campaigns and make rapid optimizations to improve profitability.
Key Takeaways:
- ROAS measures the gross revenue generated per dollar of ad spend and is a key tactical metric for campaign management.
- ROAS is not ROI. A high ROAS can hide a money-losing business if overall costs (salaries, overhead) are not considered.
- For SaaS, you must define a consistent revenue timeframe (e.g., first month's revenue) to calculate a meaningful ROAS for campaign optimization.
- Break-Even ROAS (1 / Profit Margin) is your true profitability threshold for ad spend, telling you the exact return needed to cover your costs.
Preview of the Next Lesson:
This lesson concludes our module on Sales Funnels and Conversion Analytics. We have covered setting up dashboards, calculating the strategic cost to acquire customers (CAC), and now the tactical return from ads (ROAS).
In our next lesson, we will begin a new module, "Video Production & Repurposing," and kick it off by learning how to Analyze a user behavior flow in Google Analytics 4 or Mixpanel to identify drop-off points in the conversion funnel. Wait, that's not right. The next learning outcome is actually from Module 7, lesson 8: "Analyze video performance metrics (e.g., retention, CTR) using YouTube Studio and platform-native analytics." My apologies for the mix-up in the course plan. So, in the next lesson, we will focus on analyzing video performance. This bridges our analytics focus with the upcoming content on video creation, helping you understand what makes a video successful before you start producing your own.