
Hello! Welcome to the final lesson of the course.
Throughout this module, we've focused on the critical metrics that measure the health of your sales and marketing efforts. We started with Customer Acquisition Cost (CAC) to understand the strategic cost of gaining a new customer, then moved to Return on Ad Spend (ROAS) to measure the tactical efficiency of your ad campaigns. These metrics tell you if your funnel is working from a financial perspective.
Today, we'll answer the crucial follow-up question: where and why isn't it working perfectly? We will address the final learning outcome of the course: Analyze a user behavior flow in Google Analytics 4 or Mixpanel to identify drop-off points in the conversion funnel.
This lesson will equip you to become a detective for your user's journey. You'll learn how to visualize the paths users take, pinpoint the exact spots where they get stuck or leave, and use that data to make targeted improvements. For a founder aiming to rapidly scale SaaS products, this skill is fundamental for turning leaky buckets into high-conversion machines.
The "Why" Behind Funnel Analysis
A conversion funnel is the ideal, step-by-step path you want a user to take to achieve a specific goal, such as signing up for a trial, completing onboarding, or upgrading to a paid plan. However, no funnel is perfect. Users will inevitably "drop off" between steps. Your job is to minimize these leaks.
For a SaaS business, we can think of two primary types of funnels, which are best served by two different types of tools:
- The Marketing Funnel (pre-signup): This tracks the journey from initial awareness (e.g., clicking an ad) to becoming a user (e.g., completing the sign-up form). This is the domain of web analytics tools like Google Analytics 4.
- The Product Funnel (in-app): This tracks the user's journey inside your product, from signup to activation (experiencing the core value), engagement, and monetization. This is where product analytics tools like Mixpanel shine.
The Guide to Product Analytics - Chapter 4
Before we dive into the tools, it's helpful to frame this analysis around a core concept: the difference between the user getting value and you getting paid. The Mixpanel guide on product analytics has an excellent explanation.
Please read the first three sections of this chapter, down to the heading 'Should B2B and B2C companies measure drop off...'. Focus on understanding the distinction between the 'value moment' (when the user gets value) and the 'value exchange' (when you get paid). Identifying drop-offs before the user experiences value is your most critical task.
Finding Leaks in Your Marketing Funnel with GA4
Google Analytics 4 (GA4) is your go-to tool for understanding how users navigate your website before they sign up. The Funnel Exploration report is specifically designed for this.
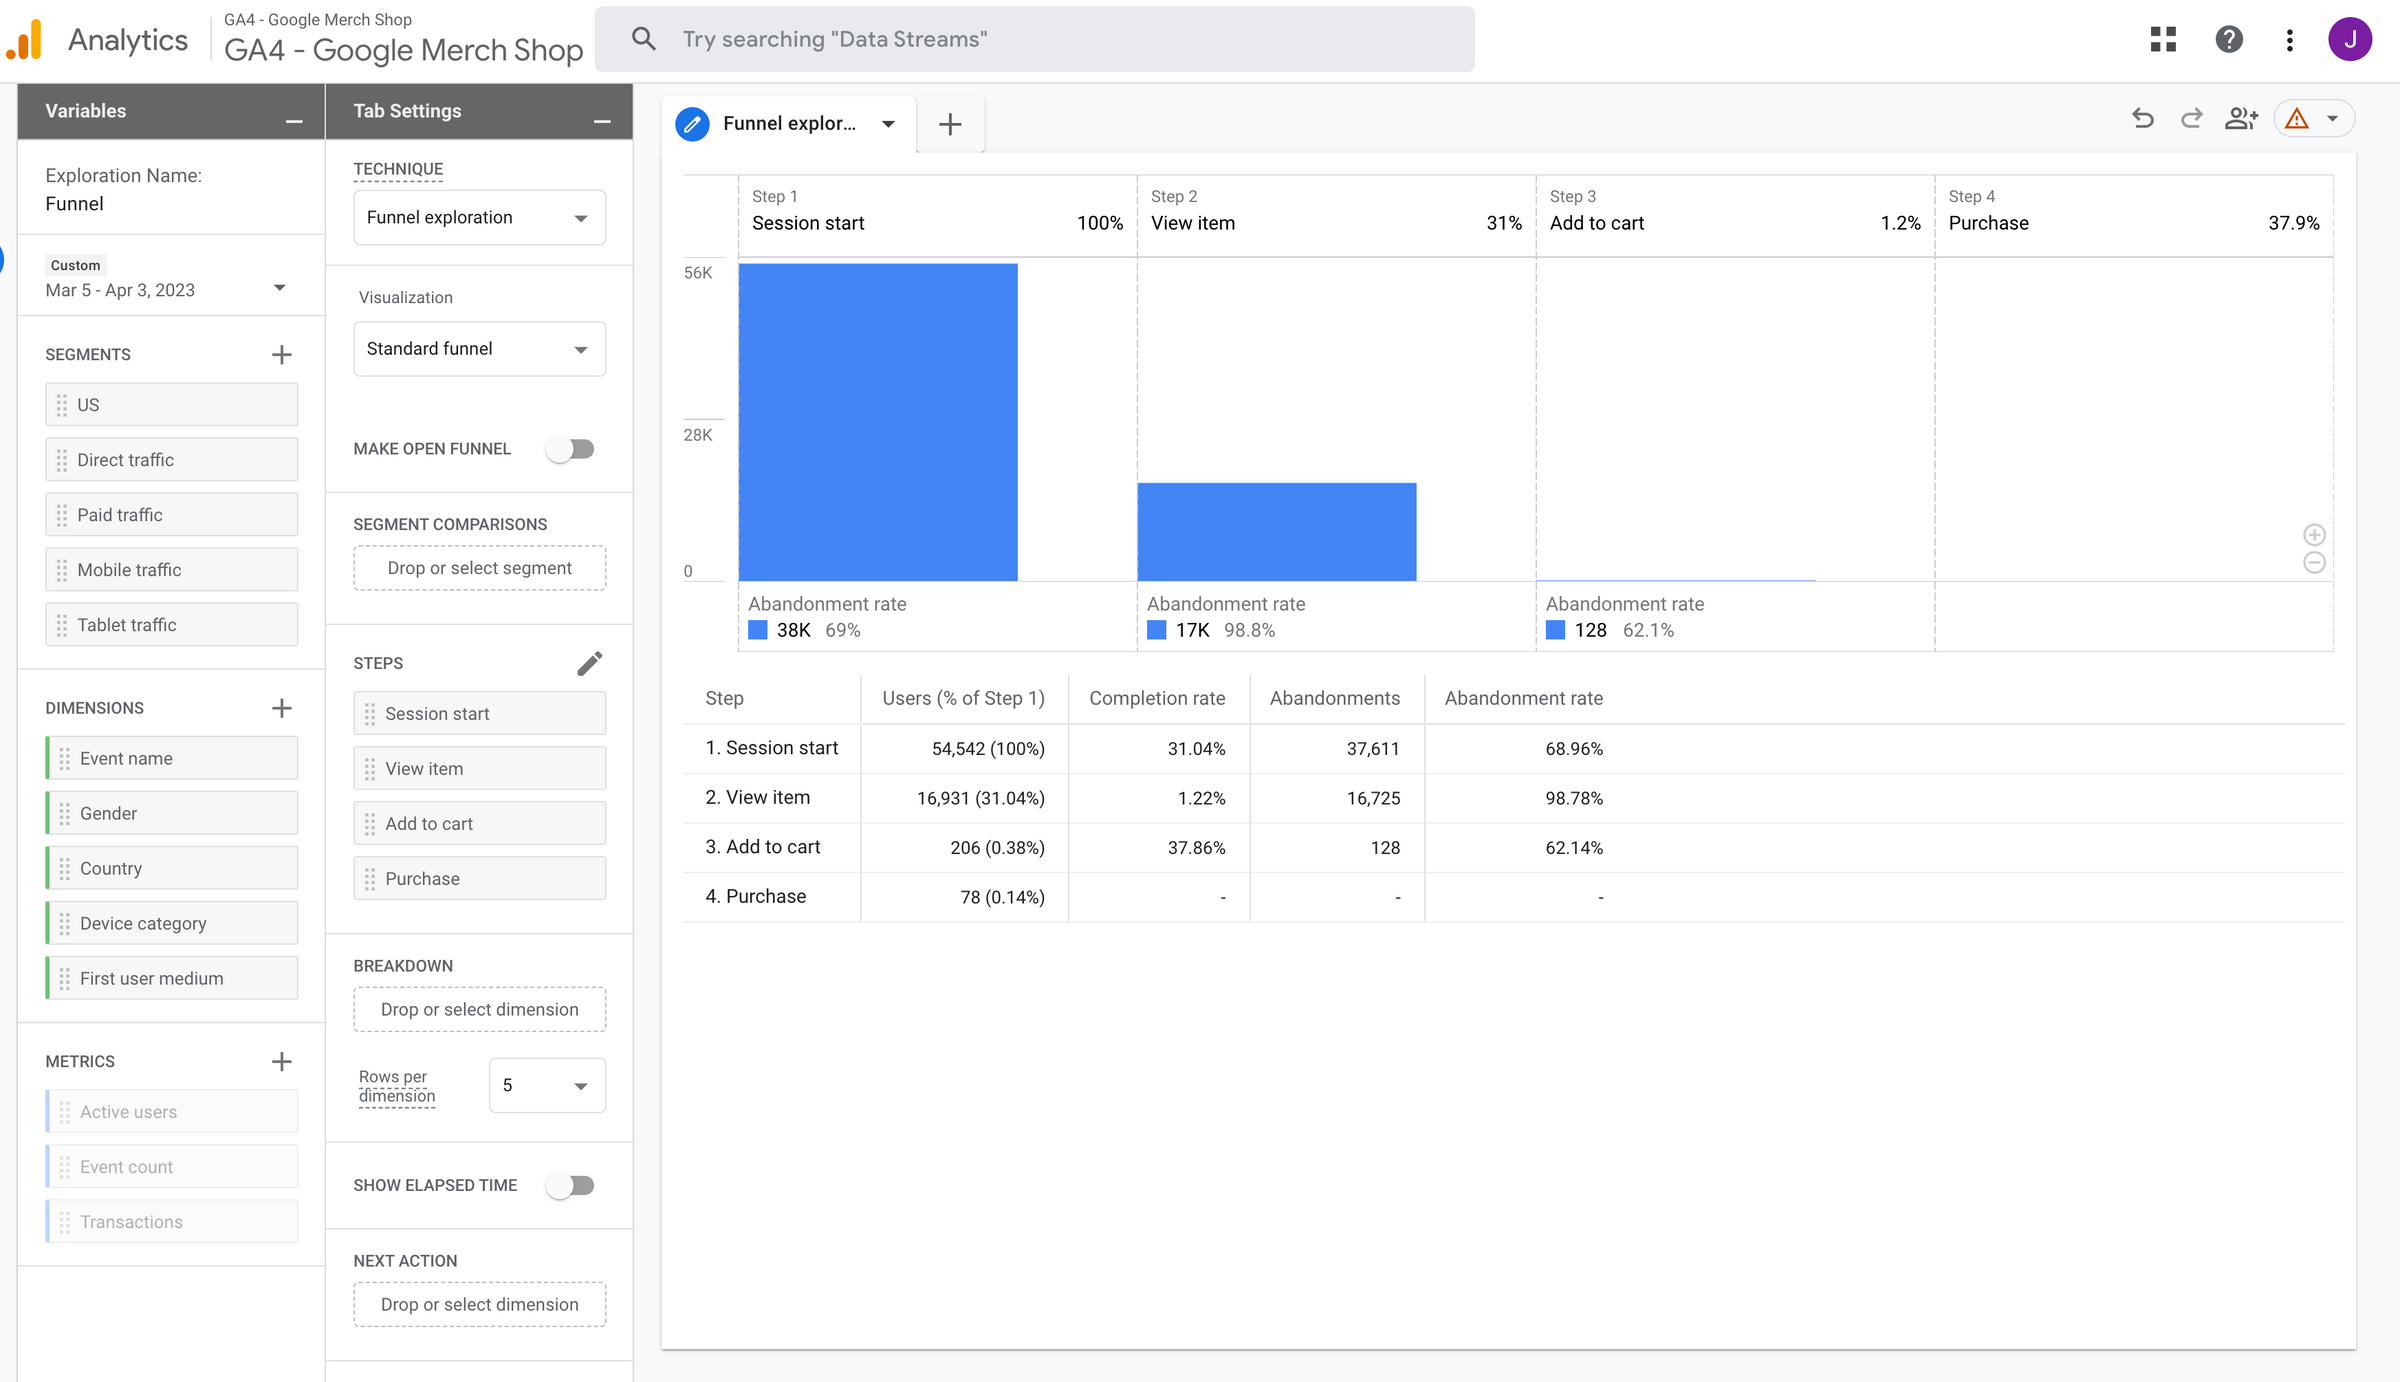
Let's walk through how to build and interpret one of these reports.
Funnel exploration in Google Analytics 4 | Funnel reports in GA4
The best way to learn is by seeing it in action. This video from Analytics Mania provides a clear, concise walkthrough of building a funnel report in GA4. We'll watch it in a few key parts.
First, watch from 00:37 to 04:38. This will show you: How to navigate to the 'Funnel exploration' report (00:37 - 00:57). How to build a custom funnel by adding events as steps, using an e-commerce example (view_item -> add_to_cart -> begin_checkout -> purchase). For a SaaS, your events might be view_pricing_page -> click_signup_button -> complete_signup_form (01:28 - 04:38).
Interpreting the GA4 Funnel Report
Once you've built your funnel, the analysis begins. You're looking for the biggest leaks.
- Identify the Largest Drop-Off: The report shows both the percentage and the absolute number of users who drop off at each step. A 50% drop-off of 10,000 users is a much higher priority than a 90% drop-off of 100 users. Focus on the largest absolute numbers first.
- Use Breakdowns to Find the "Why": A high drop-off rate is a symptom. The
Breakdowndimension in GA4 is your primary tool for diagnosis. By adding a breakdown, you can segment the funnel data to see if the drop-off is concentrated in a specific group. Common breakdowns include:- Device Category: Are mobile users dropping off more than desktop users? This could signal a poor mobile UX.
- Source / Medium: Does traffic from a specific campaign (e.g.,
facebook / cpc) drop off more? This might indicate a mismatch between your ad copy and your landing page. - Country: Are users from a specific region struggling? Perhaps there's a language or currency issue.
Funnel exploration in Google Analytics 4 | Funnel reports in GA4
Let's return to the Analytics Mania video to see how to read the report and use breakdowns.
Now, watch two more short clips from the same video: Reading the Report (04:38 - 05:52): This part shows how to interpret the visualization, identify the number of users dropping off, and even create a segment of those users for retargeting. Using Breakdowns (07:10 - 07:49): This demonstrates how adding the 'Device category' breakdown immediately reveals that mobile users are abandoning the funnel at a much higher rate.
Open vs. Closed Funnels: A Key Distinction
GA4 gives you the option of making your funnel "open" or "closed." This is a crucial setting that affects how users are counted.
- Closed Funnel (Default): A user must enter at Step 1 and proceed sequentially. They cannot skip steps. This is best for analyzing strict, linear processes like a checkout flow.
- Open Funnel: A user can enter the funnel at any step. For example, if a user clicks a link in an email that takes them directly to the checkout page (skipping the product and cart pages), an open funnel will count them starting at the 'checkout' step.
Funnel exploration in Google Analytics 4 | Funnel reports in GA4
Understanding this difference is vital for accurate analysis. The Analytics Mania video has an excellent, detailed explanation with diagrams that makes this concept very clear.
Please watch the segment from 10:11 to 14:25. Pay close attention to the visual examples of how user counts change between open and closed funnels based on the same user behavior.
Peering Inside Your Product with Mixpanel
While GA4 is great for the marketing site, Mixpanel is built to analyze what happens after a user signs up. It helps you answer questions like: "How many users who signed up actually completed the onboarding tutorial?" or "What percentage of users who created their first project invited a teammate?"

Step 0: The Tracking Plan
Before you can analyze anything in Mixpanel, you need data. And before you collect data, you need a plan. Given your computer science background, you'll appreciate this: a tracking plan is like a schema for your analytics. It's a document (often a spreadsheet) where you define every user action (event) and piece of context (property) you want to track.
For example:
- Event:
Project Created- Properties:
Project Template(e.g., 'Kanban', 'Blank'),Team Size(e.g., '1', '2-5'),Plan Type(e.g., 'Free', 'Pro')
- Properties:
Creating a tracking plan before writing any code ensures your data is clean, consistent, and easy for your whole team to understand.
Mixpanel Tutorial: Everything You Need to Know in 2025
The following video is a comprehensive Mixpanel tutorial. We'll start with the section on creating a tracking plan, as it's the most critical foundational step.
Please watch from 15:17 to 25:01. This is a bit longer, but it's a masterclass in how to think about analytics implementation. Focus on: The concept of listing all user actions as events. Adding context with event properties. Defining user properties (traits about the user, like their subscription plan). The importance of a consistent and obvious naming convention.
Building and Analyzing Funnels in Mixpanel
Once your tracking is implemented, building funnels in Mixpanel is straightforward. You simply select the events from your tracking plan in the order they should occur.
Mixpanel Tutorial: Everything You Need to Know in 2025
Now let's see how to use that well-structured data to build a funnel in Mixpanel.
Watch the segment from 42:45 to 49:23. The presenter builds a checkout funnel, but the principles are universal. Pay attention to: How easily you can add or remove steps. The concept of a conversion window (e.g., users must complete the funnel within 1 day). How to break down the funnel by event or user properties to find insights, similar to GA4.
From Data to Decisions
Identifying a drop-off is just the first step. The goal is to turn that observation into a business improvement.
-
Formulate a Hypothesis: The data tells you what is happening. You need to form a hypothesis about why.
- Observation: "We see a 70% drop-off between
click_signup_buttonandcomplete_signup_formon mobile." - Hypothesis: "We believe users are abandoning the signup form on mobile because it has too many fields and is difficult to complete on a small screen."
- Observation: "We see a 70% drop-off between
-
Gather More Evidence: Use qualitative tools to support your hypothesis. Tools like Hotjar or FullStory provide session recordings and heatmaps. Watching recordings of users who dropped off can give you the "aha!" moment, revealing their exact point of frustration.
-
Test Your Hypothesis: Run an A/B test to see if a change improves the conversion rate.
- Test: "Create a new version of the signup form with only 3 fields instead of 7. Show Version A (original) to 50% of mobile users and Version B (shortened) to the other 50%."
-
Create Retargeting Audiences: You can take immediate action on drop-offs by creating audiences for retargeting. Both GA4 and Mixpanel allow you to create a segment of users who, for example, started checkout but didn't purchase. You can then sync this audience to Google Ads or Meta Ads to show them a targeted message, like an offer for a small discount to complete their purchase.
How to Spot Conversion Drop-Offs Using GA4 Funnel ...
For a practical guide on this entire process—from reading the funnel to forming hypotheses and building retargeting audiences—this article from FunnelFreaks is excellent.
Please read the sections titled 'Read the Funnel Like a Pro', 'Build audiences from drop-offs...', and 'Diagnose common D2C drop-offs'. Although the examples are for e-commerce, the principles of diagnosing friction points and acting on them are directly applicable to SaaS.
Test your understanding!
You are analyzing the onboarding funnel for your new SaaS product in Mixpanel. You observe a large 60% drop-off between the "Create First Project" step and the "Invite Teammate" step. This is a critical step for user retention.
What are three distinct actions you could take to diagnose and address this drop-off?
Show answer
Here are three possible actions:
- Segment the Data (Quantitative Analysis): Use Mixpanel's breakdown feature. Is the drop-off higher for users on the 'Free' plan versus the 'Team' plan? Is it higher for users who signed up via a specific marketing campaign? This helps narrow down if the problem is universal or specific to a user group.
- Watch Session Recordings (Qualitative Analysis): Use a tool like FullStory or Hotjar to watch recordings of users who dropped off at this step. Do they even see the "Invite Teammate" button? Do they click around looking for it and give up? This provides visual context for why they are failing to convert.
- Form and Test a Hypothesis (Action): Based on the data, form a hypothesis. For example: "I believe users are not inviting teammates because the value isn't clear at that moment." Then, run an A/B test. For one group of new users, add a small tooltip next to the invite button that says, "Projects are better with friends! Invite your team to collaborate in real-time." Measure if this change increases the conversion rate for that step.
Conclusion and Course Wrap-up
Congratulations! You have not only completed this lesson but also the entire course. Today, you've learned how to dissect the user journey, a skill that bridges all the marketing, sales, and product development efforts we've discussed.
Key Takeaways from this Lesson:
- Funnel analysis is the process of identifying and fixing "leaks" in your user's journey toward a goal.
- GA4 is your tool for analyzing the marketing funnel (pre-signup), while Mixpanel is your tool for the product funnel (in-app).
- A rigorous tracking plan is the non-negotiable foundation for meaningful product analytics.
- The process is a continuous loop: Analyze data to find drop-offs -> Formulate a hypothesis about the cause -> Test a solution to see if it works.
Over the past eleven modules, you have built a comprehensive playbook for taking a SaaS idea from concept to scale. We started with Ideation and Market Validation, moved through Content Strategy, AI-powered Workflows, and Launch Tactics. We covered how to market across Social Media, Video, SEO, and Paid Ads, and how to convert that traffic on Landing Pages. Finally, we tied it all together with Analytics, learning to measure CAC, ROAS, and now, user flow.
You have a powerful combination of a technical background and a newly acquired, tactical go-to-market skillset. This is the exact formula needed to execute on your ambitious goal of building and scaling multiple SaaS companies.
Thank you for your dedication throughout this course. The journey of an entrepreneur is challenging but immensely rewarding. I wish you the very best of luck as you build your empire. Go build