
Hello! Welcome to your next lesson in the "Learn SQL for product designers" course.
Introduction
In our last lesson, we began our journey into Module 4: Calculating Core Product Metrics by mastering the COUNT() function. You learned how to count total rows, non-empty values, and, most importantly, unique users with COUNT(DISTINCT). This allowed you to answer "how many?" questions, like calculating Daily Active Users.
Today, we'll expand your analytical toolkit by learning the other essential aggregate functions: SUM(), AVG(), MIN(), and MAX(). By the end of this lesson, you'll be able to calculate crucial summary statistics that answer questions like:
- What was our total revenue last month? (
SUM) - What is the average time users spend on a feature? (
AVG) - What is the lowest rating a user has given? (
MIN) - Who is our most engaged user based on the maximum number of actions? (
MAX)
These functions are the bedrock of quantitative user behavior analysis and will empower you to derive deeper insights from your product data.
1. The Family of Aggregate Functions
COUNT() is part of a family of functions that summarize data. Let's get a quick overview of the main aggregate functions you'll use in SQL.
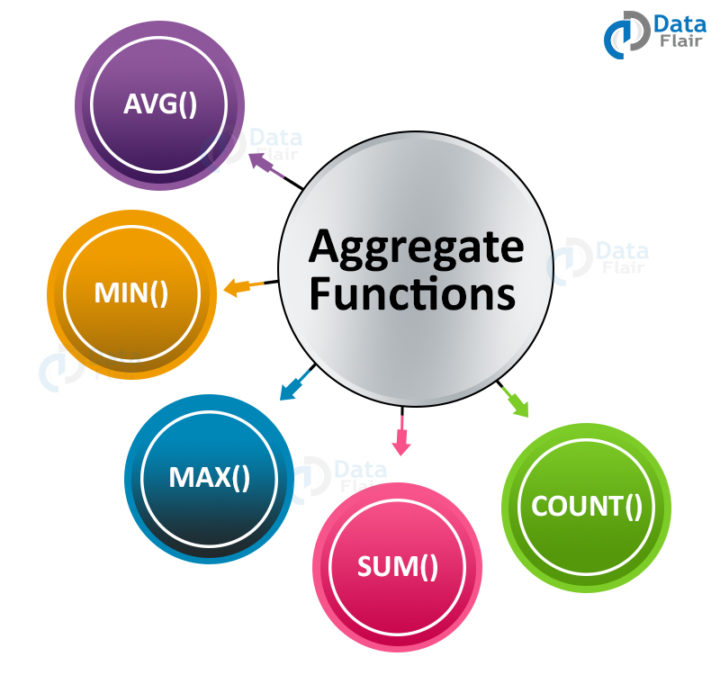
Today, we're focusing on the four functions that deal with numerical values to calculate totals, averages, and extremes.
2. Calculating Summary Statistics
To understand these functions, we'll use a practical scenario. Imagine you're a product designer at an e-commerce company like Amazon. You have a table called product_spend that logs customer transactions.
The following reading from DataLemur provides excellent, clear examples of each function using this exact scenario. It's a perfect fit for understanding how these functions apply in a product context.
SQL Aggregate Functions Tutorial With Practice Exercises
Please read the following sections from the "SQL Aggregate Functions Tutorial" on DataLemur. This will introduce you to SUM(), AVG(), MIN(), and MAX() with practical examples.
Read the sections titled "Calculating Total Sales with SQL SUM()", "Finding the Average Price with SQL AVG()", "Finding the Minimum with SQL MIN()", and "Discovering the Maximum Price with SQL MAX()". Focus on the query structure and how each function answers a different business question.
Key Syntax Summary
As you saw in the reading, the syntax is very consistent and straightforward. For a column named column_name in a table named table_name, the structure is:
- Total:
SELECT SUM(column_name) FROM table_name; - Average:
SELECT AVG(column_name) FROM table_name; - Lowest Value:
SELECT MIN(column_name) FROM table_name; - Highest Value:
SELECT MAX(column_name) FROM table_name;
Just like with COUNT(), you should always use AS to give your results a descriptive column name. For example:
SELECT AVG(spend) AS average_transaction_value
FROM product_spend;
3. Visual and Auditory Reinforcement
To complement the reading and cater to your preference for visual learning, the following video provides an excellent animated explanation of how these functions work, followed by a practical coding demonstration.
SQL Aggregate Functions | COUNT, SUM, AVG, MAX, MIN | #SQL Course 21
This video from Data with Baraa will help solidify your understanding. It first visualizes what each aggregate function does conceptually and then shows you how to write the queries.
Watch from 01:00 to 04:53. This covers the conceptual explanation and the practical SQL demonstration for SUM(), AVG(), MAX(), and MIN().
4. Applying the Functions to Product Insights
These functions are not just for calculating sales. They are incredibly versatile for understanding user behavior.
SUM(): You can calculate the total time a user has spent on the platform (SUM(session_duration)), or the total number of items added to a cart (SUM(items_in_cart)).AVG(): This is perfect for establishing benchmarks. What's the average number of searches before a user finds a result? What's the average time to complete onboarding? You can use this to measure the impact of a design change. For example, you could measureAVG(time_to_complete_checkout)before and after a redesign.
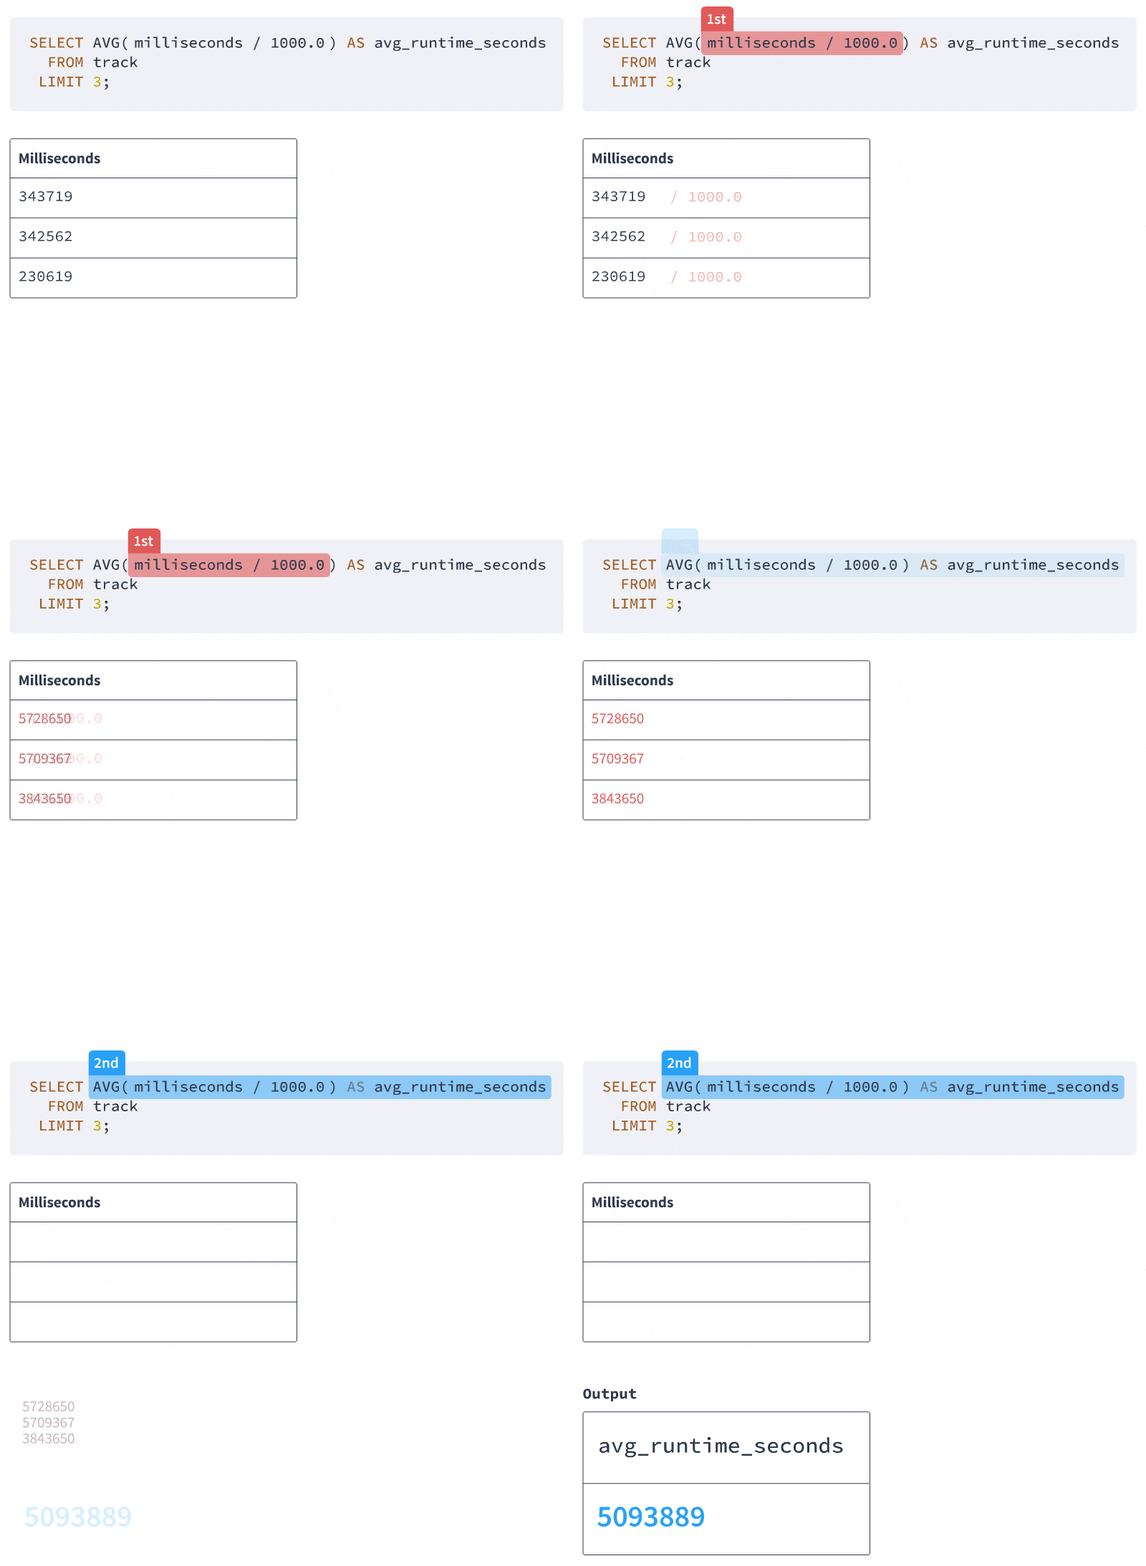
This GIF shows a great example of performing a calculation inside an aggregate function to get a more meaningful metric—in this case, converting milliseconds to seconds before calculating the average.
MIN()andMAX(): These are excellent for identifying outliers and understanding the range of user behavior.MIN(signup_date)can tell you when your very first user signed up.MAX(actions_per_day)can help you identify your "power users."MIN(customer_rating)can quickly surface the most negative product feedback.
The DataLemur article you read earlier has a great section on this. It's worth revisiting the "Real-World Scenarios" section to see how these functions directly map to the kinds of questions you'd explore as a product designer.
5. Practice: Answering Your Team's Questions
You are a product designer for a project management SaaS tool. Your team is analyzing user engagement data from a table called feature_usage, which has the following columns:
user_id(Integer)feature_name(Text, e.g., 'task_creation', 'report_generation', 'team_chat')usage_date(Date)time_spent_minutes(Integer)tasks_completed(Integer)
Your Product Manager comes to you with the following questions. Write one SQL query for each.
- What is the total number of tasks completed by all users on '2024-10-22'?
- What is the average time spent, in minutes, by users on the 'report_generation' feature?
- What is the longest time a single user has ever spent on any feature in one session?
- What is the earliest date we have any record of a user using the 'team_chat' feature?
Click to see the solutions
- Total tasks completed on a specific date:
SELECT SUM(tasks_completed) AS total_tasks_on_oct_22 FROM feature_usage WHERE usage_date = '2024-10-22'; - Average time spent on a specific feature:
SELECT AVG(time_spent_minutes) AS avg_time_on_reports FROM feature_usage WHERE feature_name = 'report_generation'; - Longest single session duration:
SELECT MAX(time_spent_minutes) AS longest_session FROM feature_usage; - Earliest usage date for a feature:
SELECT MIN(usage_date) AS first_chat_use
FROM feature_usage
WHERE feature_name = 'team_chat';
Conclusion
Great job! You've now mastered the core set of SQL aggregate functions. You can move beyond just counting things to calculating meaningful summary statistics that describe user behavior in detail.
Key Takeaways:
SUM()calculates the total value of a numeric column.AVG()calculates the average value, which is essential for setting performance benchmarks.MIN()andMAX()find the smallest and largest values, helping you identify ranges, outliers, and historical start/end points.- These functions, when combined with the
WHEREclause, allow you to perform targeted analysis on specific user segments, features, or time periods. - Always use
ASto create clear, readable names for your calculated metrics.
Next Lesson Preview:
So far, we've calculated metrics across an entire table or a filtered subset. But what if you want to compare metrics across different categories? For instance, instead of the overall average time spent, you want to see the average time spent per feature?
In our next lesson, we will introduce the powerful GROUP BY clause. This will unlock a new level of analysis, allowing you to segment your users and compare metrics across different groups—a critical skill for any data-informed product designer.
Can't find a good explanation? Sign up and we'll make it for you
Sign up