
Hello! Welcome to our next lesson.
In our last session, we analyzed the Carnot cycle and established its role as the theoretical benchmark for maximum possible efficiency. We learned that while no real engine can achieve Carnot efficiency, it provides an essential upper limit for performance.
Today, we transition from the purely theoretical to a practical, yet idealized, model that is fundamental to your aerospace engineering goals. Our learning objective is to analyze the ideal Brayton cycle for gas turbine engines, including its T-s and P-v diagrams. This cycle is the thermodynamic model behind the jet and turbofan engines that power modern aircraft. We will break down its processes and see how we can represent them graphically, setting the stage for performance calculations in our next lesson.
1. From Real Engines to an Ideal Cycle
A gas turbine engine, in its simplest form, operates on an open cycle:
- It draws in air from the atmosphere.
- A compressor increases the air's pressure.
- The compressed air enters a combustion chamber, where fuel is injected and burned, dramatically increasing the temperature and energy of the gas.
- This hot, high-pressure gas expands through a turbine, which drives the compressor and produces power (or thrust).
- The hot exhaust gases are then expelled back into the atmosphere.
For thermodynamic analysis, it's difficult to work with an open cycle where the working fluid changes (air becomes combustion products) and is not returned to its initial state. To simplify this, we use an air-standard assumption and model it as a closed cycle.
Thermodynamic Cycles - Brayton Cycle (Part 4 of 4)
This video provides a great overview of a real gas turbine and explains how we model it as an idealized, closed thermodynamic cycle for analysis.
Watch the first 2 minutes and 54 seconds (00:00 - 02:54). Focus on understanding the four main stages in the real engine (induction, compression, combustion, exhaust) and how they are simplified into a closed loop with heat exchangers.
In this idealized closed cycle, known as the Brayton cycle:
- The combustion process is replaced by a constant-pressure heat addition process from an external source.
- The exhaust process is replaced by a constant-pressure heat rejection process, which returns the working fluid (assumed to be air throughout) to its initial state.
2. The Four Processes of the Ideal Brayton Cycle
The ideal Brayton cycle consists of four internally reversible processes:
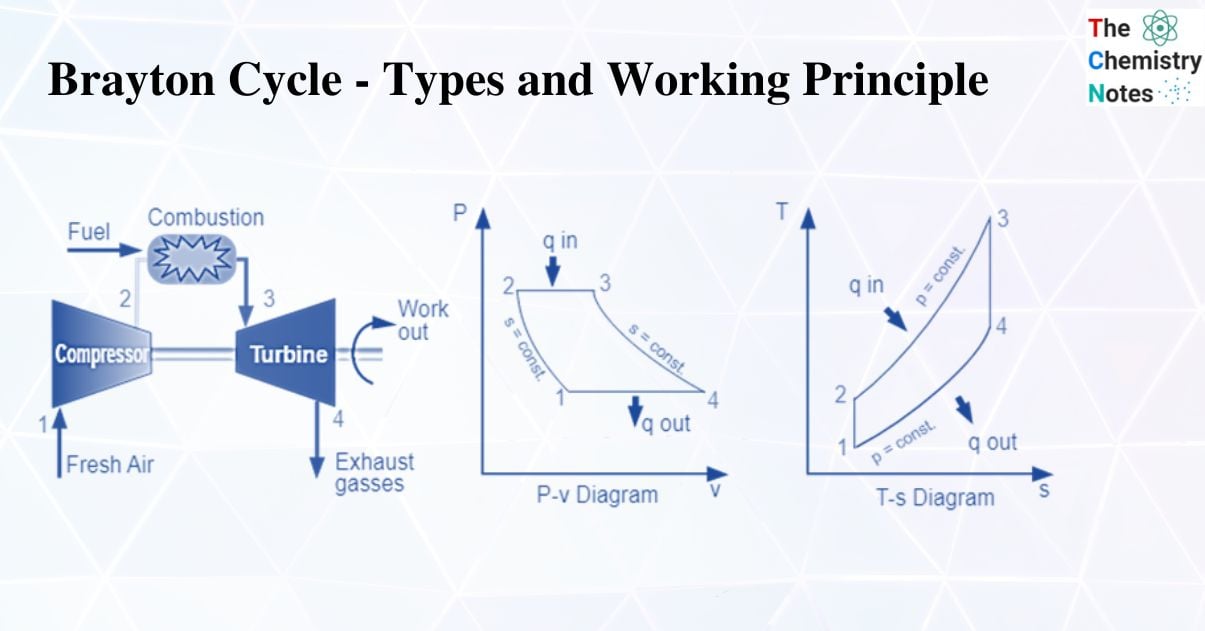
- Process 1-2: Isentropic Compression. The ambient air is drawn into the compressor and compressed to a high pressure. Since the process is ideal (reversible and adiabatic), the entropy remains constant. Pressure and temperature both increase.
- Process 2-3: Isobaric Heat Addition. The high-pressure air flows into the "combustor," where heat is added at constant pressure. This causes the temperature to increase significantly, reaching the maximum temperature of the cycle.
- Process 3-4: Isentropic Expansion. The hot, high-pressure gas expands through the turbine. This process produces work. Since it's ideal, entropy is constant, and both pressure and temperature decrease.
- Process 4-1: Isobaric Heat Rejection. The gas, still hotter than the ambient air, is cooled at constant pressure to return it to its initial state (State 1), rejecting heat in the process.
The image below shows a schematic of the engine components alongside the corresponding diagrams that visualize these four processes.
3. P-v and T-s Diagrams Explained
Let's take a closer look at what these diagrams tell us. Your experience with circuit diagrams in electronics is analogous; these diagrams provide a standardized way to visualize the state of the working fluid.
Thermodynamic Cycles - Brayton Cycle (Part 4 of 4)
This next segment of the video walks through the construction of the P-v and T-s diagrams for the Brayton cycle, process by process.
Watch from 02:41 to 05:13. Pay close attention to how each of the four processes is represented on both the Pressure-volume (P-v) and Temperature-entropy (T-s) diagrams.
Key Features of the Diagrams:
-
P-v Diagram (Pressure vs. Specific Volume):
- Processes 2-3 and 4-1 are horizontal lines because they are isobaric (constant pressure).
- Processes 1-2 (compression) and 3-4 (expansion) are steep curves. The area enclosed by the cycle in the P-v diagram represents the net work done per unit mass.
-
T-s Diagram (Temperature vs. Specific Entropy):
- Processes 1-2 and 3-4 are vertical lines because they are isentropic (constant entropy). This is a feature of an ideal compressor and turbine.
- Processes 2-3 (heat addition) and 4-1 (heat rejection) are curves representing the isobaric processes. Notice that constant pressure lines diverge on a T-s diagram.
- Just like with the Carnot cycle, the area under the process curve on a T-s diagram represents heat transfer. The area under curve 2-3 is the heat added (), and the area under curve 4-1 is the heat rejected (). The enclosed area is the net work ().
Test your understanding!
On the T-s diagram for the ideal Brayton cycle, which state represents the highest temperature, and which represents the highest pressure?
Show answer
- Highest Temperature: State 3, after heat has been added in the combustor but before expansion in the turbine. This is clear from the vertical axis of the T-s diagram.
- Highest Pressure: States 2 and 3 share the highest pressure. The pressure is increased from State 1 to 2 in the compressor and remains constant (ideally) through the combustor to State 3.
4. Analyzing the Cycle Components
To analyze the performance of the cycle, we apply the First Law of Thermodynamics (specifically, the steady-flow energy equation) to each of the four components, assuming they are steady-flow devices and that changes in kinetic and potential energy are negligible.
Notes on Thermodynamics, Fluid Mechanics, and Gas Dynamics
Please read the following document. It provides a concise summary of the ideal Brayton cycle processes and the first law analysis for each component, which will be the basis for our future efficiency calculations.
Read the section detailing the four processes of the ideal Brayton cycle, starting from 'Process 1-2: isentropic compression...' and ending just before the formula for thermal efficiency. Focus on the equations for work and heat transfer in terms of enthalpy (h).
As the reading explains, we can express the work and heat transfer per unit mass ( and ) for each process in terms of the specific enthalpy () at each state:
- Compressor (1-2): Work is done on the gas.
- Heat Exchanger / Combustor (2-3): Heat is added to the gas.
- Turbine (3-4): Work is done by the gas.
- Heat Exchanger / Exhaust (4-1): Heat is rejected from the gas.
For an ideal gas, the change in enthalpy is directly proportional to the change in temperature (), where is the specific heat at constant pressure. This simplifies the equations to:
These equations are the building blocks for evaluating the overall performance of a gas turbine engine.
Conclusion
In this lesson, we have dissected the ideal Brayton cycle, the theoretical foundation for the jet engines you're interested in.
Key Takeaways:
- The Brayton cycle is the idealized model for gas turbine engines, consisting of four processes: isentropic compression, isobaric heat addition, isentropic expansion, and isobaric heat rejection.
- P-v and T-s diagrams are essential tools for visualizing the cycle. On a T-s diagram, the ideal cycle appears as two vertical lines and two curved lines.
- The work and heat transfer in each component can be calculated using the change in specific enthalpy () between the inlet and outlet states.
Preview of the Next Lesson:
We have now defined the processes and the key equations for work and heat in the Brayton cycle. In our next lesson, we will use these building blocks to calculate the thermal efficiency and back work ratio for an ideal Brayton cycle. We will derive a simple but powerful formula for efficiency that depends on a single, crucial engine parameter: the pressure ratio.
Can't find a good explanation? Sign up and we'll make it for you
Sign up