
Hello! In our first lesson, we established a conceptual understanding of what n8n is and its unique position as a powerful, developer-centric automation platform. We saw that its real strength lies in its flexibility, extensibility, and the control offered by self-hosting.
Today, we move from concept to practice. This lesson is your guided tour of the n8n user interface, which n8n calls the Editor UI. Your goal is to learn how to navigate the three most important areas you'll be working in:
- The Canvas, where you build your workflows.
- The Node Panel, where you find your building blocks.
- The Execution Panel, where you inspect data and debug your logic.
Think of this as learning your way around a new IDE. Once you're comfortable with the layout and key functions, you'll be able to build and test workflows efficiently.
Your Command Center: The n8n Editor UI
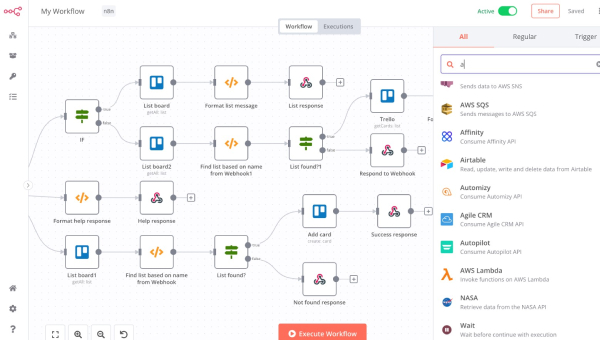
When you create a new workflow in n8n, you're presented with the Editor UI. This is your primary workspace for creating, testing, and managing your automations.
At first glance, it looks like a blank canvas, but it's composed of several distinct, powerful panels.
To get a comprehensive, detailed map of the entire UI, the official n8n documentation is the best place to start. It acts as a reference manual that you can return to anytime you're unsure about what a button or a menu does.
This document from the official n8n docs provides a systematic breakdown of every component in the Editor UI. Reading this first will give you a solid mental model of the interface.
Please read the document starting from the 'Editor UI settings' section. Pay close attention to the descriptions and annotated images for the 'Left-side panel', 'Top bar', 'Canvas', and 'Nodes' sections. Don't worry about memorizing everything; focus on understanding the purpose of each main area.
Now that you have a static overview, let's bring these concepts to life with a more dynamic tour, focusing on the three core components you'll use constantly.
A Dynamic Tour of the Key Panels
We'll use clips from an n8n quick-start video to see these panels in action.
1. The Canvas and the Node Panel
The Canvas is the main grid area where you visually construct your workflow by adding and connecting nodes. The Node Panel is the palette on the right-hand side where you find all the available nodes (triggers, app integrations, logic helpers, etc.).
This first clip shows the process of starting a new workflow on the blank canvas and adding the first node from the node panel.
n8n Quick Start Tutorial: Build Your First Workflow [2025]
Let's see the Canvas and Node Panel in action. This clip shows how a new workflow is started and the first node is added from the Node Panel.
Watch from 00:53 to 01:43. Observe how the blank canvas is the starting point and how the presenter opens the node panel to select a specific type of trigger node.
As you saw, the process is straightforward:
- Click the
+button on the canvas to open the Node Panel. - Search or browse for the node you need.
- Click the node to add it to the canvas.
2. The Execution Panel: Your Debugger
Once you add and configure a node, you'll need to run it to see what it does. The results are displayed in the Execution Panel. For you as a developer, this is arguably the most critical part of the UI. It's where you'll inspect the data flowing through your workflow, much like using a debugger's variable inspector or a browser's developer console.
n8n passes data between nodes in JSON format. The Execution Panel gives you multiple ways to view this data.
n8n Quick Start Tutorial: Build Your First Workflow [2025]
After a node runs, the most important step is to inspect its output. Notice the different ways you can view the output data.
Watch from 03:14 to 03:51. Pay close attention to the 'JSON', 'Table', and 'Schema' views. The JSON view is the most fundamental, as it shows the raw data structure you'll be working with in later steps.
The three views—JSON, Table, and Schema—give you different perspectives on the same data, allowing you to choose the most convenient one for the task at hand. You will likely find the raw JSON view most useful for complex data manipulation.
A Key Development Feature: Pinning Data
When building a multi-step workflow, it can be tedious to re-run the entire sequence just to test a single node at the end. The "Pin Data" feature solves this. It allows you to "freeze" the output of a node. Subsequent test runs will then use this pinned data instead of actually executing the node. This is analogous to mocking a function's return value during unit testing.
n8n Quick Start Tutorial: Build Your First Workflow [2025]
Pinning a node's output is a crucial time-saver during development. Watch how it's done.
Watch from 05:05 to 05:33 to see how pinning works. Notice the pin icon that appears on the node in the canvas.
Test vs. Production Executions
When you manually execute a workflow in the canvas (using the "Execute Workflow" button), it's considered a test execution. These runs are for development and are often marked with a beaker icon.
Once you activate a workflow, it will run automatically based on its trigger (e.g., on a schedule or via a webhook). These are production executions. You can view the history of these live runs in the "Executions" tab, which is essential for monitoring and debugging your live automations.
n8n Quick Start Tutorial: Build Your First Workflow [2025]
The execution view isn't just for testing. After you activate a workflow, you can view the history of its production runs. This is essential for monitoring and debugging live automations.
Watch from 13:24 to 13:44. Notice how the presenter navigates to the 'Executions' tab to inspect a live run, which is distinct from a test run.
Test your understanding!
Imagine you are building a workflow. You have a node that fetches a list of users from a database. Now, you want to add a step that sends an email to each user.
- Which UI panel would you use to find the "Send Email" node?
- After configuring and running the "Send Email" node, you get an error. Which UI panel would you use to inspect the error message and the data that was passed into the "Send Email" node?
Show answer
- You would use the Node Panel. You would click the
+button after the database node, then search for "Send Email" (or a specific service like "Gmail" or "Microsoft Outlook Mail"). - You would use the Execution Panel (or execution view). It would show you the failed status of the "Send Email" node, the specific error message, and allow you to inspect the 'Input' tab to see the exact JSON data it received from the previous node. This is key to debugging the problem.
Conclusion
You've now completed a tour of the n8n Editor UI. You have a mental map of the interface and know the purpose of its three most important components.
Key Takeaways:
- The Canvas is your main workspace for visually assembling workflows.
- The Node Panel is your toolbox, containing all the triggers and actions you can add to the canvas.
- The Execution Panel is your debugging and inspection tool, allowing you to see the JSON data that flows between nodes, view output, and diagnose errors.
- Features like pinning data are essential for an efficient development process.
With this navigational knowledge, you're ready to get your hands dirty. In the next lesson, you will apply what you've learned to create, execute, and save your first simple 'Hello World' workflow.