
Hello. In the previous lesson, you separated the architectural layers that make security operations possible: a connector collects data, a Log Analytics workspace stores it in tables, and Microsoft Sentinel analyzes it. You also distinguished alerts, incidents, entities, evidence, actions, and remediations.
Now we will follow one security event through the operational lifecycle. By the end of this lesson, you should be able to explain where a record becomes meaningful, how a detection becomes an alert, why multiple alerts may become one incident, and how an analyst moves from investigation to a justified response. This is a core SC-200 scenario pattern.
A security event is not yet an incident
A security event is a recorded observation: a sign-in, process creation, firewall connection, mailbox rule change, or Azure resource operation. Most events are legitimate. Their value is that they provide the evidence from which a detection system—or a human hunter—can recognize suspicious behavior.
The lifecycle has five distinct stages:
| Stage | Central question | Typical output |
|---|---|---|
| Ingestion | Did the relevant telemetry reach the security platform? | Records stored in log tables, or source-product alerts received |
| Detection | Does the data match suspicious behavior or a known threat? | An alert |
| Incident creation and correlation | Are related alerts part of the same attack story? | An incident |
| Investigation | What happened, what is affected, and how confident are we? | Evidence-based scope and decision |
| Response | How do we contain, remediate, recover, and document the outcome? | Actions, remediation results, and closure |
This is a useful model, but not a rigid pipeline. For example, an automated response may contain a device before a human completes the investigation. New evidence may also cause an incident to expand after it has been assigned. Still, the model helps you identify what an SC-200 question is actually asking about.
Two distinctions are especially important:
- Ingested raw telemetry is data such as a Windows event, firewall log, or Entra sign-in record. An analytics rule or hunting query must interpret it.
- Ingested security conclusions are alerts already generated by another security product, such as Defender for Endpoint or Defender for Identity. Sentinel can use those alerts as useful correlated context.
- An alert says, “this specific detection deserves attention.”
- An incident says, “these alerts and related entities should be handled as one investigation case.”
For a concise visual review of the first two stages, watch this portion of John Savill’s Functionality and Usage of Microsoft Sentinel. It shows Sentinel’s relationship to the Log Analytics workspace, data connectors, and the analysis of collected signals.
Functionality and Usage of Microsoft Sentinel - AZ-900 Certification Course
Watch Functionality and Usage of Microsoft Sentinel by John Savill's Technical Training to reinforce the difference between collecting data and deriving security meaning from it.
In the section beginning around 1:32, watch data ingestion. Focus on the fact that Sentinel operates over a Log Analytics workspace and can collect from Azure, on-premises systems, other clouds, network devices, identity providers, and SaaS services. Then watch analysis and incidents to see why collected data needs detection logic, intelligence, and correlation before it becomes operationally useful.
Stage 1: ingest data that can answer the investigation question
Imagine that Northwind Retail suspects an attacker may be operating from a compromised workstation. The SOC needs visibility across several kinds of activity:
- Windows security events from the workstation
- Firewall or proxy records showing outbound network connections
- Identity telemetry showing account use
- Defender alerts that may already identify suspicious endpoint or identity behavior
The source produces the original event. A configured ingestion mechanism then routes it into the appropriate Log Analytics workspace table. Depending on the source, this might involve a Microsoft Sentinel connector, Azure Monitor Agent and a data collection rule, diagnostic settings, an API, or a service-to-service integration.
At this point, the security record is available, but it is not automatically an incident.
A practical diagnostic rule follows:
If the source telemetry was never collected, a detection cannot find it; if it is collected into the wrong workspace or lacks required fields, the intended rule may not produce a useful alert.
Microsoft Learn distinguishes four valuable categories of ingested data: raw operational data, existing security conclusions, reference data, and threat intelligence. The distinction between raw data and security conclusions matters frequently in SC-200 questions.
Microsoft Sentinel components and patterns | Microsoft Learn
Read the relevant portions of Microsoft Sentinel components and patterns from Microsoft Learn. It explains what Sentinel can ingest and how that data supports detection and hunting.
In the Data collection section, begin with the data categories. Pay particular attention to the difference between Unprocessed data, which can support detections and hunting, and Security conclusions, which are alerts or detections made by another product and brought into Sentinel for visibility and correlation. Then move to Monitoring and detection and read the analytics rules discussion. Focus on the three possible operational outcomes: alerts, incidents, and an automation trigger.
What ingestion looks like in our scenario
At 09:00, the compromised workstation creates a suspicious process activity record. Around the same time, the firewall records an unusual outbound connection, and identity telemetry shows the same user account accessing an internal resource.
Each record alone may be ambiguous:
- A process can be unusual without being malicious.
- An external IP connection can be legitimate.
- A user accessing a resource can be normal.
In combination, especially when tied to the same user, device, IP address, and time window, the records form a stronger security hypothesis. This is why a SOC collects multiple telemetry types rather than relying on one product alone.
Stage 2: turn suspicious patterns into alerts
A detection applies logic to available data. In Sentinel, an analytics rule can run a KQL query on a schedule, compare the results to its configured threshold, and generate alerts when the criteria are met.
For Northwind, suppose an analytics rule is designed to identify:
- suspicious PowerShell behavior on a device;
- followed by an outbound connection to an unusual external address;
- with activity occurring under a user account that has recently authenticated to sensitive internal resources.
The rule is not merely “looking at a dashboard.” It evaluates defined logic against ingested records. When its result meets the conditions, it generates an alert containing the relevant detection details.

The configuration choices in the image affect the quality and volume of operational signals:
- Query schedule and lookback period determine when the rule evaluates data and how much historical data it considers.
- Alert threshold determines how many query results must occur before an alert is generated.
- Event grouping controls whether matching query results are presented as one alert or as separate alerts.
- Suppression can reduce repeated alerts for a period after an alert fires.
These settings are not simply administrative details. A threshold that is too low can create a flood of low-value alerts; one that is too high can miss the behavior the rule was intended to detect. Grouping all matching events into one alert can make triage easier, but the analyst must still inspect the underlying events.
Detection is not the same as hunting
An analytics rule runs automatically according to a configured schedule or event-driven model. Its purpose is to produce alerts for recognized patterns.
A hunting query is generally run proactively by an analyst to test a hypothesis or search for threats that existing detections might miss. A hunting discovery can lead to an incident, but a query result on its own is not necessarily an alert.
Exam trap: Do not choose a hunting query when the requirement says the SOC needs an automatic alert whenever a pattern occurs. Do not choose an analytics rule merely because an analyst wants to explore a newly reported indicator across historical data.
Stage 3: correlate related alerts into an incident
Northwind’s analytics rule creates an alert for suspicious process and outbound activity. Separately, Defender for Identity raises an alert that indicates SMB reconnaissance associated with the same device or account.
An analyst should not have to treat these as unrelated tickets. The security platform can correlate related alerts using characteristics such as:
- common entities, including user accounts, devices, IP addresses, files, domains, or mailboxes;
- close timing;
- matching attack techniques or campaign context;
- related activity identified by integrated Microsoft security products.
The result is an incident: the investigation container that gathers the related alerts and entities into an attack story.
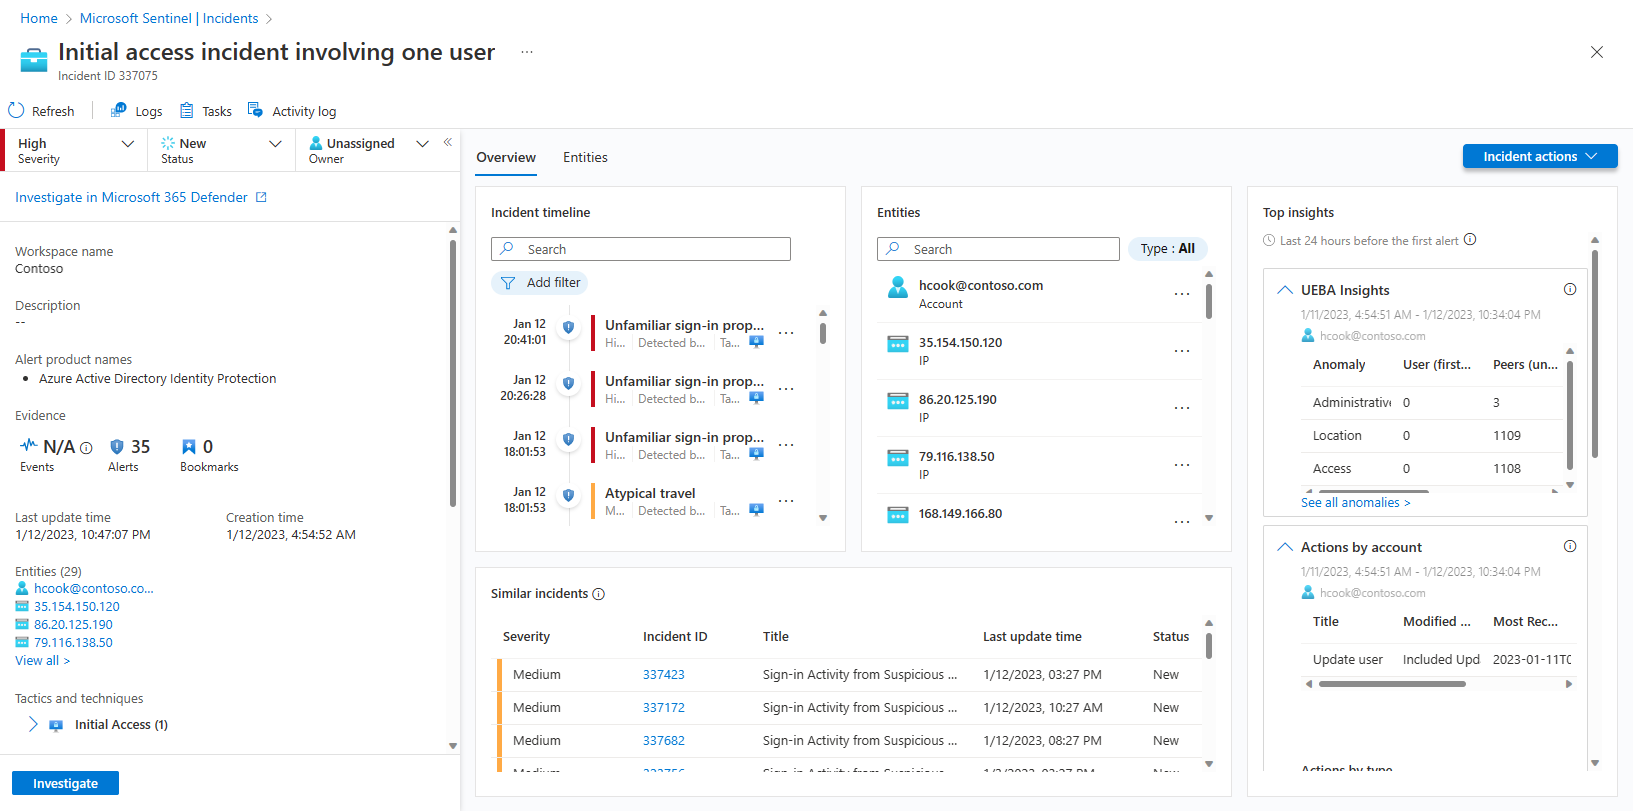
The incident page does not replace the underlying alerts. It organizes them. You still need to examine each alert’s evidence, source, detection logic, entities, and timestamps. An alert may provide the first clue; the incident provides the broader case context.
For the Northwind scenario, the incident might now contain:
| Item | What it contributes |
|---|---|
| Sentinel analytics alert | Suspicious process and outbound-connection pattern |
| Defender for Identity alert | Reconnaissance against identity infrastructure |
| Device entity | The suspected compromised workstation |
| User entity | The account used during the activity |
| External IP entity | A pivot for reputation checks and searches |
| Timeline | The order in which the observed behaviors occurred |
A common error is to assume that every alert always creates its own incident. Correlation and incident settings determine how alerts are grouped. The desired outcome is neither “one massive incident for everything” nor “one separate case for every event.” It is an incident scope that represents one coherent security problem.
Stage 4: investigate by pivoting through entities and evidence
Investigation changes the question from “Did a rule match?” to “What actually happened, how far did it spread, and what response is justified?”
A disciplined investigation for Northwind could proceed as follows:
-
Confirm the detection context. Review the alert title, severity, timestamps, triggering evidence, rule logic, and detection source. Determine whether the alert is likely a true positive, benign activity, or a false positive.
-
Establish the affected entities. Review the device, user, IP address, process, and any related files or domains. Identify whether the user or device is high value and whether other systems are implicated.
-
Reconstruct the timeline. Compare the endpoint process activity, network connection, identity events, and alerts in chronological order. This identifies whether the apparent sequence is consistent with an attack.
-
Pivot outward. Search for the external IP on other devices, examine the user’s recent sign-ins, inspect the process tree, and look for other alerts linked to the same entities.
-
Define scope and confidence. Decide whether there is evidence of persistence, credential theft, lateral movement, data access, or other affected assets. Record what is known, unknown, and being investigated.
The incident investigation graph is useful because it makes relationships visible. But a graph is an investigation aid, not proof by itself. A connection between a user and a device may simply show normal use; the analyst must validate the relationship against timestamps and underlying telemetry.
Microsoft Defender XDR uses the same operational principle across its integrated products: related alerts can be aggregated into one incident so the analyst can investigate a broader attack story. This guided Microsoft Learn walkthrough illustrates that progression from incident to alert review, device timeline, automated investigation, and remediation.
Read selected parts of Microsoft Learn's Investigate and respond to incidents in Microsoft Defender XDR. Although the walkthrough uses a simulated attack, it demonstrates the general analyst workflow of correlating alerts, pivoting through entities, validating evidence, and reviewing response results.
In Investigate the attack as a single incident, read the correlation explanation and continue through the incident-page overview. Notice that individual alerts remain available inside the incident and that their progression helps reconstruct the attack. Next, in Review the device timeline with Microsoft Defender for Endpoint, read the device timeline workflow. Focus on why a chronological timeline helps validate causal claims. Finally, in Automated investigation and remediation, read the investigation evidence description and the remediation result. Separate the evidence gathered during the investigation from the action taken against the suspicious artifact.
Investigation outputs should support a decision
By the end of triage and investigation, the analyst should be able to state something like:
The workstation
NW-WS-14ran suspicious process activity under the accountalex@northwind.example, connected to the external IP address identified in the alert, and conducted identity reconnaissance. Related searches found no comparable activity on other devices. The incident is assessed as a true positive, contained endpoint compromise, pending credential remediation and verification.
That statement is stronger than “the alert was high severity.” Severity is useful for prioritization, but it does not prove compromise or determine the full scope.
Stage 5: respond, verify, and close
Response should be proportional to validated risk and follow organizational authority and change-control requirements.
For the Northwind incident, the immediate containment actions could include isolating the affected device, disabling or suspending the user account, blocking a confirmed malicious indicator, or ending a malicious process. These limit the attacker’s ability to continue.
Remediation addresses the cause and the artifacts left behind. Depending on findings, it may include removing malware, resetting credentials, revoking active sessions, correcting an unsafe configuration, or rebuilding the affected device. Recovery then returns the business system to a trusted operational state.
Microsoft Sentinel playbooks can automate parts of this process. A playbook may enrich an incident, notify the SOC, create an ITSM ticket, block an IP through an integrated control, or invoke a configured containment action. Defender products may also perform automated investigation and remediation within their own scope.
Read the response portion of the Sentinel guidance to connect incident findings to automation options.
Microsoft Sentinel components and patterns | Microsoft Learn
Return to Microsoft Learn's Microsoft Sentinel components and patterns for its explanation of investigation graphs and playbook-driven response.
In the Investigation section, read the investigation graph overview. Then, in Response, read the playbook examples. Focus on the difference between enriching or notifying about an incident and taking a containment action such as blocking an account or IP address.
Before closing the incident, verify that the response worked:
- Confirm that the device is isolated or the malicious process is no longer running, if containment required it.
- Confirm that compromised credentials, sessions, or access paths were addressed.
- Search for related entities and indicators to determine whether the activity spread.
- Review whether subsequent telemetry indicates recurring malicious behavior.
- Document evidence, decisions, owner, response actions, remaining risk, and classification.
Only then should the incident be resolved or closed according to the SOC process. Closing an incident changes case status; it does not itself remove malware, reset credentials, or make a device safe.
SC-200 lifecycle traps
Use these quick checks when choosing between similar answers:
| Scenario wording | Best interpretation |
|---|---|
| “Collect Windows events from servers for later analysis.” | Ingestion through the appropriate agent and collection configuration |
| “Run a KQL query automatically and notify the SOC when it matches.” | Analytics rule / detection |
| “Combine process, identity, and network alerts related to one attack.” | Incident correlation |
| “Determine whether the user, device, and IP are actually related.” | Investigation using entities and evidence |
| “Notify the team and create a ServiceNow ticket when a high-severity incident opens.” | Automation rule and playbook workflow |
| “Remove malicious artifacts or isolate a compromised device.” | Containment or remediation action |
| “Mark the ticket as resolved.” | Incident management, not remediation itself |
Also remember:
- More collected data is not automatically better if it is irrelevant, poorly normalized, or inaccessible to the analyst.
- A detection needs the required telemetry and correct logic. An empty query result may indicate no attack, but it can also indicate missing ingestion, an incorrect time range, or a schema mismatch.
- An alert is a signal requiring assessment; it is not automatic proof of compromise.
- A resolved incident can be reopened if new evidence changes the assessment.
Key takeaways
A security event becomes operationally meaningful through a chain of decisions:
- Ingestion places raw telemetry or existing product alerts where the SOC can analyze them.
- Detection applies analytics, intelligence, or product logic to generate an alert.
- Correlation groups related alerts and entities into an incident representing an attack story.
- Investigation validates the alert, reconstructs the timeline, establishes scope, and produces evidence for a decision.
- Response contains and remediates the threat, verifies the result, documents the work, and then closes the incident appropriately.
In the next lesson, you will focus on choosing the right investigation source—endpoint, identity, email, cloud application, cloud workload, or SIEM telemetry—based on the evidence available in a scenario.
Can't find a good explanation? Sign up and we'll make it for you
Sign up