Hello again. This is the final lesson in our first module, "The Request-to-Token Mental Model."
Introduction
In our last lesson, we established a crucial theoretical foundation: LLM inference is a two-phase process with distinct performance profiles.
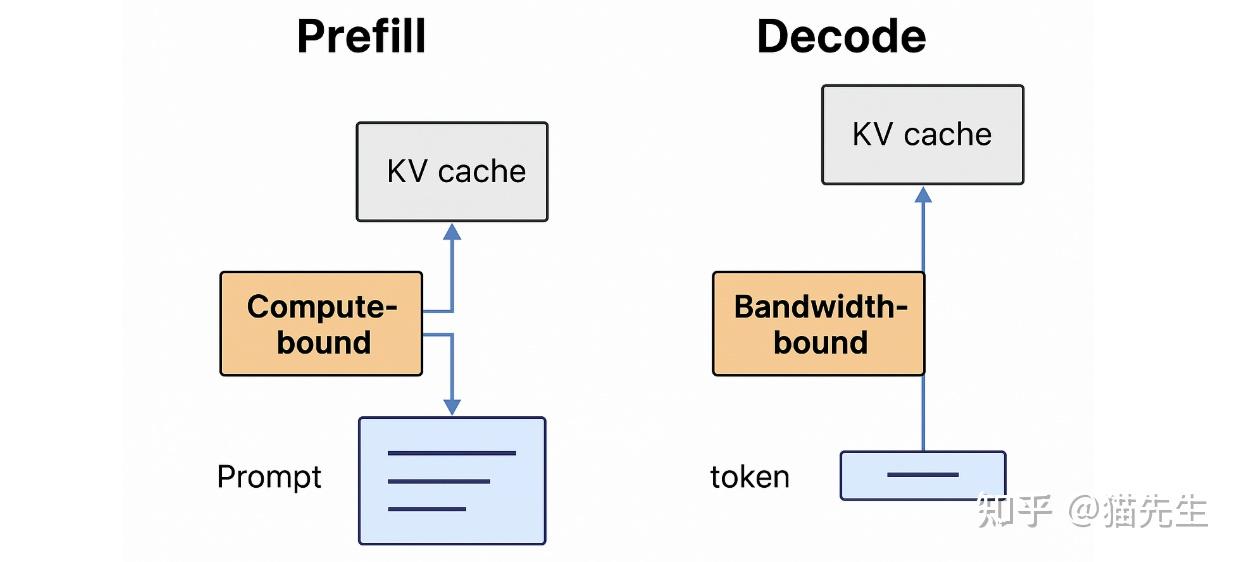
- Prefill, which processes the input prompt, is compute-bound.
- Decode, which generates output tokens one by one, is memory-bound.
You learned that this dichotomy means that Time-to-First-Token (TTFT) is dominated by prefill performance, while Inter-Token Latency (ITL) is a measure of decode performance.
Today, we put that theory into practice. The learning outcome for this lesson is to measure and compare time-to-first-token (TTFT) vs. inter-token latency (ITL) on a running model to diagnose performance characteristics. We will move from understanding why these metrics are different to learning how to measure them and use them as your primary diagnostic tools for any LLM serving system.
The Two Most Important Latency Metrics
For any interactive LLM application, user-perceived latency can be broken down into two critical components:
- Time-to-First-Token (TTFT): The time a user waits after sending their prompt to see the first piece of the response. This is primarily the latency of the compute-bound prefill phase.
- Inter-Token Latency (ITL): The time between each subsequent token appearing. This is also known as Time Per Output Token (TPOT) and reflects the speed of the memory-bound decode phase.
The diagram below gives a clear visual breakdown of how these metrics map to the inference process.
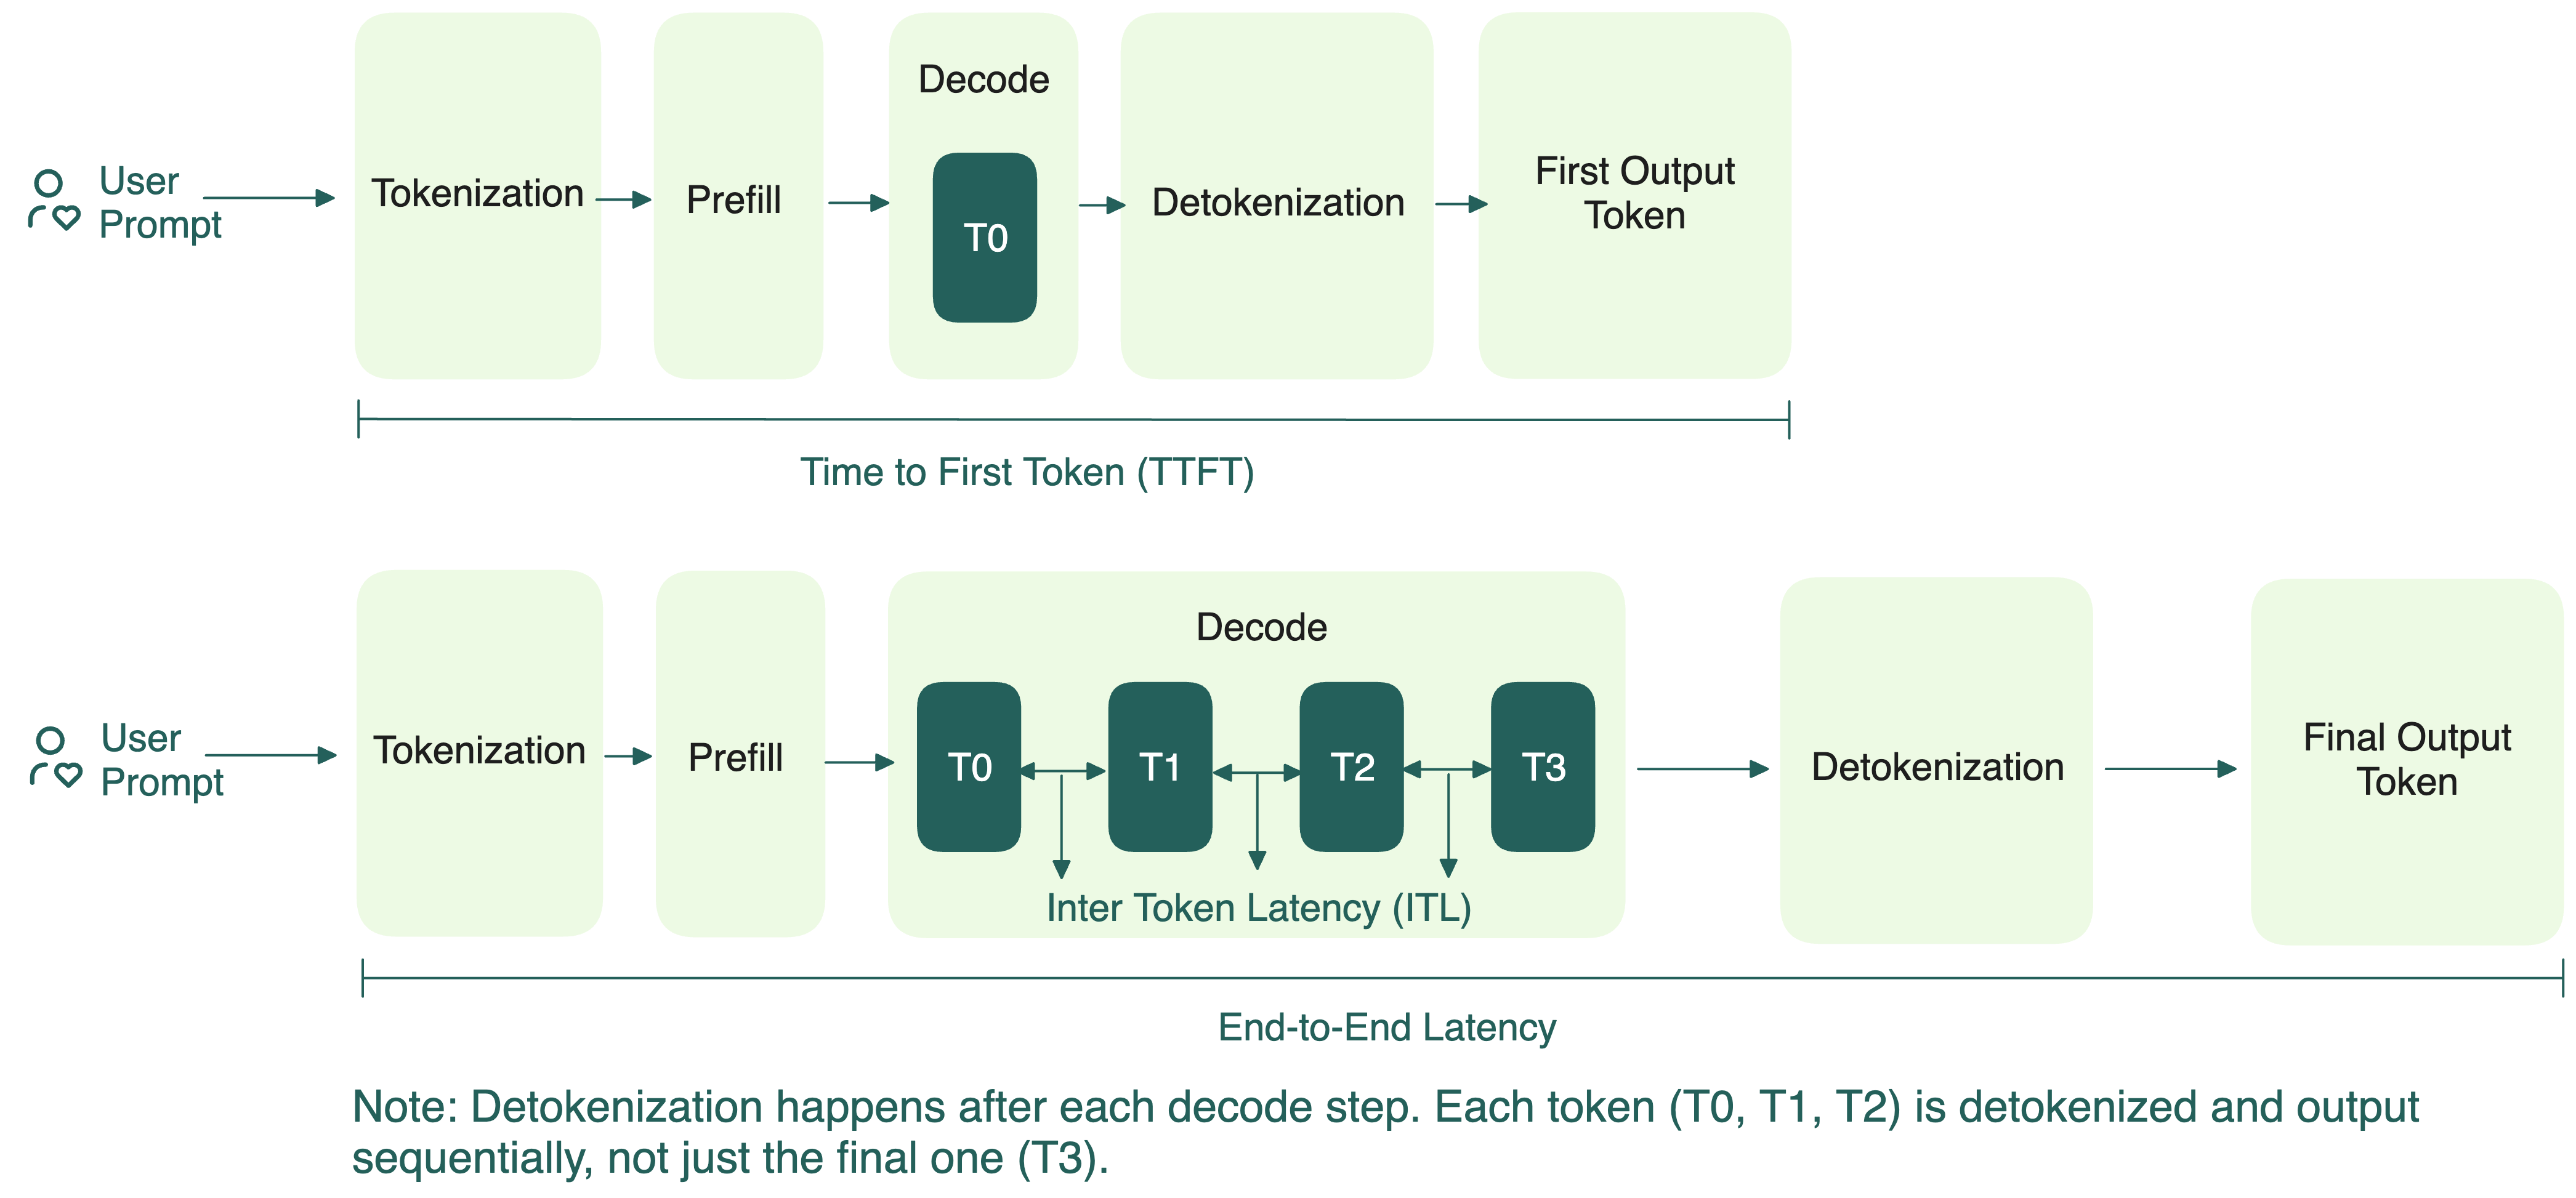
To measure these accurately, you need a serving endpoint that supports streaming. By recording timestamps when the request is sent, when the first response chunk arrives, and when each subsequent chunk arrives, you can calculate these metrics precisely.
Let's look at a practical guide that explains how to perform these calculations.
LLM Inference Performance Benchmarking from Scratch
The blog post 'LLM Inference Performance Benchmarking from Scratch' by Phillippe Siclait provides a clear, code-oriented explanation of how to define and calculate these core metrics.
Please read the 'Performance analysis' section. Focus on the definitions and formulas provided for Time-to-first-token (TTFT) and Inter-token latency (ITL). Note how they are derived from the timestamps of streaming server-sent events (SSE).
As the article demonstrates, the math is straightforward:
- TTFT =
timestamp_first_token_received-timestamp_request_sent - ITL = (
timestamp_last_token_received-timestamp_first_token_received) / (num_output_tokens- 1)
Designing Benchmarks to Isolate Prefill and Decode
Since TTFT and ITL correspond to different phases of inference, you can design specific benchmarks to stress and measure each one independently. This is the key to effective performance diagnosis.
The diagram below is a reminder of the two phases we're targeting. Your goal is to design a workload that stresses either the "Prefill" box or the "Decode" box.
A very useful cheat sheet gives us the exact strategy for this.
LLM Benchmark - Python Cheat Sheet
The 'LLM Benchmark - Python Cheat Sheet' provides a concise, practical methodology for constructing benchmarks that target either the prefill or decode phase.
Please read the sections 'Prefill (TTFT)', 'Decode (ITL)', and 'Key Metrics'. Pay close attention to the benchmark parameters suggested for isolating each phase.
Let's formalize the strategy outlined in the resource:
-
To Measure Prefill Performance (TTFT):
- Workload: Use a long input sequence and set the output sequence length to 1 (e.g.,
input-len=2048,output-len=1). - Why it works: By generating only one token, the vast majority of the request's execution time is spent in the initial prefill phase. The measured latency is therefore a direct reflection of TTFT.
- Diagnostic Power: By sweeping the input length (e.g., from 128 to 4096 tokens) and measuring TTFT, you can characterize how well your system handles prompts of varying sizes. A linear increase in TTFT with input length is expected.
- Workload: Use a long input sequence and set the output sequence length to 1 (e.g.,
-
To Measure Decode Performance (ITL):
- Workload: Use a short, fixed-length input and a long output sequence (e.g.,
input-len=128,output-len=1024). - Why it works: The prefill phase is quick due to the short prompt. The bulk of the time is spent in the autoregressive decode loop. The average time per token during this long generation is your ITL.
- Diagnostic Power: By sweeping the output length, you can see how ITL changes as the KV cache grows. A stable ITL is ideal, but you might see it increase if the system struggles with managing a large KV cache, which could point to memory bandwidth limitations.
- Workload: Use a short, fixed-length input and a long output sequence (e.g.,
From Measurement to Diagnosis
With these two types of measurements, you can start diagnosing performance bottlenecks.
- High TTFT / Low ITL: The system is slow to start but generates tokens quickly once it begins.
- Possible Causes: The GPU may have insufficient compute power for the model size, or the prefill CUDA kernels may be inefficient. The system might be acceptable for batch jobs like summarization but poor for interactive chat.
- Low TTFT / High ITL: The system responds instantly but then generates tokens slowly.
- Possible Causes: The GPU might have low memory bandwidth, making KV cache access the bottleneck. This is common in long-context scenarios where the KV cache becomes enormous. The user experience would be poor, as the response trickles out at a frustratingly slow pace.
- High TTFT / High ITL: The system is underpowered across the board for the given model.
The following video shows real-world profiling data that visualizes these metrics under increasing load, demonstrating how they are used to determine a system's capacity.
DistServe: disaggregating prefill and decoding for goodput-optimized LLM inference
Returning to the 'DistServe' presentation, let's look at how researchers plot TTFT and ITL (referred to as TPoT) to characterize a system's performance limits.
Watch from 12:20 to 15:52. Observe the two graphs: P90 TTFT vs. request rate, and P90 TPoT vs. request rate. Notice how they define a latency constraint (the dotted line) and find the maximum request rate the system can sustain before violating that constraint. This is a classic example of using these metrics for system characterization.
A More Sophisticated Metric: Goodput
Throughput, measured in tokens/second, is often misleading. A system might have high throughput but with unacceptable latency for most users. A more meaningful metric is goodput: the portion of throughput that meets a defined Service Level Objective (SLO).
An SLO is a performance target, typically defined using TTFT and ITL. For example: "99% of requests must have a TTFT < 500ms and an ITL < 40ms/token."
Goodput is the number of requests or tokens per second that satisfy these SLOs. It directly reflects the user-perceived quality of service.
DistServe: disaggregating prefill and decoding for goodput-optimized LLM inference
This short clip from the 'DistServe' talk introduces the concept of goodput and explains why it's a more valuable metric than raw throughput.
Please watch from 03:51 to 04:59. The speaker clearly illustrates how applying latency constraints (SLOs) can dramatically reduce the 'effective' throughput to what we call goodput.
Modern benchmarking tools are built to measure this. They allow you to specify your latency SLOs and will report what percentage of requests successfully met them. This transforms benchmarking from a raw performance measurement into a user-experience-centric analysis.
Conclusion
This lesson concludes our first module by equipping you with the practical methodology to benchmark and diagnose LLM serving performance. You have completed the full request-to-token mental model, from the conceptual stages of inference down to the metrics used to evaluate a live system.
Key Takeaways:
- TTFT and ITL are the primary latency metrics for interactive LLM serving, corresponding to the compute-bound prefill and memory-bound decode phases, respectively.
- You can design specific benchmarks to isolate and measure each metric:
- To test TTFT: Use long prompts and generate only one token.
- To test ITL: Use short prompts and generate many tokens.
- By comparing TTFT and ITL, you can diagnose whether a performance bottleneck is related to compute or memory bandwidth.
- Goodput is a superior metric to raw throughput because it measures the rate of successful requests that meet predefined latency SLOs (Service Level Objectives) for TTFT and ITL.
Preview of the Next Module:
We have now established the full conceptual framework. In the next module, "Foundations: Serving and Profiling a Small Model," we will get our hands dirty. The very first lesson will guide you to set up a local inference environment with PyTorch and CUDA on a single consumer GPU. You'll then be perfectly positioned to apply the benchmarking principles you've just learned to a real, running model.