
Introduction
In our last lesson, we explored the inner workings of the Horizontal Pod Autoscaler (HPA), focusing on its control loop, scaling algorithm, and the various metric APIs it uses to gather data. You now have a solid understanding of the how of autoscaling.
This lesson addresses the crucial question of what to scale on. We will justify why, for your specific use case of a Pub/Sub consumer, relying on standard metrics like CPU and memory is often insufficient and can even be misleading. This is the final conceptual piece of the puzzle before we begin implementing a scaling solution that is directly responsive to your application's workload. By the end of this lesson, you will be able to articulate why scaling based on queue backlog is the correct approach for your event-driven service.
The Blind Spot of Standard Metrics
The default and most common way to use the HPA is to scale based on CPU or memory utilization. While simple and effective for many stateless, request-driven web servers, this approach has a significant blind spot for event-driven workloads like your Pub/Sub consumer.
The fundamental issue is that CPU and memory are system-level metrics. They tell you how busy the container is, but they don't necessarily tell you how well the application is keeping up with its actual work. For your service, the true measure of load isn't CPU usage; it's the number of messages in the Pub/Sub subscription waiting to be processed.
Consider these scenarios:
- Growing Backlog, Low CPU: Your application pulls a message and then performs a task that is I/O-bound (e.g., waiting for a response from a slow database or an external API). During this waiting period, CPU usage is very low. Messages could be piling up in the subscription, but an HPA targeting 80% CPU utilization would see no reason to scale up the number of consumers.
- High CPU, Empty Queue: A bug in your code causes a pod to enter a tight loop, consuming 100% of its CPU. Meanwhile, the Pub/Sub subscription is empty. A CPU-based HPA would needlessly scale up your deployment, increasing costs with no work to be done.
This disconnect is what the article below refers to as a "metric blind spot."
Kubernetes HPA: Scale Pods Based on Resource Usage
This article clearly explains the limitations of relying solely on CPU and memory for scaling. It introduces the idea that actual demand is often tied to metrics that the HPA cannot see by default.
Read the section titled 'Limitations and Trade-offs', paying close attention to the bullet point on 'Metric blind spots'. This directly frames the problem we're solving.
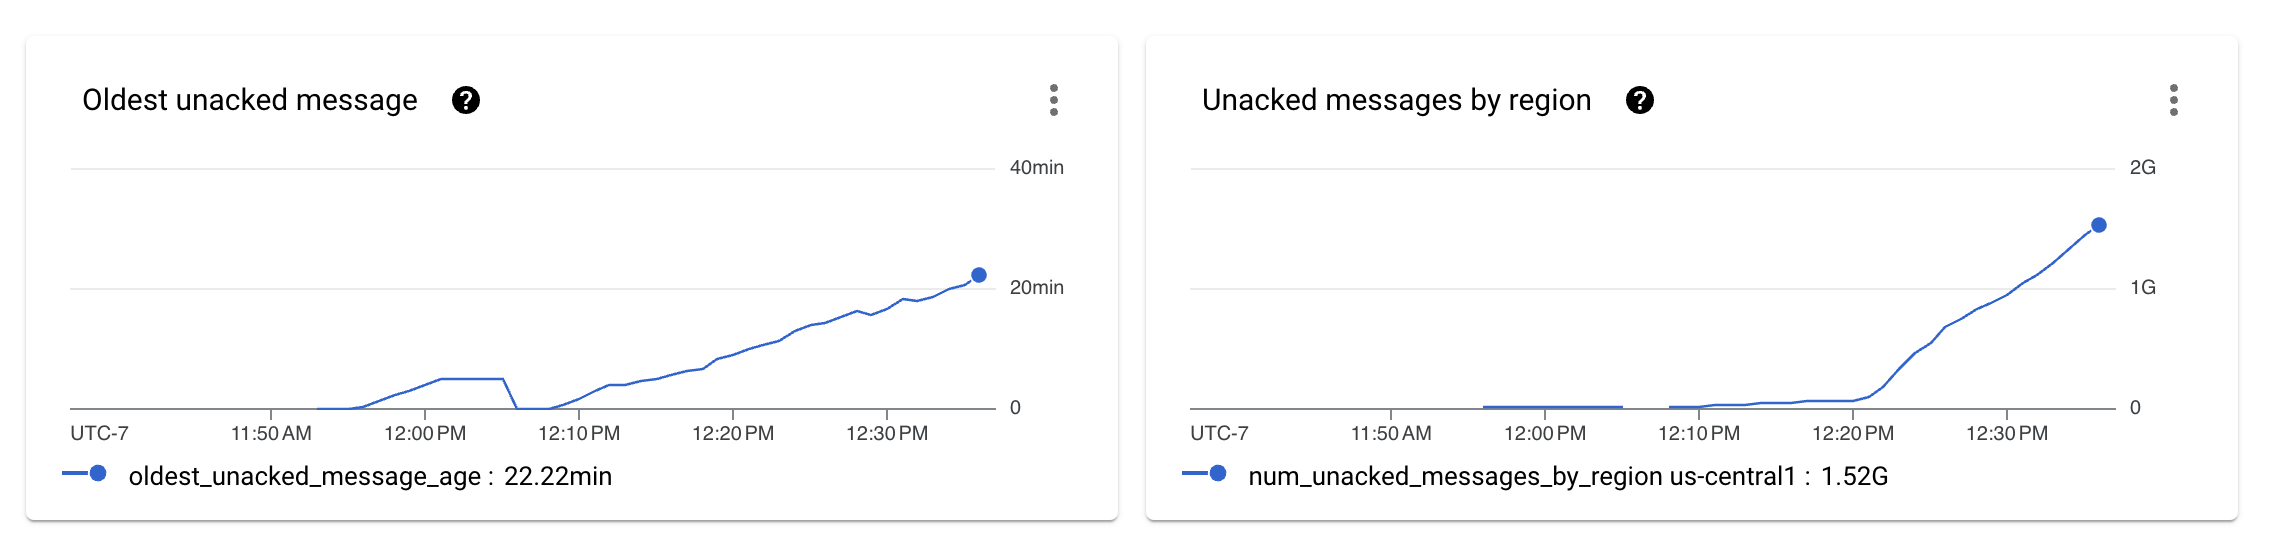
The graph below is a typical example of what happens when consumers can't keep up. Both the number of unacknowledged messages and their age increase, indicating a growing backlog and processing delay, even if CPU metrics remain stable.
Scaling on What Matters: Backlog Metrics
To solve this, we must configure the HPA to scale based on a metric that directly represents the workload. For a Pub/Sub consumer, the most effective metrics are those that reflect the backlog:
subscription/num_undelivered_messages: The number of messages in the subscription that have not yet been delivered to and acknowledged by a consumer. This is a direct measure of the pending workload.subscription/oldest_unacked_message_age: The age of the oldest message that has been delivered but not yet acknowledged. This is a proxy for processing latency.
These are what we referred to as Custom Metrics or External Metrics in the previous lesson. They provide a direct, unambiguous signal to the HPA: "if the backlog exceeds X, add more consumers."
Kubernetes HPA: Scale Pods Based on Resource Usage
The same article goes on to discuss how to overcome these blind spots by using metrics tied to business logic.
Now read the sections 'Use External Metrics for Business Logic' and the subsection 'Scale by Business Metrics, Not Just CPU'. Notice how 'Queue depth' is a prime example of an effective scaling metric.
A Subtle Trap: Backlog vs. Throughput
You might wonder, "Why not scale on a throughput metric, like the number of messages acknowledged per second (subscription/ack_message_count)?" This seems intuitive, as higher throughput implies a heavier load. However, this approach can create a dangerous negative feedback loop.
Imagine your consumer pods encounter a temporary issue, like a database connection failure. Their ability to process and acknowledge messages will plummet.
- An HPA scaling on throughput would see the
ack_message_countdrop and incorrectly conclude that the load has decreased. It would scale down the number of consumers, worsening the backlog and potentially preventing the system from ever recovering. - An HPA scaling on backlog, however, would see
num_unacked_messagesbegin to climb. It would correctly conclude that the consumers are overwhelmed or stuck and scale up, providing more capacity to clear the backlog once the transient issue is resolved.
This is a critical distinction for building a resilient system.
Best practices for using Pub/Sub metrics as a scaling signal
Google's official documentation on this topic provides a clear warning against using throughput metrics for autoscaling subscribers. This is a crucial best practice.
Read the section titled 'Avoid using subscriber-side throughput metrics to autoscale subscribers'. The explanation of the 'self-referential loop' is key here.
The Solution Architecture
So, how do we connect our HPA to an external metric like the Pub/Sub backlog? The diagram below illustrates the architecture we are about to build.

This architecture leverages the External Metrics API we discussed in the last lesson. The Custom Metrics Stackdriver Adapter is the bridge that makes a metric from Google Cloud Monitoring available to your GKE cluster's HPA controller.
An Alternative: KEDA
It's worth noting a very popular open-source tool called KEDA (Kubernetes Event-driven Autoscaling) that is purpose-built for this scenario. KEDA acts as a highly sophisticated metrics adapter for the HPA, providing pre-built "scalers" for dozens of event sources, including Pub/Sub. It simplifies the setup and adds powerful features like scaling to and from zero replicas.
Scaling Explained Through Kubernetes HPA, VPA, KEDA & Cluster Autoscaler
This video clip gives a concise overview of KEDA and how it solves the problem of scaling based on event sources like message queues.
Watch from 16:13 to 17:59. This will give you context on KEDA as a powerful alternative. It extends the HPA to use a vast array of external triggers without you needing to configure the metric adapters manually.
For this course, we will proceed with the GKE-native approach using the Stackdriver adapter, as it builds directly on your existing cloud infrastructure. However, understanding KEDA is valuable as it represents an industry-standard pattern for this problem.
Conclusion
You now have the full justification for the path we are about to take. Scaling your Pub/Sub consumer requires a more nuanced approach than simply monitoring CPU or memory.
Key Takeaways:
- Standard metrics like CPU and memory are often poor proxies for the actual load on an event-driven application, creating "metric blind spots."
- For queue-based workloads, the most effective scaling signal is the backlog (e.g.,
num_undelivered_messages), as it directly reflects the pending work. - Scaling on throughput metrics (e.g.,
ack_message_count) is risky, as it can create negative feedback loops that destabilize your system during periods of high load or partial failure. - The solution is to use the HPA with an external metric representing the queue backlog, which is made available to Kubernetes via a metrics adapter.
This lesson completes the foundational module of our course. We have established what we need to measure, how the scaling mechanism works, and why we must use a custom, workload-aware metric.
In our next lesson, we will begin Module 2 by getting our hands dirty. You will install and configure the Custom Metrics Stackdriver Adapter, the critical component that will expose your Pub/Sub backlog metric to the HPA.
Can't find a good explanation? Sign up and we'll make it for you
Sign up