
Introduction
In our last session, we focused on measuring your application's performance using kubectl top and kubectl describe. This gave you the tools to inspect real-time resource usage and compare it against the configured requests and limits, a crucial first step in right-sizing your service.
Now, we move from measurement to reaction. This lesson introduces the Horizontal Pod Autoscaler (HPA), the core Kubernetes component responsible for automatically scaling your application. Our goal is to understand its underlying mechanism: how it decides when to scale, by how much, and what data it uses to make those decisions.
Think of this as dissecting the control system that you will later configure to manage your Pub/Sub consumer. Grasping the HPA's control loop and scaling algorithm is essential for building a robust and responsive autoscaling strategy.
The Horizontal Pod Autoscaler: What It Is and How It Works
At its core, the Horizontal Pod Autoscaler is a feedback control loop. It periodically observes a metric, compares it to a desired target, and adjusts the number of pod replicas for a workload (like a Deployment) to move the metric closer to that target.
The HPA has two parts:
- An API Resource: A YAML object where you declaratively define your scaling rules (e.g., target metric, min/max replicas).
- A Controller: A process running in the Kubernetes control plane that enacts the rules defined in the API resource.
To start, let's watch a brief overview of what the HPA is and where it fits within the Kubernetes ecosystem.
Kubernetes Autoscaling: HPA vs. VPA vs. Keda vs. CA vs. Karpenter vs. Fargate
This clip from the video 'Kubernetes Autoscaling' introduces the HPA as a controller that runs within the Kubernetes control plane to adjust the scale of a target like a Deployment.
Watch from 01:39 to 02:16. The key takeaway is that the HPA is a built-in Kubernetes component that acts on metrics to change the replica count of a workload.
Now, let's look at the mechanics of the control loop itself.
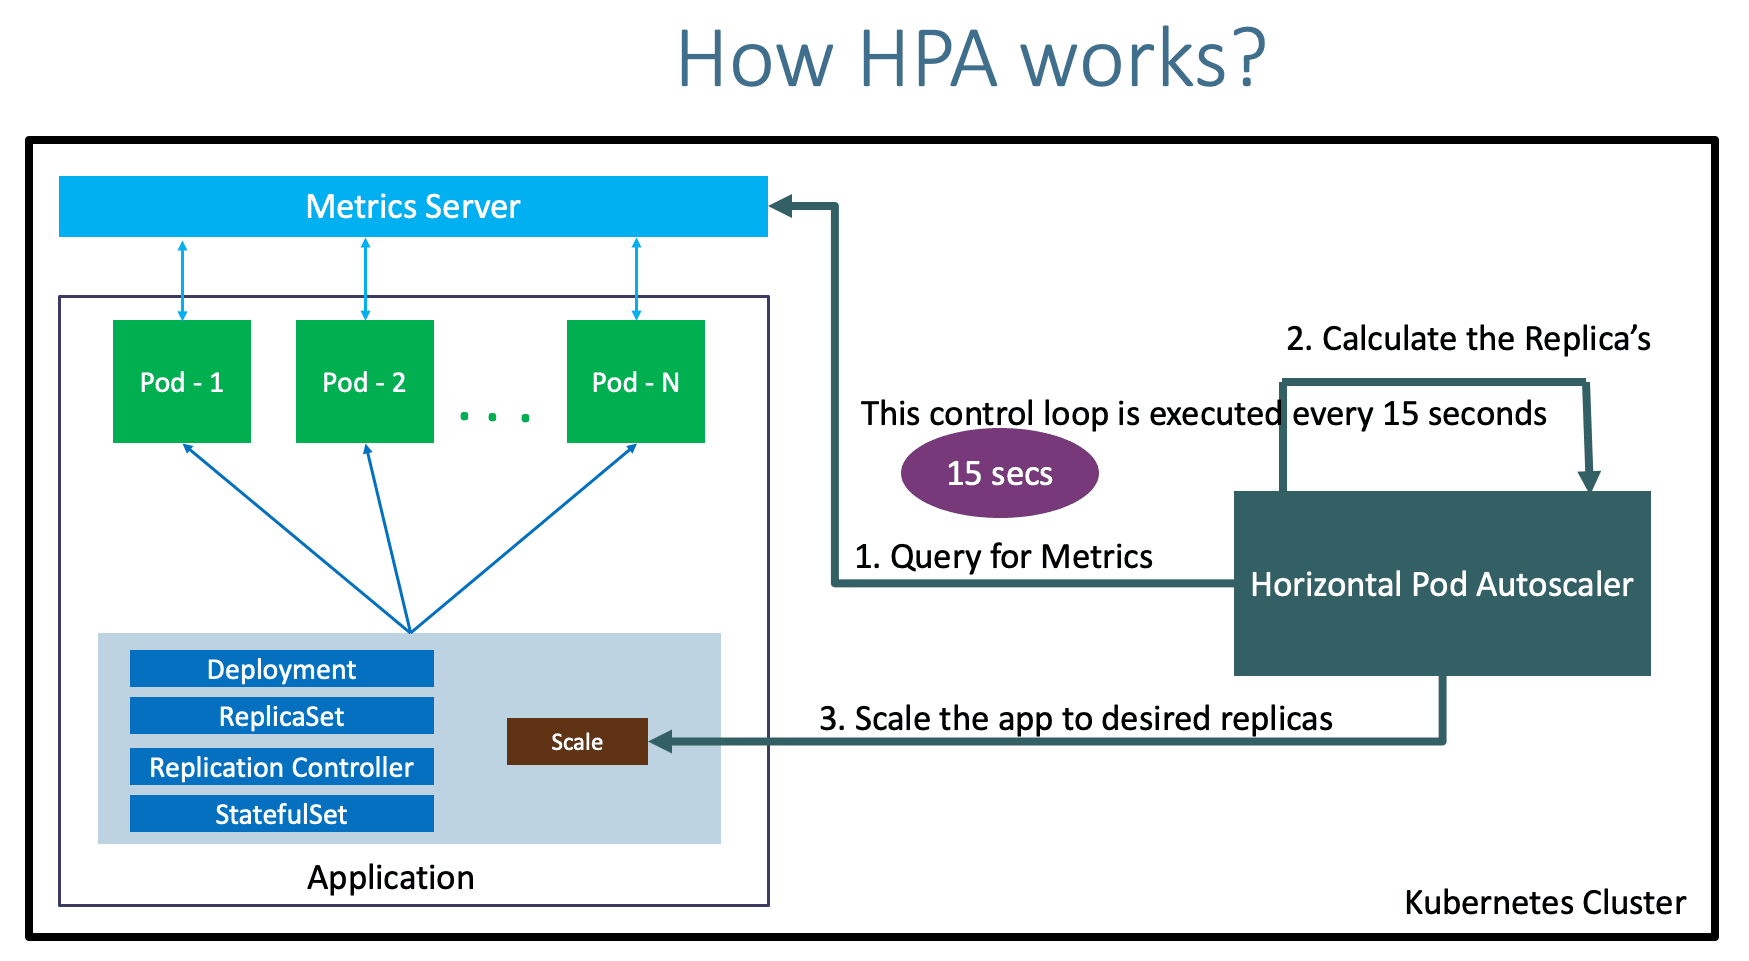
The official Kubernetes documentation provides the most precise description of this process.
Horizontal Pod Autoscaling - Kubernetes
Please read the following sections from the official Kubernetes documentation on Horizontal Pod Autoscaling. This will explain the control loop in detail.
Read the introductory section and the section titled 'How does a HorizontalPodAutoscaler work?'. Pay close attention to the –horizontal-pod-autoscaler-sync-period parameter, which defines the frequency of the control loop.
This mechanism involves a few key components working in concert, which are well-visualized in the next video.
This segment provides a clear architectural view of the control loop, showing how metrics flow from the pods up to the HPA controller.
Watch from 03:22 to 04:47. Focus on the data flow: cAdvisor collects metrics, the Metrics Server aggregates them, and the HPA Controller queries the API server to get these metrics.
The Scaling Algorithm
Given your background in statistics and econometrics, you'll appreciate that the HPA's logic is not a black box. It's a straightforward proportional controller. The controller uses a simple ratio to determine the new number of replicas.
The core formula is:
For instance, if you have 4 replicas, your target CPU is 50%, and the current average CPU across all pods is 100%, the calculation would be:ceil(4 * (100 / 50)) = ceil(4 * 2) = 8. The HPA would scale your deployment to 8 replicas.
The following resource details this algorithm and also discusses important edge cases, such as how it handles missing metrics or pods that are not yet ready.
Horizontal Pod Autoscaling - Kubernetes
Let's dive into the specifics of the scaling formula and the logic behind it from the official documentation.
Read the section 'Algorithm details'. This explains the core formula and, importantly, the conservative approach the controller takes when data is incomplete, which is key to preventing unstable scaling behavior.
The Source of Truth: Metrics APIs
The HPA is only as good as the data it receives. It gets this data by querying a set of specialized APIs within the cluster. Understanding these APIs is the key to unlocking scaling based on your Pub/Sub backlog.
There are three main metrics APIs the HPA can use:
- Resource Metrics API (
metrics.k8s.io): This provides CPU and memory usage for pods and nodes. It's provided by the Metrics Server we discussed in the previous lesson. - Custom Metrics API (
custom.metrics.k8s.io): This exposes arbitrary metrics associated with Kubernetes objects, like "requests per second" for a specific pod. This requires an "adapter" that knows how to collect these metrics from a monitoring system like Prometheus. - External Metrics API (
external.metrics.k8s.io): This exposes metrics for things that live outside the Kubernetes cluster. This is exactly what we need for thenum_undelivered_messagesof a Google Cloud Pub/Sub subscription. This also requires an adapter.
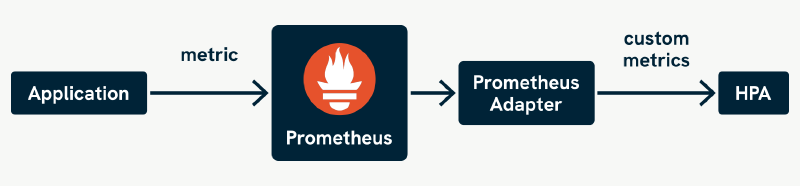
The following reading explains these APIs and how they enable advanced scaling scenarios beyond simple CPU and memory.
K8s scaling guide : horizontal pod autoscaling and workloads ...
This article from Kubegrade gives a good overview of how custom metrics enable more intelligent scaling. This directly relates to your goal of scaling on a business-logic metric.
Read the section 'Custom metrics integration for advanced scaling'. Focus on the role of the custom.metrics.k8s.io API and the concept of a metrics provider/adapter.
Scaling on Multiple Metrics
You can configure an HPA to watch multiple metrics simultaneously (e.g., CPU utilization and Pub/Sub queue length). In this case, the HPA calculates the desiredReplicas for each metric independently and then chooses the maximum of the calculated values. This ensures your application always has enough replicas to handle the most constrained resource or bottleneck.
Horizontal Pod Autoscaling - Kubernetes
The official documentation explains this 'pick the max' behavior.
Read the short section 'Scaling on multiple metrics'.
Fine-Tuning: Stabilization and Scaling Behavior
A naive control loop can lead to "flapping" or "thrashing," where the replica count rapidly fluctuates. This is inefficient and can destabilize your service. To prevent this, the HPA includes features to dampen its reactions.
- Stabilization Window: When metrics suggest scaling down, the HPA looks at the desired states over a configurable window (e.g., the last 5 minutes) and uses the highest recommendation from that period. This prevents it from scaling down immediately after a temporary spike has passed.
- Scaling Policies: You can control the rate of change. For example, you can specify that the HPA can add a maximum of 4 pods per minute or remove at most 10% of the pods per minute.
- Tolerance: A threshold (defaulting to 10%) to prevent scaling actions for minor metric fluctuations around the target.
These controls allow you to tune the responsiveness and stability of the autoscaler, which is critical in a production environment.
Horizontal Pod Autoscaling - Kubernetes
This section of the documentation covers the advanced behaviors you can configure to ensure smooth and stable scaling.
Read the section 'Configurable scaling behavior'. Focus on understanding the concepts of 'Scaling policies' and the 'Stabilization window'.
Conclusion
In this lesson, we dissected the mechanism of the Horizontal Pod Autoscaler. You now understand that it's not magic, but a well-defined control system that you can configure and tune.
Key Takeaways:
- The HPA is a control loop that runs every 15-30 seconds, comparing a current metric value to a desired target.
- It uses a simple proportional scaling algorithm (
desiredReplicas = ceil(currentReplicas * (current / desired))) to calculate the required number of pods. - The HPA gets its data from different metrics APIs: resource (
metrics.k8s.io), custom (custom.metrics.k8s.io), and external (external.metrics.k8s.io). - To prevent instability, the HPA includes stabilization windows and configurable scaling policies to dampen its reactions and control the rate of scaling.
- When multiple metrics are used, the HPA scales to meet the demand of the most demanding metric.
We've established how the HPA works. The critical missing piece for your goal is the data source. In our next lesson, we will bridge this gap by installing and configuring the Custom Metrics Stackdriver Adapter. This will expose your Pub/Sub subscription's num_undelivered_messages metric to the HPA, allowing you to finally build an autoscaler that reacts directly to your message backlog.
Can't find a good explanation? Sign up and we'll make it for you
Sign up