Introduction
Welcome back. In our previous lesson, you successfully loaded and ran the Phi-3-mini model on your GPU, and we made a rough, back-of-the-envelope calculation that the model weights should consume about 7.6 GB of VRAM. While useful for quick estimates, this is just the beginning of the story. To truly understand and optimize system performance, we must move from estimation to precise measurement.
This lesson focuses on the learning outcome: to profile GPU memory usage and utilization during inference using nvidia-smi and PyTorch CUDA utilities. We'll use your serve_phi3.py script as a live testbed to answer critical questions:
- How much VRAM is actually being used, and where does it all go?
- Is the GPU working hard during inference, or is it sitting idle?
- How does memory usage change dynamically during a single request?
We will explore a hierarchy of tools, starting with a high-level command-line utility and moving to sophisticated, in-code profilers. This process is fundamental to building the request-to-token mental model, as it connects your Python code directly to the hardware's behavior.
1. The Command-Line Health Check: nvidia-smi
The first and simplest tool in any GPU developer's toolkit is the NVIDIA System Management Interface (nvidia-smi). It provides a real-time snapshot of the state of your GPU(s).
To see it in action, open a terminal window (ensure your llm-systems Conda environment is not active in this one, as we just need the system command). Run the following to start a live-monitoring session that updates every second:
nvidia-smi -l 1
You'll see a dashboard showing metrics for your GPU. Now, open a second terminal, activate your Conda environment, and run the serve_phi3.py script from the previous lesson.
conda activate llm-systems
python serve_phi3.py
As the script runs, watch the nvidia-smi output. You should observe several key metrics:
- Memory-Usage: You'll see this jump significantly as the model is loaded. Compare the "Used" memory value to our 7.6 GB estimate. It will be higher. Why? This total includes not just the model weights, but also the CUDA context, framework overhead, and memory for activations, which we'll dissect later.
- GPU-Util: This percentage represents how busy the GPU's processing cores are. You'll likely see it spike during the model loading and inference phases.
- Pwr:Usage/Cap: This shows how much power the GPU is drawing relative to its maximum capacity. It's another indicator of how hard the GPU is working.
PyTorch GPU Optimization: Step-by-Step Guide
This article provides a concise guide on what to look for when using nvidia-smi for a quick performance check.
Read the first section, '1. Quick Health Check on your Terminal'. Focus on the general rules of thumb for interpreting GPU Util, Memory Util, and Power usage.
nvidia-smi is excellent for a high-level, "is it on?" check, but it doesn't give us the internal story. It tells us that memory is being used, but not what is using it within our PyTorch application. For that, we need to go deeper.
2. Peeking Inside: PyTorch CUDA Memory Utilities
PyTorch doesn't just allocate and free GPU memory on demand. Direct calls to the CUDA driver (cudaMalloc, cudaFree) are slow. To improve performance, PyTorch uses a caching memory allocator.
Think of this like a custom memory pool in a high-performance C++ application. When your script needs GPU memory for a tensor, PyTorch asks the CUDA driver for a block. When the tensor is no longer needed (its reference count drops to zero), PyTorch doesn't immediately return the memory to the driver. Instead, it keeps the block in a "warm" cache, ready to be quickly reused for a future allocation.
This distinction leads to two key metrics:
- Allocated Memory: Memory currently occupied by active tensors.
- Reserved Memory: The total memory PyTorch has "reserved" from the GPU, including both allocated memory and cached, free blocks.
The nvidia-smi utility reports the reserved memory, which can be misleading. To get the real story, we can use PyTorch's built-in functions.
Memory Management Considerations - ApX Machine Learning
To understand these concepts better, please read this section on PyTorch's memory management.
Read the section 'The PyTorch Caching Memory Allocator'. Pay close attention to the descriptions of torch.cuda.memory_allocated() and torch.cuda.memory_reserved(), and study the provided code example that demonstrates the difference.
Hands-On: Instrumenting Your Script
Let's modify serve_phi3.py to programmatically measure memory usage. Create a copy named profile_memory.py and add the following helper function and print statements.
import torch
from transformers import AutoModelForCausalLM, AutoTokenizer, pipeline
import time

def print_gpu_memory_summary(stage_name):
    """Prints a summary of GPU memory usage at a given stage."""
    print(f"\n--- GPU Memory Summary at: {stage_name} ---")


    # `memory_allocated` is the memory occupied by tensors.
    allocated = torch.cuda.memory_allocated() / (1024**3)


    # `memory_reserved` is the total memory managed by the caching allocator.
    reserved = torch.cuda.memory_reserved() / (1024**3)
    print(f"Allocated: {allocated:.2f} GB")
    print(f"Reserved: {reserved:.2f} GB")


    # For a more detailed breakdown (useful for debugging fragmentation)
    # print(torch.cuda.memory_summary())
    print("------------------------------------------")

if not torch.cuda.is_available():
    raise SystemExit("No CUDA-enabled GPU found.")

print("GPU is available. Proceeding with model loading.")
print_gpu_memory_summary("Initial state")


# --- 1. Load Components ---
model_id = "microsoft/Phi-3-mini-4k-instruct"
tokenizer = AutoTokenizer.from_pretrained(model_id, trust_remote_code=True)

print(f"Loading model: {model_id}")
start_time = time.time()
model = AutoModelForCausalLM.from_pretrained(
    model_id,
    device_map="auto",
    torch_dtype="auto",
    trust_remote_code=True,
)
end_time = time.time()
print(f"Model loaded in {end_time - start_time:.2f} seconds.")
print_gpu_memory_summary("After model loading")


# --- 2. Create Pipeline ---
pipe = pipeline("text-generation", model=model, tokenizer=tokenizer)


# --- 3. Prepare Prompt ---
messages = [
    {"role": "user", "content": "Explain what happens when I run this Python script on my GPU, in detail."},
]
generation_args = {"max_new_tokens": 500, "return_full_text": False}


# --- 4. Run Inference ---
print("\nGenerating response...")


# Reset peak memory stats before the critical operation
torch.cuda.reset_peak_memory_stats()

start_time = time.time()
output = pipe(messages, **generation_args)
end_time = time.time()
print(f"Inference completed in {end_time - start_time:.2f} seconds.")


# `max_memory_allocated` gives the peak memory usage for tensors during the run.
peak_allocated = torch.cuda.max_memory_allocated() / (1024**3)
print_gpu_memory_summary("After inference")
print(f"\nPeak tensor memory during inference: {peak_allocated:.2f} GB")


# --- 5. Print Output ---
print("\nModel Output:")
print(output[0]['generated_text'])
Run this script: python profile_memory.py.
Analyze the output. You can now see the precise amount of memory allocated for tensors after loading and the peak tensor memory usage during inference. The peak during inference is higher because it includes the memory for activations and the KV cache, not just the weights.
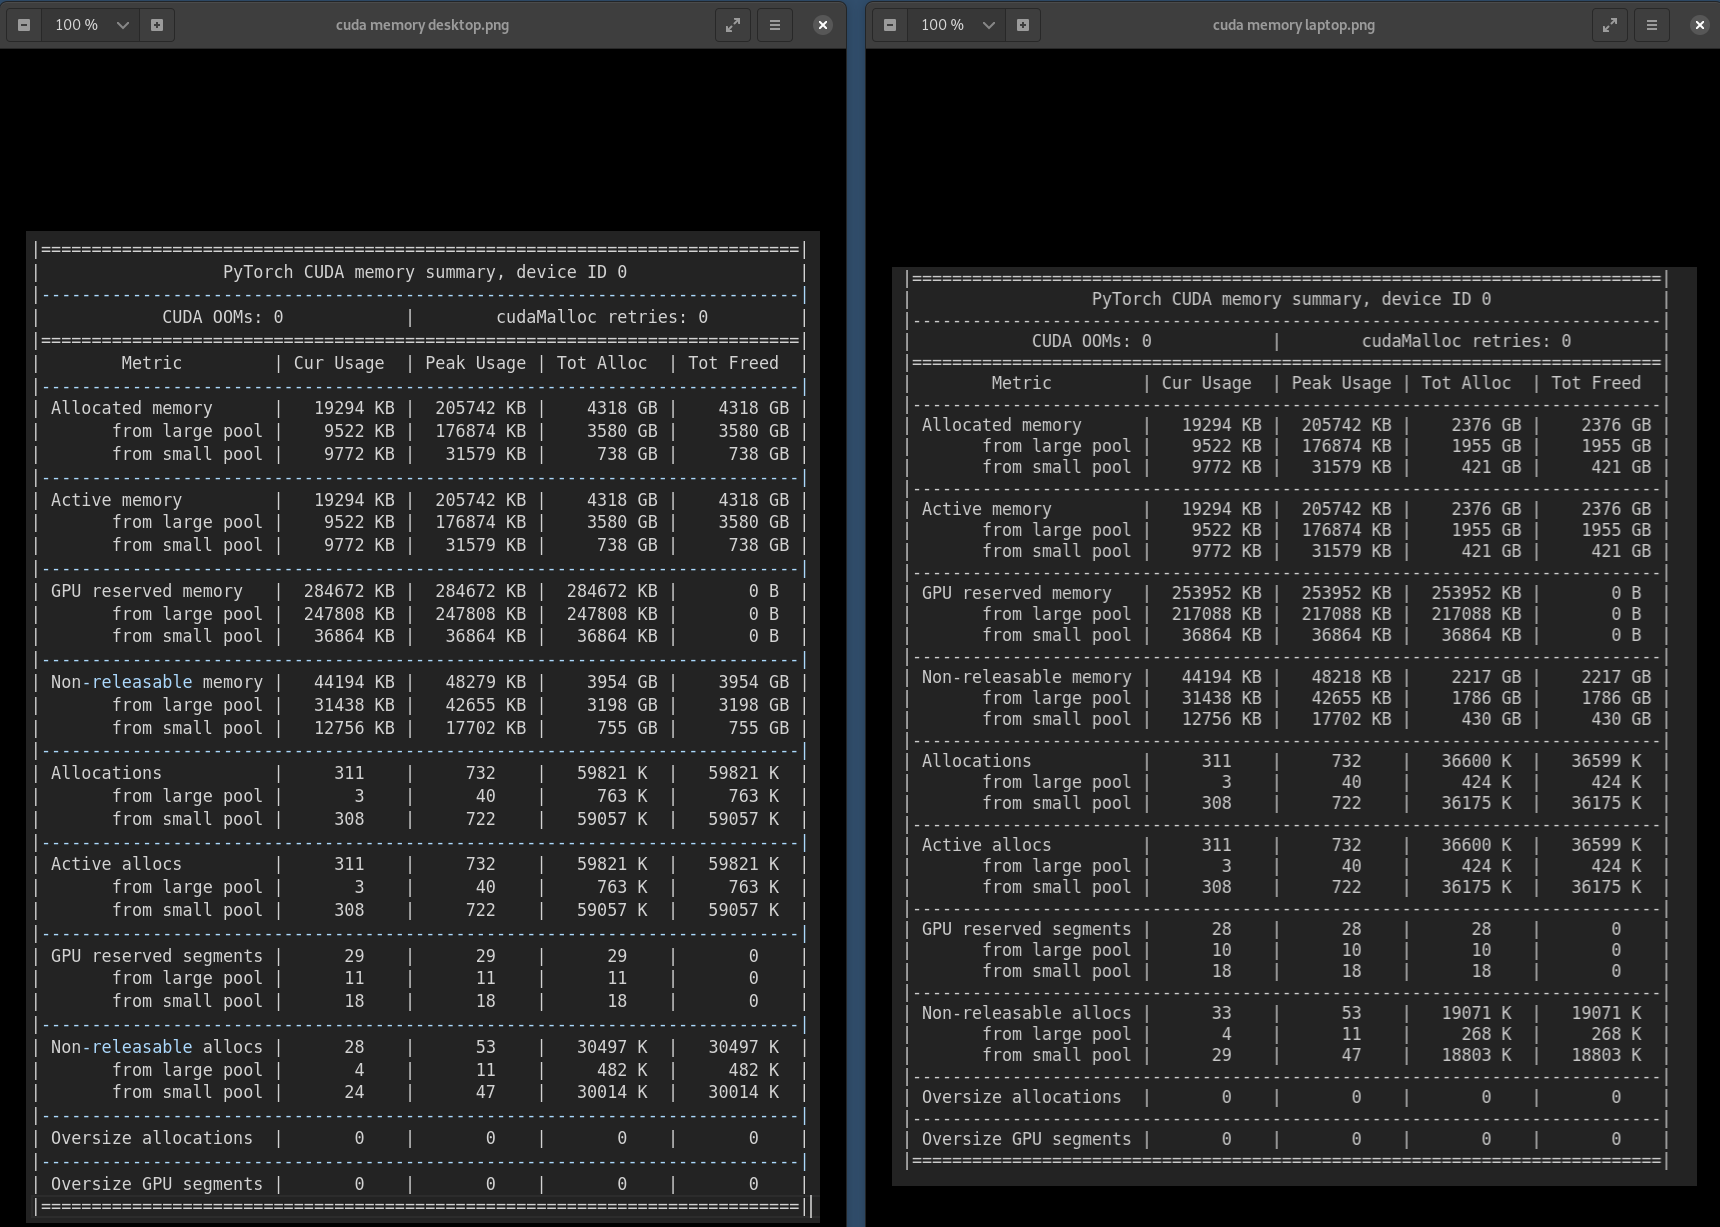
For an even more detailed report, you can uncomment print(torch.cuda.memory_summary()).
3. Timeline Analysis: torch.profiler
Our programmatic checks give us snapshots and peak values, but they don't show the dynamics of memory usage over time. Does memory grow steadily during generation? Are there sudden spikes? To see this, we need a timeline profiler.
PyTorch provides a powerful built-in profiler, torch.profiler, that can trace both CPU and CUDA activity, including memory allocations.
Lecture 16: On Hands Profiling
The following video gives a hands-on demonstration of several profiling tools. Let's start with the introduction to the PyTorch profiler and its ability to create a Chrome trace.
Watch the segment from 06:27 to 11:32. The presenter introduces the torch.profile.profile API and demonstrates how to interpret the resulting Chrome trace, showing the connection between CUDA kernels and the PyTorch operations in your source code.
Let's apply this to our script. Create a new file trace_memory.py and wrap the inference call with the profiler context manager.
import torch
from transformers import AutoModelForCausalLM, AutoTokenizer, pipeline
from torch.profiler import profile, record_function, ProfilerActivity


# ... (keep the rest of your script identical to profile_memory.py until step 4) ...


# --- 4. Run Inference with Profiler ---
print("\nGenerating response with profiler...")
messages = [
    {"role": "user", "content": "Explain what happens when I run this Python script on my GPU, in detail."},
]
generation_args = {"max_new_tokens": 500, "return_full_text": False}

with profile(
    activities=[ProfilerActivity.CPU, ProfilerActivity.CUDA],
    record_shapes=True,
    profile_memory=True, # Enable memory profiling
    with_stack=True
) as prof:
    with record_function("model_inference"): # Add a label to the trace
        output = pipe(messages, **generation_args)

print("Inference complete. Exporting trace...")


# Export the trace for viewing in Chrome
prof.export_chrome_trace("trace.json")
print("Trace exported to trace.json. Open it in chrome://tracing")


# You can also print a summary table to the console
print(prof.key_averages().table(sort_by="self_cuda_time_total", row_limit=10))


# ... (print output as before) ...
Run this script: python trace_memory.py. It will create a file named trace.json.
To view the trace:
- Open the Google Chrome browser.
- Navigate to the URL
chrome://tracing. - Click "Load" and select the
trace.jsonfile.
You will see a detailed timeline. Scroll down to find the [CUDA], CUDAMemory, and CUDALauncher sections. The CUDAMemory track is especially important for us. It shows a graph of memory usage over time.
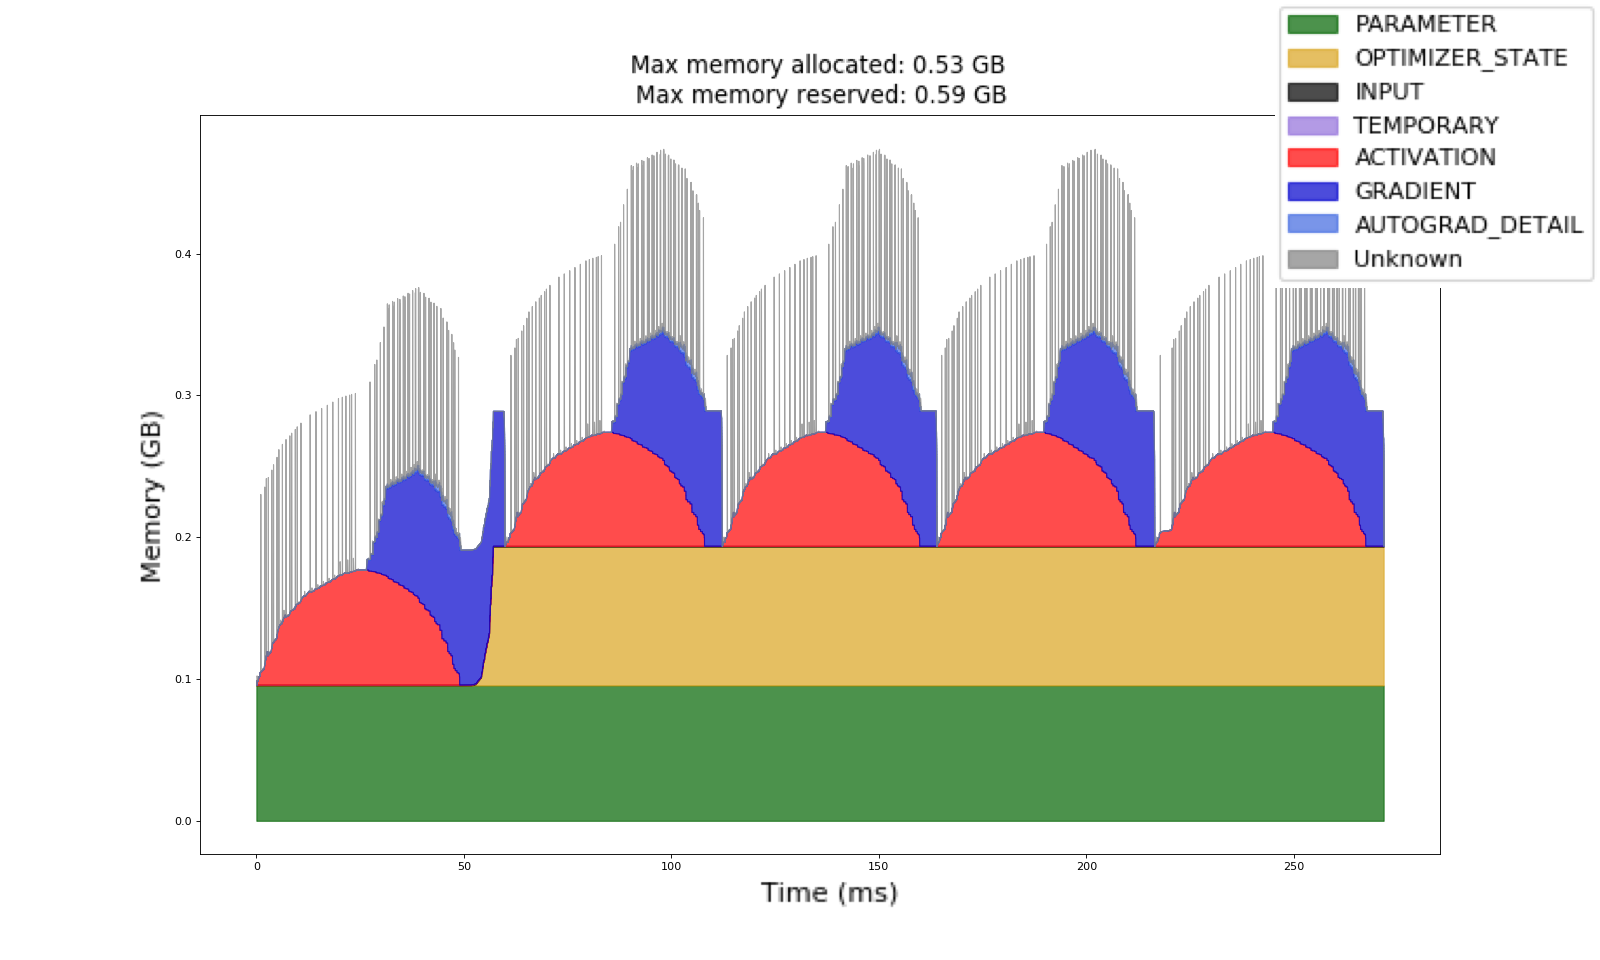
Explore the trace. You can zoom and pan. By clicking on events, you can see their duration and associated source code (if with_stack=True was used). You will likely see a stairstep pattern in the memory usage during generation, as each new token requires allocating more space in the KV cache.
Lecture 16: On Hands Profiling
For another perspective on diagnosing memory issues with the profiler, watch this segment. It shows how to use a lightweight memory profiler to spot anomalies like memory leaks caused by lingering Python references—a classic issue your CS background will appreciate.
Watch from 28:20 to 42:14. Focus on how the presenter uses a memory timeline plot to identify an uncharacteristic memory usage pattern and traces it back to a Python variable that isn't being garbage-collected as expected.
Conclusion
In this lesson, you have moved beyond simple estimation and learned to use the foundational tools for measuring and understanding LLM inference performance on a GPU.
Key Takeaways:
nvidia-smiis your first-pass tool for a live, high-level view of GPU utilization and total reserved memory.- PyTorch's Caching Allocator is a key performance feature. You must distinguish between
torch.cuda.memory_allocated()(active tensors) andtorch.cuda.memory_reserved()(total VRAM held by PyTorch). torch.cudautilities likememory_summary()andmax_memory_allocated()allow for precise, programmatic inspection of memory state at any point in your code.torch.profileris the definitive tool for creating a detailed timeline. It visualizes how memory and compute usage evolve over time, connecting low-level CUDA events back to your Python source code.
Preview of the Next Lesson:
You can now measure memory usage with precision. The next logical step is to understand why the numbers are what they are. In the next module, we will start building our LLM from scratch. We will first write functions to programmatically calculate the exact VRAM required for model weights, activations, and the KV cache based on a model's architecture. This will complete the loop from theory, to calculation, to measurement.