
Hello! Welcome back to our module on Marketing Mix Modeling (MMM).
In our last lesson, we decoded the primary outputs of an MMM, learning how to interpret contribution charts and response curves. We briefly touched on the idea that an MMM doesn't just use raw spend; it first transforms the data to reflect how marketing actually works in the real world. You learned that these transformations are called adstock and saturation.
Today, we will dive deep into these two fundamental concepts. Our goal is to explain exactly what adstock and saturation are, how they are modeled, and most importantly, how a firm grasp of these concepts is critical for making strategic budget planning decisions. This lesson will equip you to understand the "physics" behind the response curves and use that knowledge to guide your team's spending strategy.
1. Adstock: Modeling the Lingering Effect of Ads
Let's start with a simple truth: the impact of an advertisement doesn't vanish the moment the ad finishes airing or the impression is served. A memorable TV commercial or a compelling social media campaign can influence a customer's decision days or even weeks later. This lingering impact is known as the carryover effect, and in MMM, we model it using a technique called adstock.
The purpose of adstock is to transform a single point-in-time spend into a continuous effect that decays over time.
To see how this is calculated, let's revisit the PyMC-Labs guide we consulted in the previous lesson.
Marketing Mix Modeling : A Complete guide
This section of the PyMC-Labs article, 'Marketing Mix Modeling : A Complete guide,' provides a very clear explanation of adstock, including a simple formula and a table that illustrates the concept perfectly.
Please read the section titled 'Adstock'. Focus on understanding how the adstock at a given time is a combination of the current spend and a fraction of the previous period's adstock. The table example makes this very clear.
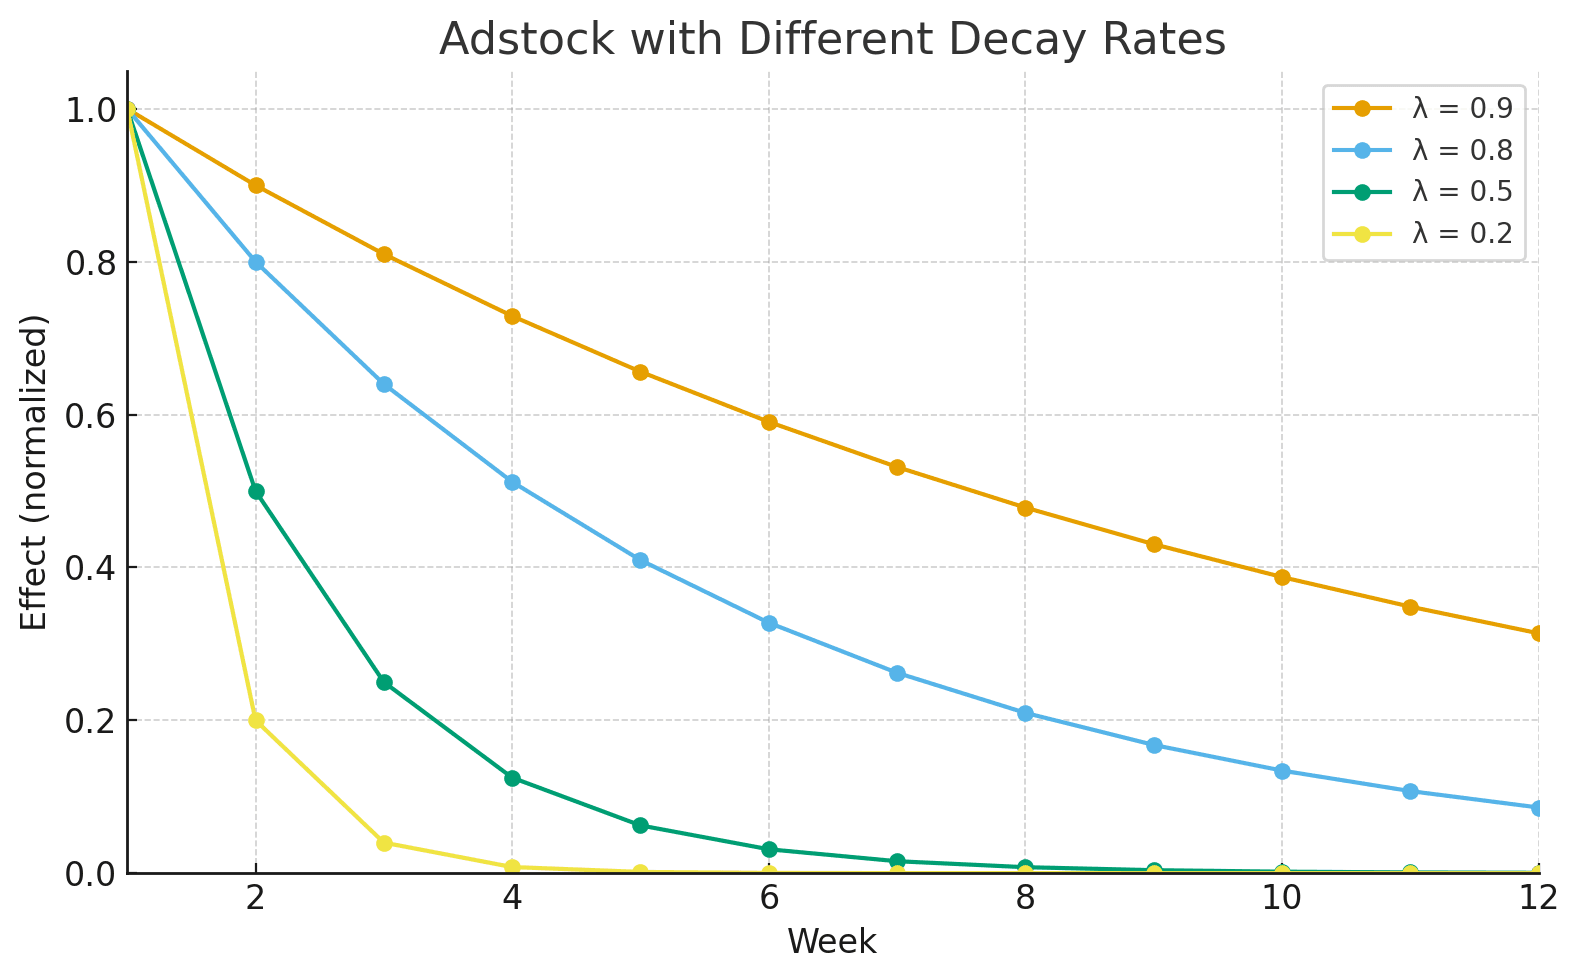
The key parameter in the adstock formula is the decay rate, often represented by lambda () or alpha (). This single number determines how "sticky" a channel's advertising is.
- A high decay rate (e.g., ) means the effect lingers for a long time. This is typical for channels like TV or out-of-home, which build brand memory.
- A low decay rate (e.g., ) means the effect fades quickly. This is common for direct-response channels like Branded Search, where the impact is immediate.
The image below visualizes this concept.
The Strategic Impact of Adstock on Budgeting
Understanding a channel's adstock is crucial for budget planning. It helps you answer questions about campaign frequency and flighting. Let's watch a short clip that explains the strategic implications.
A Bayesian Approach to Media Mix Modeling (Michael Johns & Zhenyu Wang)
In this segment from the 'A Bayesian Approach to Media Mix Modeling' talk by PyMC Developers, the speaker explains how to interpret adstock curves to make budgeting decisions.
Please watch from 00:25:19 to 00:26:56. Pay attention to the comparison between the channel with the long decay (red line) and the one with the short decay (blue line), and the strategic conclusion drawn for each.
As the speaker highlights, a channel with a long decay offers an opportunity for efficiency. You might not need to spend heavily every single week. Instead, you could "pulse" your spending, letting the carryover effect bridge the gaps, thereby "squeezing more efficiency" out of your budget. Conversely, for a channel with a very short decay, a consistent, "always-on" presence is necessary to maintain its impact.
2. Saturation: Modeling Diminishing Returns
The second critical concept is saturation, which is the formal term for diminishing returns. You know this intuitively: the first $10,000 you spend on a new campaign reaches the most receptive audience and yields a strong return. The next $10,000 is still effective, but slightly less so. As you keep spending, you start reaching people who are less interested or have already seen your ad multiple times, and each additional dollar brings back less and less.
To capture this, MMM applies a non-linear saturation function to the adstocked spend. This creates the "S-shaped" response curve we discussed in the last lesson.
Let's look at a clear written explanation of this.
Marketing Mix Modeling : A Complete guide
We'll turn again to the PyMC-Labs guide for its excellent, business-focused explanation of saturation.
Please read the section titled 'Saturation: Modeling Diminishing Returns'. The simple example of gaining fewer customers for each additional $10K of spend is a great illustration. Note the different types of functions used to model this effect.
Just like adstock, saturation curves are controlled by parameters. These parameters define how quickly the curve rises and where it flattens out.
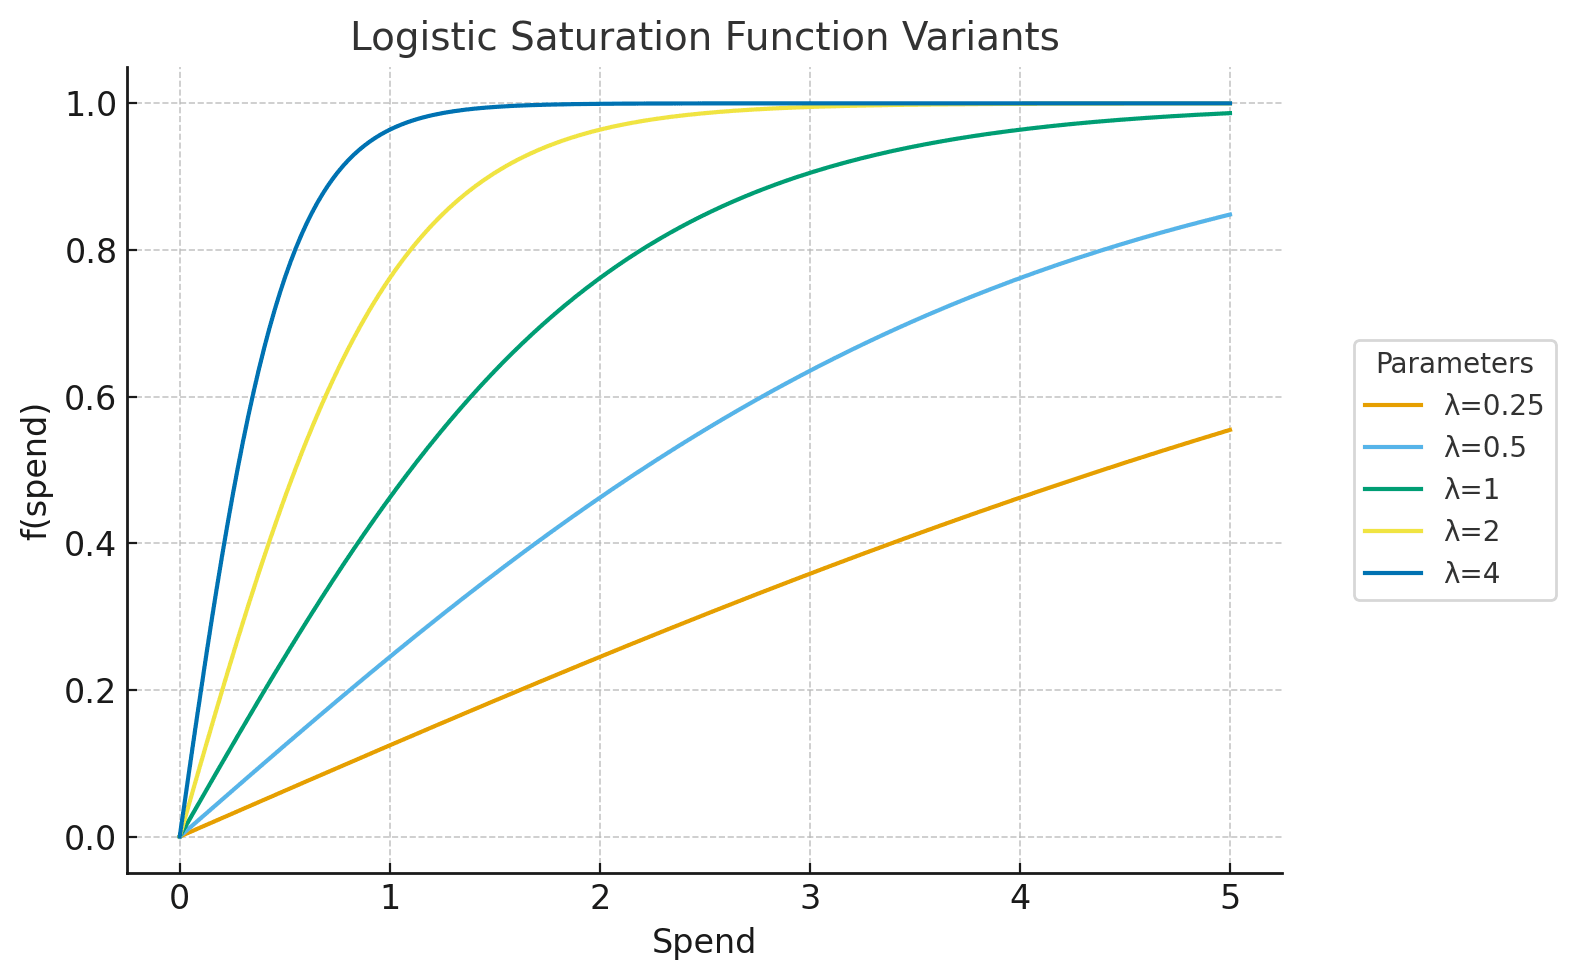
The Strategic Impact of Saturation on Budgeting
Saturation is the single most important concept for budget allocation. The saturation point on a response curve is a clear signal that a channel is becoming inefficient. It tells you where to stop spending.
This next video segment provides a perfect visual guide for how to interpret saturation curves from a strategic standpoint.
A Bayesian Approach to Media Mix Modeling (Michael Johns & Zhenyu Wang)
In this part of the same PyMC Developers talk, the speaker contrasts two channels: one with low saturation and one with high saturation.
Please watch from 00:23:50 to 00:25:19. Focus on what the shape of the curve tells you about whether a channel has 'room to grow' or is already hitting a point of inefficiency.
As a marketing leader, your job is to use these curves to guide investment:
- Low Saturation Channel: This is a growth opportunity. You can confidently increase the budget here because you are still on the steep, efficient part of the curve. Your marginal ROI is high.
- High Saturation Channel: This is a signal for optimization. While the channel might have a good average ROI, its marginal ROI is low. Continuing to pour money here is wasteful. The correct move is to cap spending at the "knee" of the curve and reallocate the excess budget to less saturated channels.
The documentation for Google's own MMM tool, Meridian, reinforces this exact point.
Interpret the visualizations | Meridian
This excerpt from Google's Meridian documentation explains how marketers should use response curves.
Please read the section 'Response curves'. Note how it explicitly recommends reallocating budget from a channel that is 'saturated or near saturation' to one that is 'well below saturation'.
Test your understanding!
Your analytics team presents you with MMM results for two key channels:
- Channel A (e.g., TV): The model shows it has a very high adstock (slow decay) but is currently operating in a highly saturated part of its response curve.
- Channel B (e.g., Non-Brand Search): The model shows it has low adstock (fast decay) and is in the steep, unsaturated part of its response curve.
You have a fixed budget for the next quarter. How would you advise your team to adjust the spending strategy for these two channels?
Show answer
Here is a strategic approach based on the data:
-
For Channel A (TV): Because it is highly saturated, you should reduce the overall budget to avoid wasteful spending on the flat part of the curve. However, due to its high adstock, you don't need to spend every week. You can recommend a "pulsing" or "flighting" strategy, concentrating the reduced budget into specific weeks to maximize impact while letting the carryover effect maintain presence during off-weeks.
-
For Channel B (Non-Brand Search): Because it is unsaturated, it represents a growth opportunity. You should increase the budget allocation to this channel to capture more incremental sales efficiently. Due to its low adstock, this channel requires a consistent, "always-on" budget to maintain its impact.
This approach uses both adstock and saturation insights to create a more sophisticated budget plan than simply moving money from a "bad" channel to a "good" one.
3. Synthesis: From Theory to Actionable Budgets
We've now examined adstock and saturation separately. In practice, they work together. An MMM estimates the adstock decay rate and the saturation curve parameters for every channel simultaneously. These parameters are then used to build the final response curves and drive an optimization engine that recommends a new budget allocation.
The case study of how Bolt, the ride-sharing company, uses these principles is a powerful real-world example.
Marketing Mix Modeling : A Complete guide
The final section of the PyMC-Labs article you've been reading contains a short case study on Bolt. It's a perfect summary of how a modern company applies these concepts.
Please read the case study 'How Bolt built smarter budgeting with PyMC-Marketing'. Notice how they used models that accounted for adstock and saturation to 'identify plateau points' and design 'automated budget allocation strategies'.
Bolt's story encapsulates the strategic value of this lesson. By understanding the underlying physics of their marketing channels, they moved beyond simple ROI measurement to a dynamic, data-driven budgeting process that could adapt to different business goals. This is the level of strategic oversight you are aiming for.
Conclusion
Today we've unpacked the two most important transformations inside a Marketing Mix Model. They are not just technical details for data scientists; they are the conceptual engine for strategic budget optimization.
Key Takeaways:
- Adstock (Carryover Effect) models the delayed impact of advertising. Understanding a channel's adstock helps you plan campaign frequency and timing to maximize efficiency.
- Saturation (Diminishing Returns) models the "S-shaped" response of marketing spend. It is the key to identifying the point of inefficiency and knowing when to stop investing in a channel.
- Impact on Budgeting: Together, adstock and saturation provide a sophisticated framework for budget allocation. They allow you to decide not only how much to spend (from saturation curves) but also how often to spend it (from adstock decay).
Preview of the Next Lesson:
Now that you have a firm grasp of contribution, response curves, adstock, and saturation, we are ready to put it all into practice. In our next lesson, we will focus on how to use MMM-derived response curves to inform optimal budget allocation across channels, moving from interpretation to active scenario planning.