
Hello! In the previous lesson, you checked that a benchmark performs the intended work on every iteration. Now you can use its report to answer two questions: how much time does one operation take, and how much memory does it allocate?
We’ll use the CLI processing benchmark you built earlier as the main reference point. Allow about 35–40 minutes to read the documentation, inspect a report, and run your benchmark.
Start with the meaning of “one operation”
In a Go benchmark, an operation is one iteration of the benchmark loop. For your BenchmarkProcessLabels, that iteration creates fresh input and output streams and calls ProcessLabels once. Its reported cost therefore includes those fresh streams as well as the processing call. That is the boundary you chose; the report cannot separate the costs for you.
The official testing package documentation shows the benchmark form, the command that runs it, and a sample result. It also documents the switch for reporting allocations.
Read the Go team's testing documentation to connect the benchmark loop you already know to the numbers printed by go test.
In the “Benchmarks” section, start at the paragraph beginning “Functions of the form.” Read the sample and explanation, paying particular attention to what the iteration count and ns/op describe. Then find the “ReportAllocs” method entry and read its explanation. Notice the distinction between enabling allocation reporting for one benchmark and enabling it for the command.
From the directory containing your CLI benchmark, run:
go test -run '^$' -bench '^BenchmarkProcessLabels$' -benchmem
Here, -bench selects the benchmark by name, while -benchmem adds memory-allocation columns. The -run '^$' pattern skips ordinary test functions for this measurement command; run your correctness tests separately. This command assumes the Go 1.24+ b.Loop() benchmark from the preceding lessons.
Read the three per-operation figures
The annotated report below contains two benchmark rows. Read across either row: the iteration count comes first, followed by time, allocated bytes, and allocation count per operation.
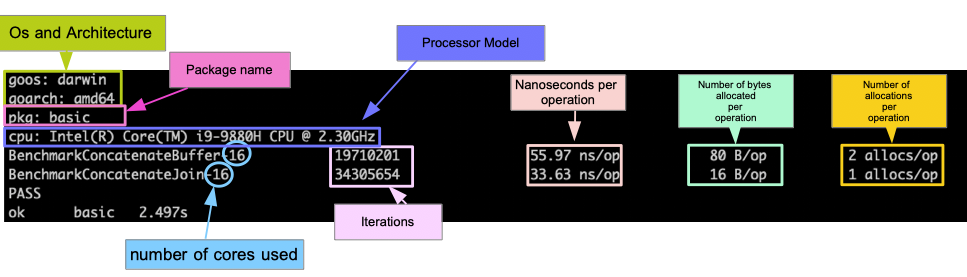
Suppose a row reports 19710201 iterations, 55.97 ns/op, 80 B/op, and 2 allocs/op. Interpret it this way:
ns/opis the measured benchmark time divided by the number of operations. Here, the average is about 55.97 nanoseconds for one iteration of that benchmark’s timed work. It is not a latency percentile or a measure of CPU time.B/opis the total bytes allocated during measurement divided by the number of operations. It measures allocation activity, not how many bytes remain in use afterward.allocs/opis the number of allocation events divided by the number of operations. Two allocations totaling 80 bytes and one allocation totaling 80 bytes have the sameB/opbut differentallocs/op.
The count of iterations is chosen by the benchmark framework to obtain a useful timing measurement; it is not throughput. Likewise, the final ok line reports the overall command’s duration, not the cost of one operation. The -16 appended to a benchmark name denotes the run’s GOMAXPROCS setting. It does not establish that 16 physical cores performed the work.
The testing documentation also gives the calculations behind the two allocation columns:
Return to the testing documentation for the definitions behind B/op and allocs/op. You do not need to write code using BenchmarkResult for this lesson.
Under “BenchmarkResult,” find the “AllocedBytesPerOp” method and read the bytes calculation. Then find “AllocsPerOp” and read the allocation calculation. In both cases, identify the total being divided by the iteration count.
These are per-operation averages, not a record of every individual iteration. A displayed 0 allocs/op does not prove that the entire program never allocates: work outside the measured boundary is not part of that figure, and per-operation allocation counts are reported as integers. Similarly, 0 B/op does not mean the operation uses no memory; it may use existing or stack memory without making a measured heap allocation.
Choose how to request allocation reporting
Use -benchmem when you want the allocation columns for every benchmark selected by the command. If you want them for just one benchmark, call b.ReportAllocs() in that benchmark instead. For example, this independent benchmark requests its own allocation report:
package labels

import (
	"strings"
	"testing"
)

func BenchmarkJoinLabels(b *testing.B) {
	parts := []string{"blue", "green", "red"}
	b.ReportAllocs()

	var last string
	for b.Loop() {
		last = strings.Join(parts, ",")
	}

	if last != "blue,green,red" {
		b.Fatalf("unexpected result: %q", last)
	}
}
You could run it without -benchmem:
go test -run '^$' -bench '^BenchmarkJoinLabels$'
The slice setup and final result check are outside the b.Loop() timing; the strings.Join call is the operation being measured. This example also shows why the columns must be read together. A change that reduces allocs/op is not automatically a time improvement, and a change that reduces ns/op might allocate more bytes. First decide which cost matters for your workload, then compare equivalent benchmark operations.
For your CLI benchmark, keep the measurement boundary in view when interpreting B/op: fresh readers, buffers, and their contents may contribute to it. A low allocation number achieved by reusing a consumed reader or accumulating output in one buffer would describe a different operation, not necessarily a better implementation of the original one.
Takeaways
Go’s benchmark report gives an iteration count and averages for timed nanoseconds (ns/op), allocated bytes (B/op), and allocation events (allocs/op). Use -benchmem for a selected command or b.ReportAllocs() for an individual benchmark. Always interpret the figures alongside the code that defines one operation and its measurement boundary.
Next, you’ll run benchmarks repeatedly and use benchstat to judge whether an apparent difference is credible rather than treating one pair of reported numbers as a verdict.