
Hello! Welcome to your next lesson on Medical Instrumentation.
In our last session, we focused on calculating heart rate from the heart's electrical signal, the ECG. We learned how to find both instantaneous and average heart rate by analyzing the R-R interval on a standardized grid.
Today, we'll explore a different, non-electrical method that you've undoubtedly seen in action on smartwatches and fitness trackers: those flashing green lights. This lesson fulfills the learning outcome: Describe the principles of photoplethysmography (PPG) for heart rate monitoring.
We will dive into how light can be used to "see" your pulse, what the resulting signal looks like, and the engineering principles behind designing these sensors. This is a crucial topic for you, as PPG is a cornerstone of most wearable devices, including those used for tracking physiological signs of stress and arousal at your startup, Neuraease.
1. The Core Idea: Seeing the Pulse with Light
Before we get into the technical details, let's build some intuition. At its heart, PPG is about detecting the tiny changes in skin color that occur with every heartbeat as blood rushes through your arteries. While these changes are invisible to the naked eye, a camera or a simple light sensor can pick them up.
The following video from Steve Mould provides an excellent, non-technical introduction to this concept.
The bizarre flashing lights on a smartwatch
Watch the beginning of this video, 'The bizarre flashing lights on a smartwatch,' to see a fun demonstration of detecting a heartbeat using just a camera and some software.
Please watch from 00:21 to 01:03. This will give you an intuitive feel for how changes in light can be related to the pulse.
The fundamental principle is this:
- A light source (usually an LED) illuminates a patch of skin.
- A light detector (a photodiode) measures how much light is reflected back or passes through the tissue.
- With each heartbeat (systole), your arteries fill with more blood, absorbing more light.
- Between beats (diastole), the blood volume decreases, and less light is absorbed.
- This rhythmic change in light absorption creates a signal that mirrors your heart rate.
2. The PPG Signal: AC and DC Components
The signal generated by a PPG sensor is not purely from the pulsing blood. It's a composite signal made up of two main parts:
- DC (Direct Current) Component: A large, steady signal caused by the constant absorption of light by static tissues like skin, bone, muscle, and the non-pulsating part of your blood (venous and arterial).
- AC (Alternating Current) Component: A small, pulsatile signal that rides on top of the DC component. This is the signal of interest, as it's caused by the change in blood volume in your arteries with each heartbeat.
The heart rate is derived from the frequency of this AC component.

This principle can be applied in two main ways: transmissive and reflective PPG.
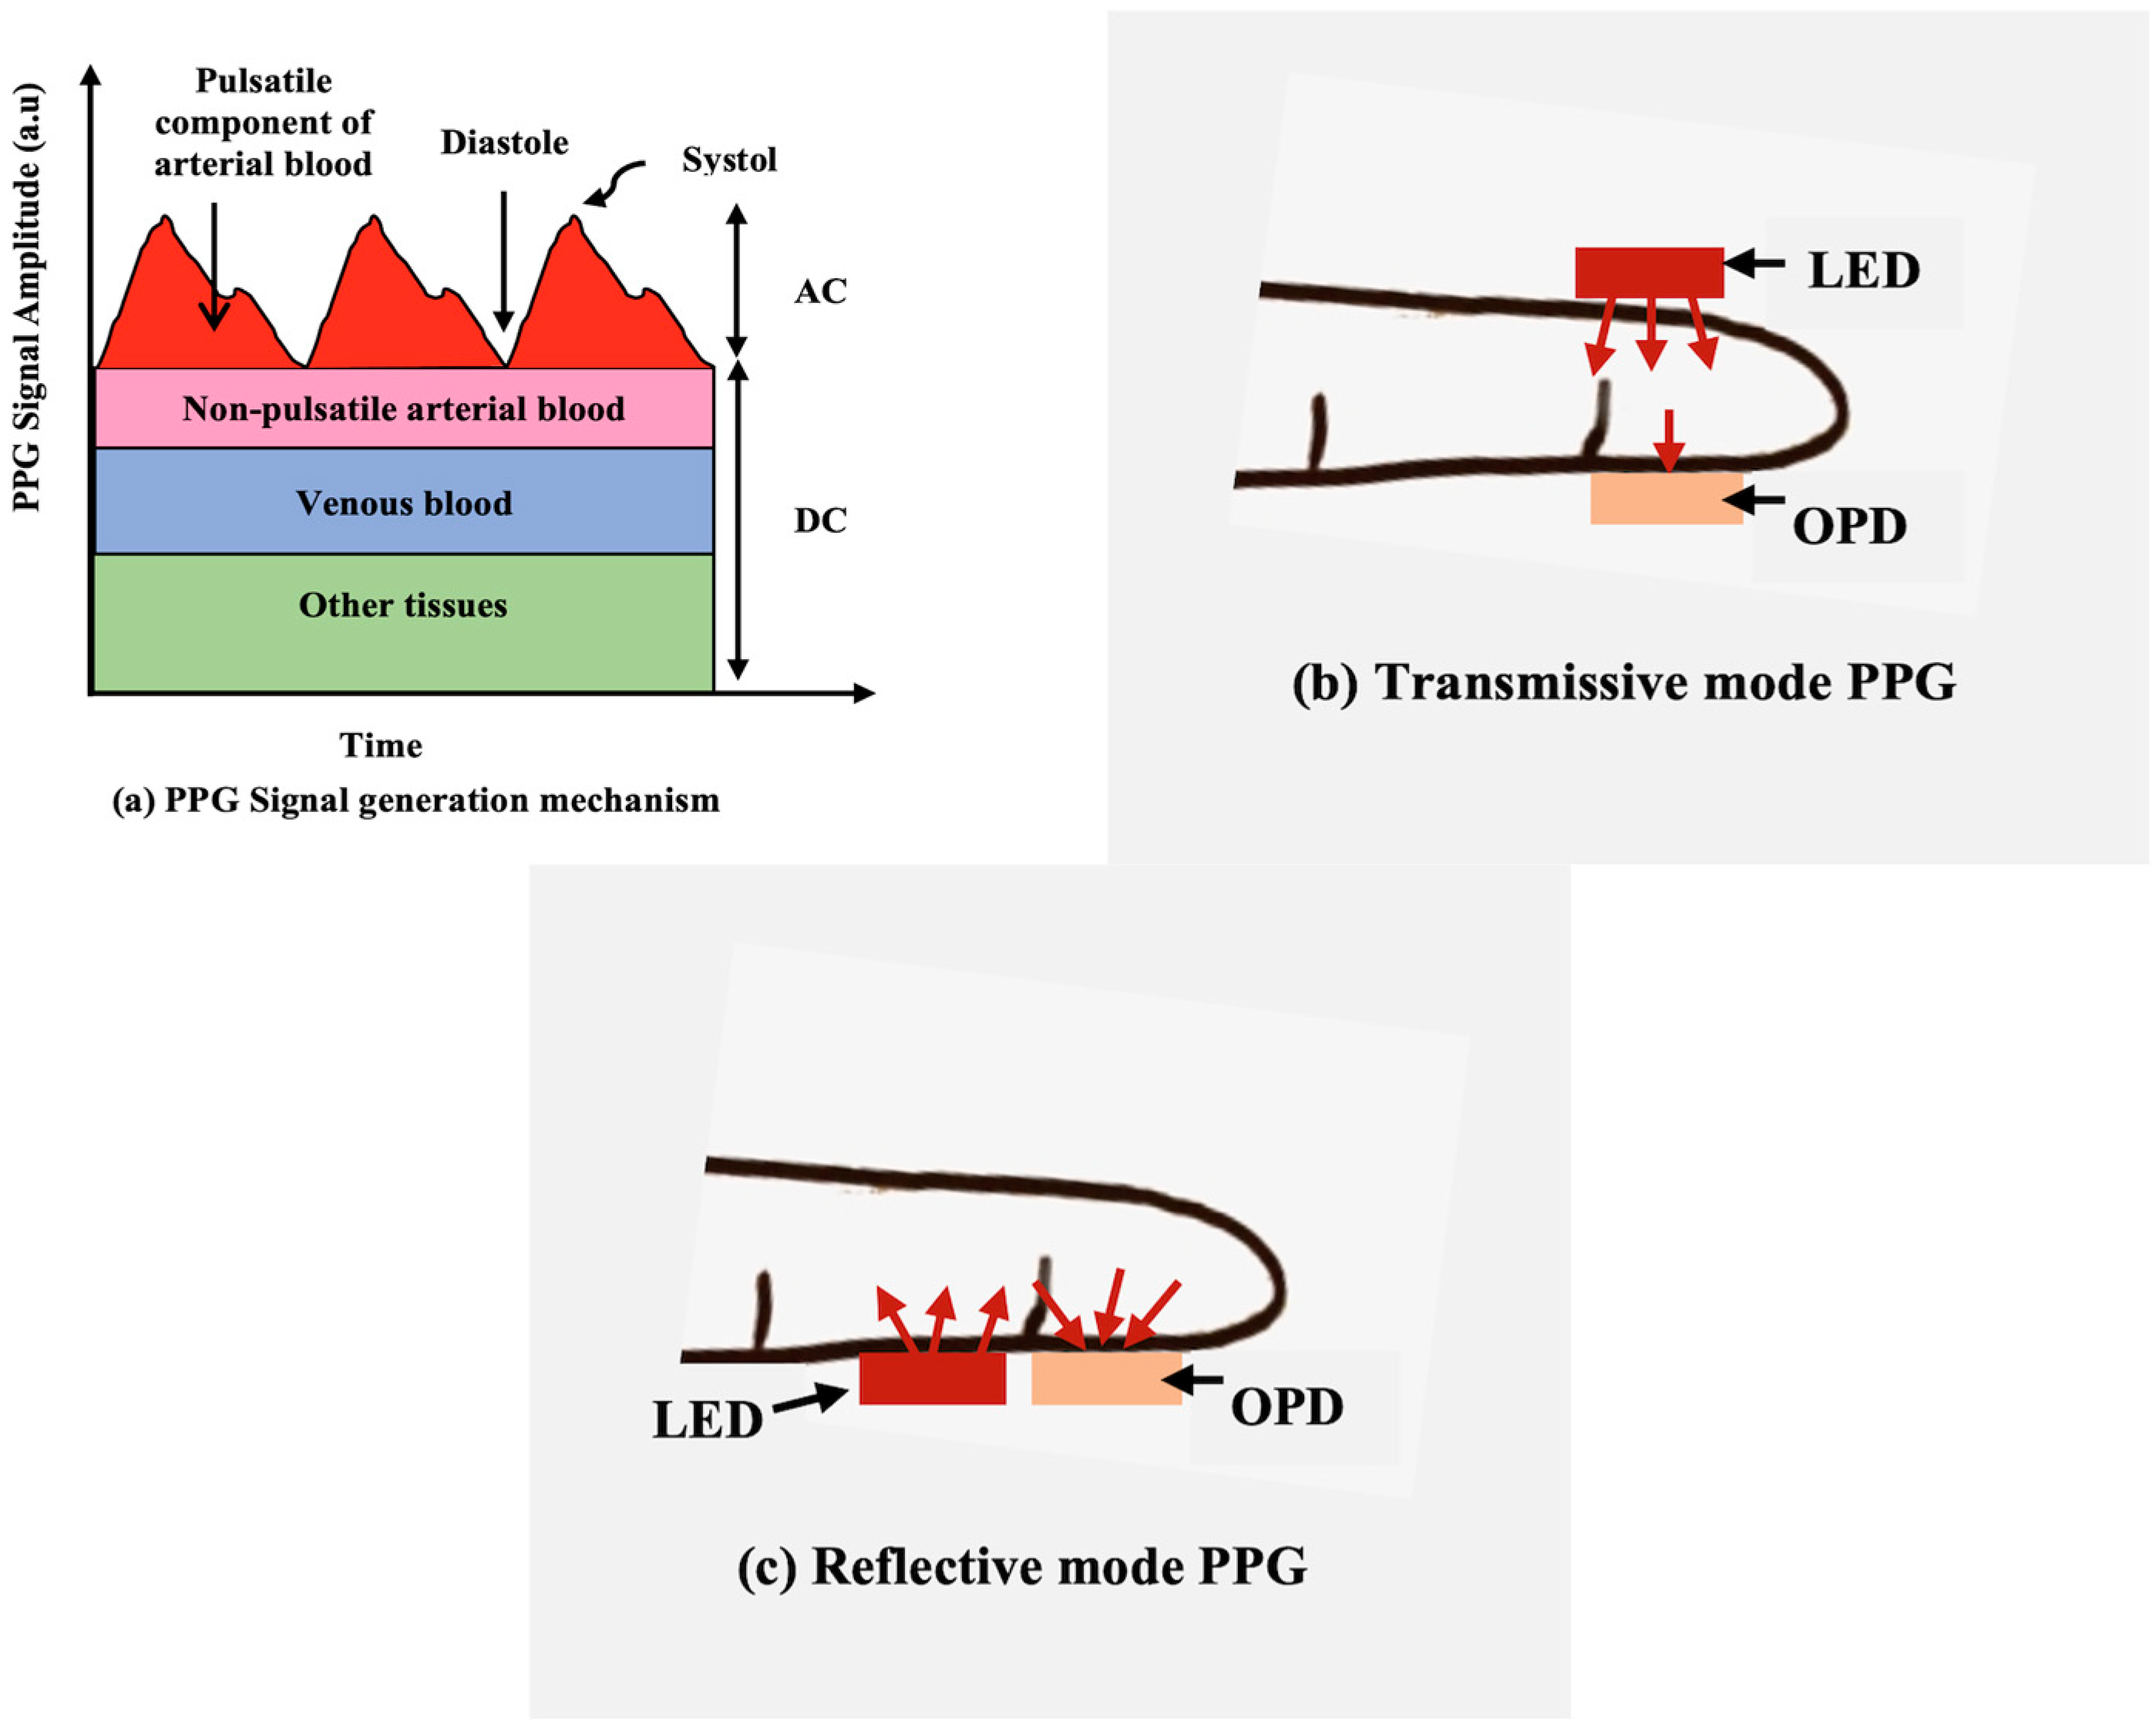
For wearable devices like the ones you're interested in, the reflective mode is almost always used because it's practical for sites like the wrist, arm, or chest.
Let's ground this with a more formal definition from a technical article by Analog Devices, which designs the kind of chips used in these sensors.
Guidelines for the Opto-Mechanical Integration of Heart-Rate Monitors in Wearable Wrist Devices
This article, 'Guidelines for the Opto-Mechanical Integration of Heart-Rate Monitors,' provides an excellent engineering perspective. The first section clearly defines the theory of operation.
Read the 'Theory of Operation' section. It formalizes the concepts of systolic/diastolic phases and distinguishes between transmissive and reflective measurements.
3. Engineering the Sensor: Why Green Light?
A key design choice in a PPG sensor is the wavelength (color) of the light. Most wrist-worn wearables use green light. Why? It's a trade-off between penetration depth and signal strength.
- Red and Infrared light have long wavelengths and penetrate deep into the tissue. This is great for transmissive sensors (like fingertip pulse oximeters), but in reflective mode on the wrist, it can pick up "noise" from deep tissues and muscles.
- Blue light has a short wavelength and doesn't penetrate deep enough to reliably reach the blood vessels.
- Green light is a "Goldilocks" solution. It penetrates just deep enough to reach the vascularized dermal layers where the arterial pulse is strong, but not so deep that it gets distorted by other tissues. It also has the advantage of being strongly absorbed by hemoglobin.
The Steve Mould video gives a great high-level explanation of this.
The bizarre flashing lights on a smartwatch
Let's revisit the smartwatch video for the intuitive reason behind using green light.
Watch from 02:48 to 03:35. Focus on the discussion about the penetration depth of red, green, and blue light.
Now, for the engineering details that will appeal to your ECE background. The choice of wavelength is based on the absorption spectrum of oxygenated hemoglobin (HbO2), the primary component of arterial blood.
The Analog Devices article provides a detailed analysis, showing that the peak absorption for HbO2 is around 540-570 nm (in the green-yellow range).
Guidelines for the Opto-Mechanical Integration of Heart-Rate Monitors in Wearable Wrist Devices
This section of the Analog Devices article dives into the physics of light interaction with skin and the rationale for component selection. It quantifies why green light is optimal.
Read the sections 'Interaction of Light with the Skin' and 'Component Selection'. Pay close attention to Figure 3, which plots the absorption coefficient vs. wavelength. This plot is the key to understanding why green LEDs are chosen despite not being perfectly at the peak, due to manufacturing efficiencies.
One more thing: why do the lights flash?
It's not just for show. It's a clever signal processing trick called ambient light cancellation. The sensor takes two measurements in rapid succession: one with the LED on, and one with it off.
This subtracts the effect of surrounding light (from the sun, indoor lighting, etc.), which is crucial for getting a clean signal.
4. From a Waveform to a Heart Rate
The output of the PPG sensor, after ambient light cancellation, is a waveform officially known as the photoplethysmogram, or "pleth" for short. This waveform should pulsate in sync with your heart's QRS complex, though with a slight delay as the pressure wave travels from the heart to the sensor location.
This video from ICU Advantage provides a clinical perspective, clearly explaining the pleth waveform and its relationship to the ECG.
Watch from 03:01 to 04:25. Notice how the pleth waveform is generated and how its peaks align just after the QRS complexes on the ECG. This visual link between the electrical and mechanical events is important.
To get the heart rate from this pleth waveform, a series of signal processing steps are applied, which should be familiar from your ECE studies:
- Band-pass Filtering: The raw signal is filtered to keep only the frequencies corresponding to a plausible human heart rate (e.g., 0.5 to 4 Hz, or 30 to 240 bpm). This removes low-frequency baseline wander and high-frequency noise.
- Motion Artifact Removal: This is the biggest challenge for wearables. Accelerometer data is often used to identify periods of motion and either ignore the PPG data or use advanced algorithms (like adaptive filtering) to try and separate the motion signal from the cardiac signal.
- Frequency Analysis: A Fast Fourier Transform (FFT) is typically performed on a short window of the cleaned signal. The dominant frequency peak in the resulting spectrum corresponds to the heart rate.
- Tracking: Algorithms are used to track the heart rate over time, helping to reject sudden, non-physiological jumps in the calculated rate.
Test your understanding!
You are designing a wearable PPG sensor for the wrist to monitor stress.
- Would you choose a transmissive or reflective design? Why?
- Your initial prototype is struggling with interference from bright office lighting. What simple hardware/software strategy could you implement to solve this?
- A user reports that the heart rate reading becomes very inaccurate when they are typing vigorously. What is the likely cause of this error, and what additional sensor could help you detect and potentially correct for it?
Show answer
- You would choose a reflective design. The wrist is too thick for a transmissive design, which requires light to pass through the tissue to a detector on the other side. A reflective design, with the LED and photodetector on the same surface, is the only practical option for the wrist.
- The best strategy is ambient light cancellation. This involves rapidly flashing the LED and taking two measurements: one with the light on (signal + ambient) and one with it off (ambient only). Subtracting the second from the first removes the contribution of the steady office lighting.
- The likely cause is motion artifact. The vigorous typing motion is introducing noise into the PPG signal that has a similar frequency to the heart rate, confusing the FFT analysis. An accelerometer could be added to the device to measure this motion. When high motion is detected, the system could either discard the corrupted PPG data or use the accelerometer signal in an adaptive filter to try and subtract the motion noise from the PPG signal.
Conclusion
Today we have bridged the gap between the electrical world of ECG and the optical world of PPG. You now understand the fundamental principles behind the technology powering a vast majority of modern health and fitness wearables.
Key Takeaways:
- PPG is an optical technique that measures changes in blood volume by detecting variations in light absorption or reflection.
- The signal consists of a large DC component from static tissue and a small AC component from pulsatile arterial blood flow. Heart rate is derived from this AC component.
- Reflective mode PPG with green light is the standard for wrist-worn devices due to practical constraints and optimal signal-to-noise ratio.
- Extracting heart rate involves filtering, motion artifact removal (a major challenge), and frequency analysis (e.g., FFT) of the plethysmogram waveform.
Preview of the Next Lesson:
We've now covered two ways to measure heart rate. Next, we will move to another critical cardiovascular parameter: blood pressure. We will begin our next module on Hemodynamics by exploring the classic methods for measuring blood pressure, both invasively (direct) and non-invasively (indirect), like the cuff-based devices you see in any clinic. This will provide the foundation for understanding how pressure is regulated and measured throughout the circulatory system.
Can't find a good explanation? Sign up and we'll make it for you
Sign up