
Conventional vs. Automated Bacterial Identification and AST Methods
Hello. This module moves from interpreting culture and MIC results to the laboratory technologies that generate them. For a presentation, the important comparison is not simply “manual versus automated”: it is whether a method identifies an organism, measures its antimicrobial phenotype, detects a resistance determinant, or supports a rapid preliminary decision.
This lesson establishes a platform-independent framework. By the end, you should be able to compare conventional identification and AST with automated ID–AST systems and MALDI-TOF by principle, turnaround time, strengths, limitations, and confirmatory role. The next lessons will examine VITEK 2, MicroScan, and BD Phoenix individually.
1. Start with the right comparison: what is the method actually measuring?
“Automation” is not a single analytical principle. It can mean automated inoculation, incubation, optical reading, computerized interpretation, LIS transmission, or all of these. The clinical laboratory still needs to distinguish three different questions:
- Identification (ID): What organism is present?
- Phenotypic AST: Does that organism grow when exposed to defined concentrations of antimicrobial agents?
- Genotypic resistance testing: Is a particular resistance-associated gene or mutation present?
A result can be fast and technically correct while answering only one of these questions. MALDI-TOF, for example, is an automated identification method; routine MALDI-TOF does not determine an MIC or provide a full phenotypic susceptibility profile. Conversely, a broth microdilution panel can provide MICs but is meaningful only if the organism has been correctly identified and the inoculum is pure.
A second essential distinction is the turnaround-time clock:
- Analytical time begins when a suitable colony or prepared specimen enters the test.
- Clinical turnaround time begins when the specimen is collected and ends when an actionable result is communicated.
A MALDI-TOF run may take minutes after colony selection, but obtaining that colony commonly requires overnight culture. Automated ID–AST can report within hours after setup, but it likewise usually starts from a pure culture. Direct molecular assays and certain direct-from-positive-blood-culture workflows may shorten the clinical clock, but they require separate validation and interpretation.
2. Conventional methods: slow is not the same as obsolete
Conventional microbiology is often portrayed as the older alternative to automation. In practice, it remains the foundation: culture establishes viability, allows assessment of purity, reveals colony morphology, and supplies the isolated colonies required by most automated systems.
Conventional bacterial identification
Traditional ID proceeds by progressively narrowing possibilities using:
- colony morphology and hemolysis;
- Gram stain and microscopic morphology;
- growth requirements and selective or differential media;
- biochemical reactions such as catalase, oxidase, indole, urease, coagulase, carbohydrate utilization, and enzyme activities.
The analytical principle is observable phenotype: an organism’s growth and metabolic activities are compared with expected profiles. A spot test may yield useful information in minutes; a full manual identification scheme requiring multiple biochemical reactions may take two to five days.
Manual biochemical testing has two enduring advantages. First, it is transparent: an unexpected reaction, mixed morphology, or atypical colony can be seen rather than obscured within an instrument result. Second, it remains useful as a targeted problem-solving tool when an automated system returns low discrimination, an improbable identity, or a result inconsistent with the isolate’s morphology.
Its limitations are substantial: it is labor-intensive, slower at scale, dependent on correct test selection and interpretation, and can struggle with metabolically inactive organisms or closely related species.
Conventional AST: different methods, different outputs
The major conventional AST methods are not interchangeable. Their outputs and best uses differ.
Disc Diffusion (Kirby-Bauer) Antimicrobial Susceptibility Testing
Watch “Disc Diffusion (Kirby-Bauer) Antimicrobial Susceptibility Testing” from TheRubinLab for a compact visual account of disk diffusion and why standardization matters.
Watch the diffusion principle to see how a disk establishes an antimicrobial concentration gradient and why a zone of inhibition forms. Then watch critical variables; focus on how inoculum, medium, incubation, disk potency, and control strains determine whether a measured zone is clinically interpretable.
Disk diffusion places fixed-content antimicrobial disks on a lawn of bacteria growing on standardized agar. Drug diffuses outward, creating a concentration gradient. After incubation, the diameter of the growth-inhibition zone is measured and interpreted using the current organism–drug–method-specific breakpoint table.
Disk diffusion is inexpensive, flexible, and highly scalable. It also displays the plate-level phenotype: irregular zones, colonies within zones, swarming, contamination, and synergy patterns can prompt further investigation. Its central limitation is that it yields a zone diameter, not a direct MIC. It also requires standardized media, inoculum, disk storage, agar depth, and incubation conditions.
Broth microdilution (BMD) exposes a standardized inoculum to serial twofold concentrations of an antimicrobial in broth wells. The MIC is the lowest tested concentration that prevents visible growth under the specified reading rules. Standardized BMD is the reference phenotypic method for many organism–drug combinations and is especially important when a reliable numeric MIC is necessary.
BMD’s strengths are its quantitative output, standardization, and suitability as a reference or adjudication method. Its disadvantages are the need for careful preparation, incubation time, and limited practicality when only a small number of isolate–drug combinations need testing.
Agar dilution applies the same concentration-based logic on agar: isolates are spotted onto media containing defined antimicrobial concentrations. It is laborious for routine individual testing but can efficiently test many isolates against one agent or agent series.
Gradient strips combine agar diffusion with a labeled concentration gradient. The ellipse of inhibition intersects the strip at an MIC reading. They are useful when a laboratory needs a flexible MIC for one or a few agents, or as a targeted follow-up test. They cost more per drug than disks and cannot be assumed reliable for every organism–drug combination. A result must be accepted only where the strip method is validated and supported by the laboratory’s current policy.
Antimicrobial Susceptibility Testing: A Comprehensive Review of Currently Used Methods
Read the “Commonly Used Techniques” section of this review to consolidate the principles and trade-offs of dilution, gradient, and disk-diffusion AST.
In Section 3.1.1, “Dilution Methods: Broth Dilution and Agar Dilution,” begin with the role of MICs, then continue through the descriptions of broth microdilution and agar dilution. In Section 3.1.2, “Antimicrobial Gradient Method,” focus on why strips provide an MIC but are not universally reliable, particularly for some agents. In Section 3.1.3, “Disk Diffusion Test,” read from the disk method through the discussion of its low cost, flexible disk selection, inability to directly determine MIC, and value for recognizing unusual phenotypes.
A useful rule for your presentation is:
Conventional methods are not merely backups. They provide the visual context, flexibility, and reference measurements that make automated results trustworthy.
3. Automated phenotypic ID–AST: standardized miniaturized testing at scale
Automated platforms such as VITEK 2, MicroScan WalkAway, and BD Phoenix are designed to reduce hands-on work, manage large workloads, standardize incubation and reading, and transmit results efficiently. They generally begin with a standardized suspension from a pure culture, followed by loading an ID card or panel, an AST card or panel, or a combined ID–AST format depending on the platform.
Their underlying logic remains largely phenotypic.
- Automated ID examines a set of biochemical or enzymatic reactions, often using colorimetric, fluorometric, or turbidimetric changes.
- Automated AST exposes the organism to predefined antimicrobial concentrations, commonly in a miniaturized broth microdilution-like format.
- Automated reading detects growth or reaction changes kinetically through optical methods.
- Software interpretation compares reaction profiles with a database, applies current breakpoints, and may use expert rules to flag improbable or clinically important patterns.
The automation improves standardization and throughput, but it does not remove biological uncertainty. A device cannot compensate for a mixed culture, wrong colony selection, an incorrect inoculum density, expired panel, unsupported organism–drug combination, or obsolete breakpoint configuration.
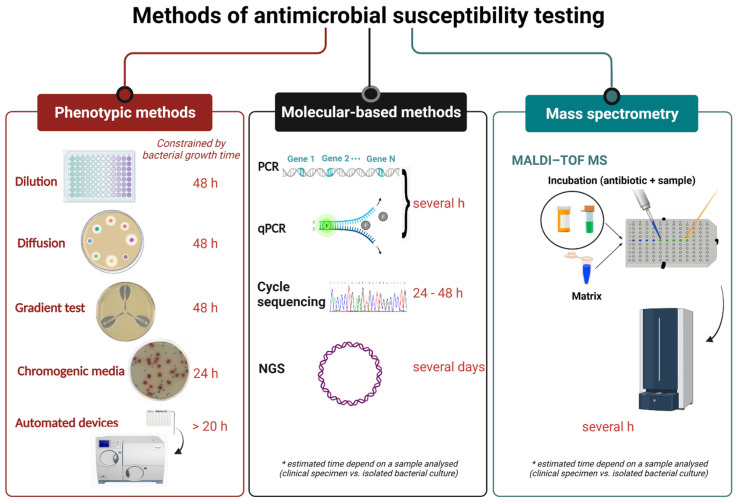
The figure’s turnaround times should be treated as broad estimates rather than promises. In particular, “48 hours” for conventional AST often reflects the combined time needed for isolation plus susceptibility testing, whereas an instrument’s “4–18 hours” usually describes the period after an isolate has been prepared and loaded.
What automation improves
Automated ID–AST is especially valuable when a laboratory needs to process many routine isolates consistently. Its major strengths are:
- High throughput: multiple cards or panels incubate and read in parallel.
- Reduced hands-on reading: the instrument detects subtle growth or reaction changes repeatedly.
- Faster analytical reporting: typical instrument results are often available in roughly 4.5–18 hours after setup, depending on organism, panel, and platform.
- Standardized interpretation: software can apply configured breakpoint tables and organism–drug rules consistently.
- Connectivity: results can be transferred to middleware or the LIS, supporting review, selective reporting, surveillance, and stewardship workflows.
What automation does not solve
Automated systems have structural limitations that explain their continuing need for conventional confirmation.
Fixed panel design. A panel contains only selected drugs and selected concentrations. Consequently, an MIC can be reported as an exact tested value, an off-scale value such as “less than or equal to” or “greater than” the panel range, or occasionally may not be categorizable under the installed breakpoints. Classical BMD can be designed with a broader dilution range for a specific problem.
Database and software dependence. Biochemical identification and expert interpretation depend on the card chemistry, the database, software version, and breakpoint configuration. An apparently precise result still requires plausibility review.
Organism–drug-specific performance. No system is equally accurate for every organism and agent. Particular resistance mechanisms, slow-growing organisms, unusual taxa, and MICs near a breakpoint can produce problematic results. Validation data must be interpreted at the organism–drug level, not as a general claim that one instrument is “accurate.”
Loss of visual context. A growth curve or numerical MIC does not replace plate review. A mixed inoculum may yield internally inconsistent biochemical reactions or an implausible AST pattern, yet the instrument cannot identify which colony caused the discrepancy.
Antimicrobial Susceptibility Testing: A Comprehensive Review of Currently Used Methods
Read Section 4.1 for a concise comparison of the main automated phenotypic ID–AST platforms before studying each platform in detail in later lessons.
In Section 4.1, first read the case for automation. Then compare the platform summaries beginning with Phoenix and MicroScan WalkAway. Finish with the limitations discussion, paying particular attention to inoculum effects, restricted concentration ranges, software updates, and difficult-to-detect resistance phenotypes.
4. MALDI-TOF changes identification, not routine AST
MALDI-TOF MS is analytically different from both conventional biochemistry and automated ID–AST panels. A colony is placed on a target, overlaid with a matrix, irradiated by a laser, and ionized. The instrument measures the time of flight of ions with different mass-to-charge ratios, generating a protein spectrum. Software compares that spectrum with a reference database and returns an identification with a confidence indicator or score.
Microbial Identification | Vitek 2 Compact | Vitek MS
Watch “Microbial Identification | Vitek 2 Compact | Vitek MS” by Microbiology Mantra for a visual introduction to the MALDI-TOF spectrum-generation process.
Watch MALDI-TOF principle. Focus on the sequence of target preparation, laser ionization, time-of-flight separation, peak generation, and database comparison. The key point is that this is protein-profile identification, not measurement of bacterial growth in antimicrobial dilutions.
MALDI-TOF’s principal advantage is speed: once adequate growth from a pure colony is available, identification can be generated in minutes. It is also economical at high volumes after capital investment and may identify a wider range of organisms than a limited biochemical card, provided they are represented in the validated database.
However, it has critical limitations:
- It ordinarily requires a pure colony. Mixed culture is a major source of misleading or failed results.
- It identifies only as well as its database and score criteria allow.
- Closely related organisms may be difficult to distinguish.
- Direct-from-positive-blood-culture workflows require additional specimen preparation and performance may vary by organism group.
- Routine MALDI-TOF does not produce a phenotypic MIC or a susceptibility category.
Thus, in a contemporary workflow, MALDI-TOF often provides the ID quickly while a separate automated panel, disk diffusion, BMD, or gradient strip provides AST. This pairing is often faster than using an automated biochemical ID card plus AST card, but it separates the ID and AST workflows rather than replacing AST.
Use this review to compare biochemical identification with MALDI-TOF at the level of analytical signal, turnaround time, and database-related limitations.
In “Biochemical identification techniques,” read the biochemical basis, then locate the paragraph beginning “Using miniaturized, multi-test identification kits” for the transition from manual tubes to automated biochemical systems. In “Overview of MALDI-TOF MS,” read the analytical principle, followed by the “Advantages and limitations of MALDI-TOF MS” subsection. Contrast a metabolic reaction profile with a protein-spectrum database match.
5. Molecular methods: rapid, targeted, and complementary
Molecular assays detect nucleic acid targets. For ID, the target may be species-specific DNA, ribosomal gene sequences, or a multiplex panel of pathogens. For resistance, the target may be a defined resistance gene or mutation.
They can be exceptionally rapid, sometimes performed directly from clinical material or positive blood cultures. Their limits are equally important: detecting a resistance gene does not always predict the complete phenotypic susceptibility profile, and the absence of a target does not exclude resistance by another mechanism. Molecular resistance testing is therefore best understood as a targeted complement to phenotypic AST, unless a validated clinical workflow specifies otherwise.
For a slide-ready comparison, distinguish “rapid detection of selected resistance determinants” from “full antimicrobial phenotype with MICs.” They are not equivalent claims.
6. A practical comparison framework
| Method family | Main analytical signal | Primary output | Typical analytical time* | Major strengths | Key limitation and confirmatory role |
|---|---|---|---|---|---|
| Manual biochemical ID | Visible metabolic or enzymatic reactions | Identification | Minutes for spot tests; up to 2–5 days for full manual workup | Transparent, low technology, targeted troubleshooting | Slow and labor-intensive; useful to resolve low-discrimination or implausible automated IDs |
| Disk diffusion | Zone diameter after radial drug diffusion in agar | Susceptibility category | Usually overnight incubation | Low cost, flexible, visible phenotype, useful for screening patterns | No direct MIC; use a validated MIC method when a numeric value or adjudication is required |
| Broth microdilution | Growth or no growth across antimicrobial concentrations | MIC, then category | Usually 16–24 hours | Standardized numeric result; reference method for many applications | Requires rigorous preparation and reading; used to confirm selected questionable results |
| Gradient strip | Inhibition ellipse intersecting an antimicrobial gradient | MIC | Usually 16–24 hours | Flexible targeted MIC testing | Costly per drug and not reliable for every agent; confirm where policy requires |
| Automated ID–AST panels | Biochemical reactions plus kinetic growth detection in predefined drug wells | ID, MICs or ranges, categories, alerts | Roughly 4.5–18 hours after setup | Throughput, standardized incubation and reading, LIS connectivity | Fixed panels, inoculum dependence, software and database dependence; investigate discordant or high-risk results |
| MALDI-TOF MS | Protein mass spectrum matched to a database | Identification with confidence score | Minutes after colony preparation | Very rapid, high-volume ID | No routine AST or MIC; confirm low-confidence or implausible IDs using appropriate methods |
| Molecular ID or resistance assay | Specific nucleic acid target or sequence | Target detection | Often hours, assay dependent | Rapid and potentially direct from specimen | Target-limited; resistance genotype may not equal full phenotype; phenotypic AST often remains necessary |
*These figures are approximate and should always be presented with the starting point stated clearly: pure isolate, positive blood culture, or primary specimen.
When should a conventional or alternative method confirm automation?
Confirmation should be risk-based, guided by the organism–drug combination, current policy, QC status, and clinical consequences. It is not necessary to repeat every automated result. It is appropriate to pause and investigate when there is:
- discordance between colony morphology, Gram stain, organism ID, and AST pattern;
- low-confidence, low-discrimination, or unexpected MALDI-TOF identification;
- evidence of mixed culture or poor purity;
- a result that conflicts with known intrinsic resistance or an expected phenotype;
- an off-scale MIC, borderline result, or organism–drug combination with known performance concerns;
- a clinically high-consequence resistance result that will trigger infection-control action or major treatment change;
- failed QC, instrument alarms, expired materials, or an unverified software or breakpoint change.
The initial action is often deceptively simple: review the culture plate, re-isolate a pure colony, repeat identification and AST from a fresh standardized inoculum. Only then should the laboratory choose a targeted alternative method, reference BMD, or molecular test.
Key takeaways
Conventional and automated methods are complementary rather than competing technologies. Conventional culture, morphology, disk diffusion, targeted biochemical testing, and BMD provide biological context, flexible investigation, and reference measurements. Automated ID–AST platforms increase throughput and shorten post-isolation analytical time through miniaturized biochemical testing, kinetic growth detection, and software-assisted interpretation.
MALDI-TOF is a rapid protein-profile identification technology, not routine phenotypic AST. Molecular assays provide rapid targeted detection but do not automatically replace MIC-based phenotypic susceptibility testing. Across all approaches, the most defensible comparison states what is measured, where the turnaround-time clock starts, what output is produced, and when confirmation is required.
Next, we will trace the VITEK 2 workflow from standardized suspension and card selection through optical readings, ID confidence, MIC reporting, and expert-system interpretation.
Can't find a good explanation? Sign up and we'll make it for you
Sign up