
Hello! This short course is focused on two common high-school assessment skills: interpreting sound-wave displays and drawing ray diagrams for curved mirrors. In this first lesson, you will learn to read the two features exam questions most often test in sound diagrams: amplitude and frequency.
By the end, you should be able to look at two wave traces and state, with a reason, which sound is louder, which has the higher pitch, or whether either property is the same.
Sound waves: the real motion and the diagram
Sound is produced when something vibrates. A loudspeaker cone, for example, moves back and forth and makes nearby air particles vibrate. Sound then travels through air as a longitudinal wave: the particles move back and forth in the same direction that the sound travels.
However, assessments often show sound using a wavy line that resembles a transverse wave. This is a graphical representation, not a picture of the air literally moving up and down. On an oscilloscope, a microphone changes sound into an electrical signal, and the screen displays that changing signal over time.
The central horizontal line is the equilibrium position: the undisturbed, resting level. Two visible features of the trace carry the key information:
- Amplitude is the maximum height from the middle line to a crest, or from the middle line to a trough.
- Frequency is the number of complete vibrations, or cycles, produced each second. Its unit is hertz (Hz).
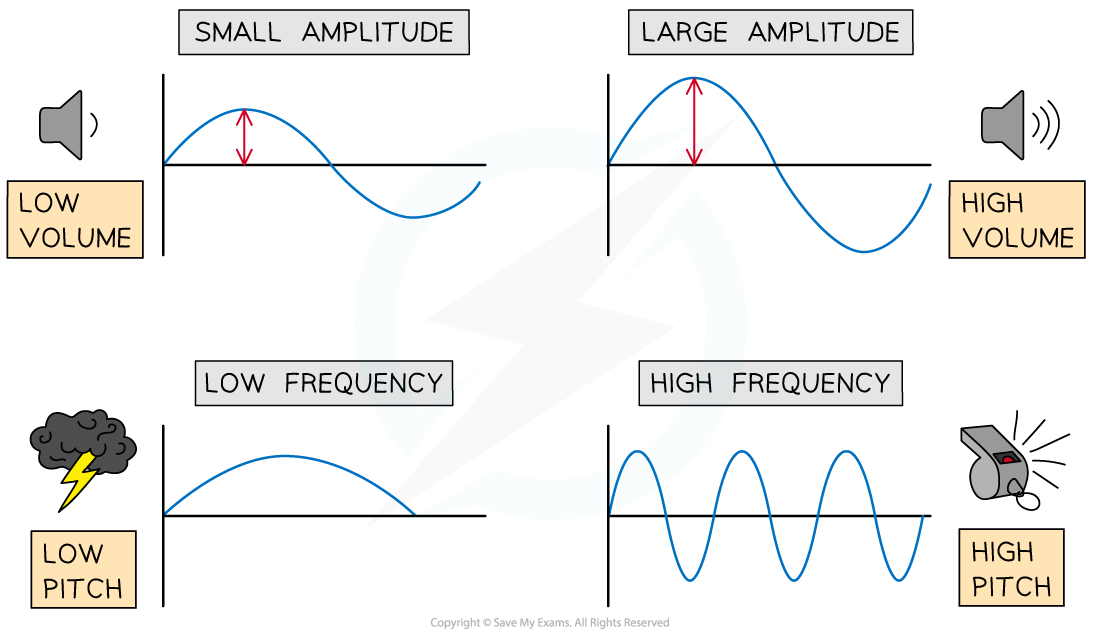
Notice an important measurement detail: amplitude is not the full crest-to-trough height. The crest-to-trough distance is twice the amplitude.
Looking at sounds - Sound waves, amplitude and frequency - 4th level Science Revision - BBC Bitesize
Read BBC Bitesize’s “Looking at sounds” to connect the sound source, microphone, and oscilloscope display before focusing on the diagram-reading rules.
In the section “Looking at sounds,” read the opening explanation and the subsection “Oscilloscope traces.” Focus first on vibration and loudness. Then continue to the paragraph beginning “Volume (amplitude)” and read through the comparisons of diagrams 1, 2, and 3, including the two comparison rules. Pay attention to how the source keeps one feature constant before comparing the other.
Amplitude tells you loudness
A larger amplitude means a bigger vibration. Bigger vibrations transfer more energy, so the sound is perceived as louder.
On a wave trace, amplitude is shown by the vertical height away from the middle line:
- Small amplitude: quiet sound
- Large amplitude: loud sound
In everyday language, questions may use volume to mean loudness. In a science answer, the most precise wording is usually:
The sound is louder because its wave has a greater amplitude.
Do not write that a taller wave has a higher pitch. Height is about amplitude and loudness, not pitch.
Here is a comparison approach. Imagine two traces are shown with the same vertical scale:
| Feature compared | Trace A | Trace B | Conclusion |
|---|---|---|---|
| Height from centre line | Smaller | Larger | B is louder |
| Spacing between cycles | Same | Same | They have the same pitch |
The key is that the waves have identical spacing. This lets you isolate amplitude as the only changing feature.
Frequency tells you pitch
Pitch describes how high or low a sound seems. A whistle tends to have a high pitch; a bass drum tends to have a low pitch. Pitch depends on frequency.
Frequency means how many complete cycles occur in one second. For example, a frequency of means that the source vibrates 440 times every second.
On an oscilloscope trace with time along the horizontal axis:
- Closely spaced waves mean more cycles in the same time, so a higher frequency and higher pitch.
- Widely spaced waves mean fewer cycles in the same time, so a lower frequency and lower pitch.
The horizontal distance for one complete cycle is called the period when the horizontal axis shows time. A short period means that each vibration takes less time, so the frequency is high.
Sound: Wavelength, Frequency and Amplitude.
Watch “Sound: Wavelength, Frequency and Amplitude” from Science Sauce for a compact visual demonstration of changing frequency and amplitude on an oscilloscope.
Watch frequency and pitch, focusing on the number of cycles occurring in the same time and the change in pitch as frequency rises. Then skip the wavelength section and resume at amplitude and volume, which contrasts the vertical height of a trace with its loudness.
Keep amplitude and frequency separate
Amplitude and frequency are independent properties. A sound can be:
| Amplitude | Frequency | What you hear |
|---|---|---|
| Large | High | Loud, high-pitched |
| Large | Low | Loud, low-pitched |
| Small | High | Quiet, high-pitched |
| Small | Low | Quiet, low-pitched |
This is why one diagram can look “taller” while another looks “more crowded.” They are showing different properties.
Consider three sound traces drawn over the same one-second interval:
- Trace A completes two cycles and has a small amplitude.
- Trace B completes two cycles and has a large amplitude.
- Trace C completes four cycles and has the same amplitude as Trace B.
A careful interpretation is:
- A and B have the same frequency because they complete the same number of cycles in one second. Therefore, they have the same pitch.
- B has greater amplitude than A. Therefore, B is louder.
- B and C have the same amplitude. Therefore, they have the same loudness.
- C has more cycles in the same time than B. Therefore, C has a higher frequency and a higher pitch.
This is the reasoning pattern to use in written assessment answers: name the wave feature, state how it differs, then connect it to the sound property.
A reliable method for sound-wave questions
When comparing wave diagrams, use this short routine.
- Check the scales and axes. Only compare heights or spacing directly if the diagrams use the same scale. On most school oscilloscope questions, the horizontal axis represents time.
- Compare vertical height from the centre line. Larger amplitude means louder sound.
- Compare the number of cycles in equal time, or the horizontal spacing. More cycles or closer spacing means higher frequency and higher pitch.
- State only what the diagram supports. A greater amplitude alone says nothing about pitch; a greater frequency alone says nothing about loudness.
A particularly common trap is reversing the terms:
- Amplitude is about loudness.
- Frequency is about pitch.
Another trap is treating the drawn sinusoidal line as the physical shape of sound in air. It is a useful display of changing displacement, pressure, or electrical signal. The actual sound wave in air remains longitudinal.
Key takeaways
A sound-wave diagram gives you two distinct kinds of information:
- Amplitude is the maximum vertical displacement from the centre line. Greater amplitude means a louder sound.
- Frequency is the number of cycles each second, measured in hertz. Higher frequency means a higher-pitched sound.
- Compare one feature at a time, and make sure the graph scales are the same.
- A strong assessment explanation links the visible evidence to the conclusion: “The waves are closer together, so the frequency is higher; therefore the pitch is higher.”
Next, you will switch from sound-wave diagrams to light-ray diagrams and use principal rays to predict images formed by concave and convex mirrors.
Can't find a good explanation? Sign up and we'll make it for you
Sign up