
Welcome. This course develops a theory-led approach to contrarian venture investing: first, how beliefs form under uncertainty; then how narratives, imitation, financing, and real company outcomes can create booms and busts; finally, how to turn that understanding into an investable, falsifiable view.
We begin with the central tool of the final module: the causal-loop map. A contrarian thesis is not yet useful because it says, “the market is wrong.” It becomes useful when it states how a belief became dominant, how that belief affects financing and company behaviour, which parts of the loop are grounded in real improvement, and what could cause the loop to reverse. The aim is to construct such a map for a venture category, particularly one being assessed at pre-seed through Series A.
Plan for roughly 40–45 minutes, including two short videos and two targeted readings.
Causal-loop maps: disciplined stories about feedback
A causal-loop diagram, or CLD, is not a forecast and not a proof. It is a compact representation of a theory: “If this variable changes, what else changes, and does the eventual consequence feed back into the starting variable?”
This matters in venture because the object being valued is partly shaped by expectations about its future fundability, talent access, customer credibility, and exit environment. Those expectations can be informative, self-fulfilling, or both. A map keeps these possibilities distinct.
A useful CLD has four elements:
-
Variables are quantities that can rise or fall, such as “follow-on capital availability,” “media visibility,” or “category-level customer traction.” Avoid vague labels such as “market sentiment” unless you define what it consists of.
-
A positive causal link means the two variables tend to move in the same direction, holding other relevant factors constant. More credible public signals can lead to more perceived category promise; fewer can lead to less.
-
A negative causal link means the variables move in opposite directions. More competition for specialised engineers may reduce the ability of a young company to hire the necessary team.
-
Delays matter. A financing round may change hiring immediately, but the resulting product progress, customer evidence, and next financing may emerge only after several quarters. Omitting delays makes venture cycles look smoother and more stable than they are.
The sign is not a moral judgment. A positive link is not “good,” and a negative link is not “bad.” It describes directional dependence.
Systems Thinking: Causal Loop Diagrams
Watch “Systems Thinking: Causal Loop Diagrams” by DonnaGurule for a concise visual introduction to variables, link polarity, reinforcing and balancing loops, and delays.
Watch the components for the basic vocabulary. Then watch polarity and loops, focusing on why an initial increase can either amplify itself or trigger an eventual counterforce. Finish with the role of delay; in venture, financing and commercial outcomes rarely occur on the same clock.
A reinforcing loop, conventionally labelled , amplifies an initial movement. If increased category credibility brings more funding, and that funding produces visible progress that further increases credibility, the loop can work upward. It can also work downward after confidence breaks.
A balancing loop, labelled , pushes against an initial movement. Capital may increase startup formation, but a larger field can intensify competition for talent and customers, reducing the rate at which companies produce convincing progress. Balancing loops do not necessarily prevent a boom. With long delays, they can allow excess to accumulate before the constraint becomes visible.
The practical point is simple: a hot category is not one variable. It is a system of mutually influencing variables.
From reflexivity to the venture category
Soros’s contribution is especially useful here because it rejects a clean separation between a market’s perceptions and its fundamentals. In a reflexive setting, participants try to understand reality, but their actions also alter it.
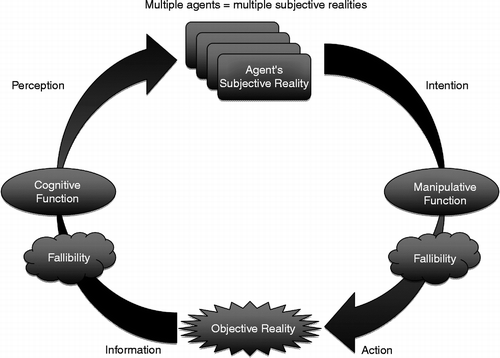
The diagram distinguishes two functions:
- The cognitive function runs from the world to participants’ interpretations. Investors, founders, employees, and customers observe information and form imperfect beliefs.
- The manipulative function runs from participants’ intentions to the world. They invest, hire, launch companies, adopt products, publish research, or withhold support. Those actions change the conditions that later get observed.
For venture investing, “objective reality” should not be treated as a single number such as revenue. It includes technological feasibility, customer willingness to pay, distribution access, gross margins, the quality of teams entering the category, and the availability of follow-on financing. Some are observable early; others only become visible after a long delay.
George Soros - Reflexivity Explained
Watch the relevant portion of “George Soros - Reflexivity Explained” by Patrick Boyle to connect causal loops with Soros’s distinction between self-correcting and self-reinforcing market dynamics.
Watch feedback in markets. Focus on the distinction between negative feedback that counteracts a movement and positive feedback that changes both valuations and underlying conditions. The Amazon example is useful not as a venture template, but because cheap capital could alter competitive behaviour and hence the subsequent fundamentals.
In a venture category, a brand-name investor’s round may have three different meanings, which should never be collapsed into one:
- It may be a signal: the investor has private information or a reputation for good selection.
- It may be a coordination device: other investors infer that the category will remain financeable, making them more willing to participate.
- It may be an intervention: the investor’s capital, board involvement, hiring network, and media reach alter the company’s chance of producing commercial evidence.
The first interpretation is mostly informational. The third is genuinely causal. In practice, all three may operate at once.
The following variable inventory helps keep a category map complete.
| Layer | Category-level variables | Possible observable traces |
|---|---|---|
| Beliefs | Perceived category promise; expected winner scale; expected follow-on fundability | Partner conversations, investment memos, market maps, term-sheet competition |
| Signals | Brand-name lead, comparable financing, public exit, third-party coverage, technical milestone | Announcements, valuations, customer references, independent press |
| Capital flows | LP-backed fund availability, willingness to lead, follow-on appetite, valuation tolerance | Fundraising, round sizes, syndicate composition, time between rounds |
| Behaviour | Startup formation, experimentation, hiring, pricing, customer acquisition, competitive spending | Newco formation, job postings, burn patterns, pilot activity |
| Fundamentals | Technical progress, customer adoption, retention, unit economics, productivity, category constraints | Usage, paid conversion, procurement cycles, margins, regulatory progress |
A map is stronger when it separates a latent belief from its public evidence. “A highly priced Series A” is a signal. It is not itself evidence that the category has solved customer adoption or unit economics.
Evidence: signals can change the environment
The venture setting is unusually opaque. Unlike public equities, early-stage companies have no continuous market price, little mandatory disclosure, and limited analyst coverage. This gives public signals disproportionate importance.
[PDF] Investor Influence on Media Coverage: Evidence from Venture ...
Read this research paper’s introduction and consequences section to see how an investment event can affect an otherwise opaque startup’s information environment. Its empirical caution is as important as its findings.
Begin on page 1, in Section 1, at “Financial media plays a central role in the modern disclosure landscape.” Read the information problem, then continue through the discussion of why VC investment can increase visibility through active engagement and reputational spillovers. Next, go to Section 5.1 on pages 20–22 and read the consequence analysis. Focus on the distinction between third-party coverage and company-issued publicity, and retain the authors’ explicit warning that these later outcomes are associational rather than definitive proof of causation.
The paper’s logic gives a useful discipline for mapping. VC-backed visibility can plausibly affect hiring and subsequent financing, but that does not mean media coverage alone caused either outcome. Firms receiving more coverage may also have better products, stronger founders, or a more favourable financing environment.
Therefore, each link in your map should carry an implicit status:
- Well-supported causal mechanism: for example, more available risk capital tends to raise reported venture valuations.
- Plausible but context-dependent mechanism: for example, an investor’s brand may attract media and candidates.
- Signal interpretation: for example, a high-profile round may reflect private investor diligence rather than create quality.
- Open empirical question: for example, whether a category’s increased startup count represents productive experimentation or indiscriminate copying.
That classification protects the contrarian investor from treating an attractive diagram as established fact.
A worked causal-loop map for an emerging category
Consider a hypothetical category: AI-enabled laboratory automation. The technology may genuinely lower experiment time or cost. Yet the category’s investability can still become reflexive if visible financings, prestigious investors, and expectations of future capital change what companies can do before commercial proof is complete.
The map below operates at the category level over roughly two to five years. It does not claim that every company in the category shares the same outcome.
This diagram contains four important mechanisms.
1. Certification and attention: the first reinforcing loop
Perceived category promise, brand-name participation, and visible signals form a reinforcing loop.
When a respected specialist fund leads a round, other investors, potential employees, journalists, and customers may pay closer attention. The brand therefore becomes a signal. Attention then makes future evidence more salient and can strengthen the belief that the category is promising.
But this loop is not automatically irrational. A high-reputation investor may possess superior technical judgment or access to private evidence. The contrarian question is:
Is the investor’s participation mainly revealing underlying quality, or is it becoming the principal evidence others use to infer quality?
If the latter dominates, the category is vulnerable to a reversal in attention when the investor stops leading new rounds, marks down a portfolio company, or redirects its public focus.
2. Finance changes behaviour, and behaviour can change fundamentals
The larger reflexive loop runs through belief, valuation, capital, behaviour, fundamentals, and visible signals.
Higher perceived promise can support higher valuations and easier capital access. More capital enables companies to hire scientists and engineers, run more experiments, offer customers subsidised pilots, build integrations, or absorb a long enterprise-sales cycle. If those actions generate real technical and commercial progress, the originally optimistic belief can become more justified after the fact.
This is why it is inadequate to dismiss every expensive category as “just narrative.” In venture, capital can purchase time, experimentation, credibility, and strategic flexibility. In some circumstances it genuinely expands the opportunity set.
At the same time, the causal link from capital to fundamentals is delayed and conditional. Capital cannot eliminate a binding scientific constraint, a procurement bottleneck, a weak value proposition, or unattractive unit economics. A map should therefore name the specific fundamental that financing is supposed to improve.
For this example, do not write merely “more capital improves quality.” Write a testable claim such as:
More capital funds enough laboratory deployments to establish whether the product reduces experiment turnaround time for paying customers.
That formulation identifies the expected evidence and makes failure observable.
3. Crowding is a balancing counterforce
Capital availability also increases startup entry and rival spending. In the short run, this may look like validation: more founders enter, employees specialise, vendors emerge, and customers become aware of the category.
But a crowded category can produce a balancing loop. Competition raises hiring costs, pushes companies to spend aggressively for design partners, and can make it harder for any individual venture to achieve a credible lead. Higher burn and customer-acquisition pressure reduce the ability to reach the technical or commercial milestones required for the next financing.
This counterforce is especially relevant from pre-seed through Series A. A company may be technically sound yet fail because the market’s financing window closes before it can convert product promise into evidence that later-stage investors recognise.
The key distinction is between:
- category experimentation, which may be socially and economically productive; and
- duplicative spending, which consumes scarce talent and customer attention without producing differentiated learning.
The map does not decide which is occurring. It tells you where to look.
4. The valuation–progress gap can trigger reversal
The final balancing loop tracks the gap between valuation-implied progress and observed progress.
High valuations embed expectations. If a company raises at a price consistent with rapid enterprise adoption, but paid deployments remain narrow, sales cycles lengthen, and repeat usage fails to appear, the gap widens. A wider gap can reduce belief in the category, cool financing receptivity, and shrink capital availability.
The reversal often looks sudden because several delays have accumulated:
- Companies may have enough runway to continue reporting activity after commercial evidence has weakened.
- Private-market marks and comparable rounds can remain stale.
- Follow-on investors may wait for one or two key financings before revising their category view.
- Hiring and spending commitments are difficult to unwind quickly.
Thus, a cold category is not necessarily a category whose technology suddenly ceased to work. It may be one in which the expected path from technical promise to fundable commercial evidence became too long or too capital-intensive.
Building your own map: a repeatable investment procedure
The academic evidence on VC booms helps ensure that the map contains more than investor psychology. Technology shifts, public-market conditions, LP capital, and the multistage structure of venture financing can each be causal inputs.
Venture Capital Booms and Start-Up Financing - Annual Reviews
Read these selected sections from the Annual Reviews article to ground the map in the institutional mechanics of venture cycles: staged financing, capital supply, valuations, and changes in the kinds of ventures funded.
Start in Section 2.3, on page 117, at “As noted above, substantial evidence of the procyclicality of VC investment has been found.” Read the multistage-financing mechanism. Then read Section 3.1, “Money Chasing Deals,” and the opening of Section 3.2, beginning at “Using data on more than 4,000 ventures with reported valuations.” Focus on how abundant capital affects valuations and deal terms, before continuing through the discussion of riskier experimentation during booms.
Use the following procedure when mapping a live category.
1. Set the boundary before naming variables
State:
- Unit of analysis: category, not an individual company.
- Stage: for example, pre-seed through Series A.
- Geography: a category can be hot in the United States and neglected in Europe for different reasons.
- Time horizon: typically long enough for two financing cycles and one meaningful commercial milestone.
- Question: for example, “Why are laboratory-automation companies raising at high prices despite limited revenue?” or “Why has an apparently viable category lost financing support?”
Without a boundary, a map becomes a catalogue of everything that could matter.
2. Start with an exogenous opportunity and an exogenous capital condition
A reflexive loop needs something to act upon. Begin with two possible external drivers:
- an opportunity driver, such as a lower cost of experimentation, a new model capability, regulatory change, or a shift in customer demand;
- a capital driver, such as public-market exit conditions, LP liquidity, interest rates, or a change in the number of active growth investors.
These drivers can initiate a cycle without themselves being caused by it. Keeping them separate stops the analysis from attributing every boom to herding.
3. Separate beliefs, signals, actions, and outcomes
For each claim, ask which of these it is:
| Claim | Proper location in a map |
|---|---|
| “A specialist fund led three large rounds.” | Public signal |
| “Investors now expect a winner-take-most outcome.” | Belief |
| “Companies can fund two more years of pilots.” | Capital-enabled behaviour |
| “Pilots convert into multi-site paid deployments.” | Fundamental commercial outcome |
| “The category deserves higher valuations.” | A conclusion requiring support, not a starting variable |
This is where many venture narratives fail. They move from a signal directly to an asserted fundamental, skipping the mechanisms in between.
4. Test every link with a counterfactual
Take one proposed causal relation at a time. Ask:
If this variable increased while relevant alternatives remained unchanged, would the next variable reliably increase, decrease, or remain ambiguous?
For example, more media attention may increase candidate inbound interest, but it may not increase customer retention. More capital may accelerate experiments, but it may not improve the underlying scientific feasibility. If the answer varies by company type or stage, split the variable rather than forcing a universal link.
5. Mark delays and identify the strongest counterforce
For each reinforcing loop, ask what slows or reverses it:
- Does talent scarcity raise cost faster than capital raises capability?
- Does a limited customer budget constrain adoption?
- Does follow-on financing depend on a narrow set of crossover investors?
- Does rising valuation create an expectation hurdle that operating progress cannot clear?
- Does a high-profile failure turn from firm-specific evidence into category-level stigma?
A contrarian thesis becomes more credible when it identifies the counterforce the consensus is underweighting, or shows why an apparently decisive counterforce is weaker than assumed.
6. Keep an evidence ledger beside the diagram
For the hypothetical laboratory-automation category, an initial ledger could look like this:
| Proposed link | Why it may hold | What would weaken the claim |
|---|---|---|
| Brand-name participation increases category visibility | Reputation attracts journalists, candidates, and investor attention | Comparable rounds and talent interest remain unchanged after prominent financings |
| More capital improves fundamentals after a delay | Capital funds deployments, product iteration, and specialised hiring | Deployment volume rises but paid conversion, retention, or workflow improvement does not |
| More entrants increase cost pressure | Firms compete for scarce scientific talent and early customers | Talent supply expands or the category creates complementary demand rather than rivalry |
| Higher valuations widen the valuation–progress gap | Pricing embeds future growth expectations | Commercial metrics improve at least as rapidly as expectations implied by pricing |
This ledger is not bureaucratic overhead. It converts a narrative into a set of claims that can be monitored and revised.
What a contrarian should look for in the map
The map is not a device for mechanically betting against popularity. It is a way to identify where consensus may be confusing a self-reinforcing signal with durable evidence.
A contrarian opportunity may arise when:
- the market sees a negative signal, such as one company’s failure, as proof that the entire category lacks potential;
- a financing drought has reduced startup formation and competition more than it has reduced the underlying customer problem;
- the category’s real constraint is funding duration rather than product-market fit, and a particular company has unusually low financing dependency;
- public comparables or one celebrated winner cause investors to overgeneralise from a small sample;
- the consensus underestimates a delayed fundamental improvement because the visible signals have temporarily deteriorated.
Conversely, justified avoidance may arise when capital is the only thing sustaining the apparent fundamental. If subsidised pilots, lavish hiring, and high burn are producing no durable customer value, a self-reinforcing financing loop is not rescuing an opportunity; it is postponing the recognition of a constraint.
Key takeaways
A causal-loop map makes a venture category analysable as a system rather than a slogan.
- Separate beliefs, signals, capital flows, behaviours, and fundamentals.
- Treat prestigious rounds, media attention, and comparable valuations as signals that may both reveal and alter reality.
- Look for reinforcing loops that can produce genuine progress as well as unjustified extrapolation.
- Include balancing loops and delays, especially competition, burn, financing dependency, and the gap between pricing-implied progress and observed progress.
- Attach evidence and falsification conditions to every important causal claim.
In the next lesson, this map becomes a diagnostic instrument: you will use its changing signals and constraints to distinguish neglect, discovery, acceleration, euphoria, reversal, and capitulation in a venture category.