
Hello. In the previous lesson, you defined a focused decision-support problem: a Director of Strategic Operations must assemble fragmented, permissioned evidence to recommend whether initiatives should be funded, deferred, stopped, or resequenced. That gave the capstone a user, a recurring decision moment, and a clear boundary: the platform augments judgment rather than making the decision.
Now we make the promise testable. A platform is not successful because it contains an LLM, retrieves documents, or launches on schedule. It is successful only if it produces a meaningful improvement for its user and the organization. By the end of this lesson, you will be able to write outcome statements that specify a baseline, target, and time horizon, then connect them to credible measurement methods.
From a product idea to a measurable promise
Begin with the difference between an outcome, a metric, and an output.
- An output is something the team delivers or operates: a connected data source, an indexed document collection, an AI-generated summary, or a deployed interface.
- A metric is a measurement: median preparation time, percentage of claims with valid citations, or hours of analyst effort per review.
- An outcome is the desired change in the user’s or organization’s reality, expressed through one or more metrics.
For example:
| Type | Example for the enterprise intelligence platform |
|---|---|
| Output | The platform indexes approved portfolio documents and returns cited evidence. |
| Metric | Median time to prepare a review-ready evidence pack. |
| User outcome | Strategic Operations directors can prepare review-ready evidence packs more quickly without losing traceability. |
| Business outcome | The organization reduces the labor required to prepare portfolio recommendations while preserving decision quality. |
“Increase monthly active users” is usually a metric or adoption signal, not the ultimate outcome. Higher use might matter, but only because it may contribute to a better user workflow and a business benefit. Likewise, “process 10,000 documents” may be necessary infrastructure work, but it does not demonstrate that Priya can make a more defensible recommendation.
The key discipline is to state the change you want in the real world first, then select measurements that could show whether that change occurred.
AWS Prescriptive Guidance frames this as value realization: define measurable value drivers early enough that the product can be instrumented to report them, and revisit the metrics as evidence improves.
AWS Prescriptive Guidance - Developing product ...
Read AWS Prescriptive Guidance’s discussion of value realization and success metrics. It connects product vision to quantifiable measures, explicit targets, and an iterative business case.
In the PDF, read the section “2. Define success metrics” on pages 5–6. Begin at value realization. Focus on three ideas: involve stakeholders in identifying value drivers, document how each metric is calculated, and pair every metric with an initial target and an expected time frame. Then review the preceding discussion of the OKR framework, which distinguishes longer-term objectives from shorter-term key results.
An executive-friendly structure is:
Objective: the enduring value you seek.
Outcome: the specific beneficial change for users or the business.
Metric: how that change is observed.
Baseline: current performance before the intervention.
Target: intended future performance.
Time horizon: when the target should be achieved.
For the capstone, an objective might be:
Enable faster, more defensible portfolio recommendations using permission-aware enterprise evidence.
It is directionally useful, but it cannot yet be managed. “Faster” and “more defensible” need operational definitions.
The anatomy of a measurable outcome
A useful outcome statement follows this pattern:
By [time horizon], improve [defined outcome] for [specific population] from [baseline] to [target], measured by [method], while maintaining [quality or risk guardrail].
Each part does different work.
| Component | Question it answers | Capstone example |
|---|---|---|
| Population | Whose performance counts? | Directors and analysts preparing eligible portfolio recommendations |
| Outcome | What real-world condition should improve? | Preparation becomes faster and more traceable |
| Metric definition | Exactly what is counted or timed? | Median active hours from assignment to review-ready recommendation |
| Baseline | What happens today? | 12 median staff-hours per eligible recommendation |
| Target | What future performance is meaningful? | 7 median staff-hours |
| Time horizon | By when should this be true? | Within six months of pilot go-live |
| Guardrail | What must not get worse? | Evidence traceability and authorization compliance |
The SMART framework is a helpful quality check, but it is not a substitute for measurement design.
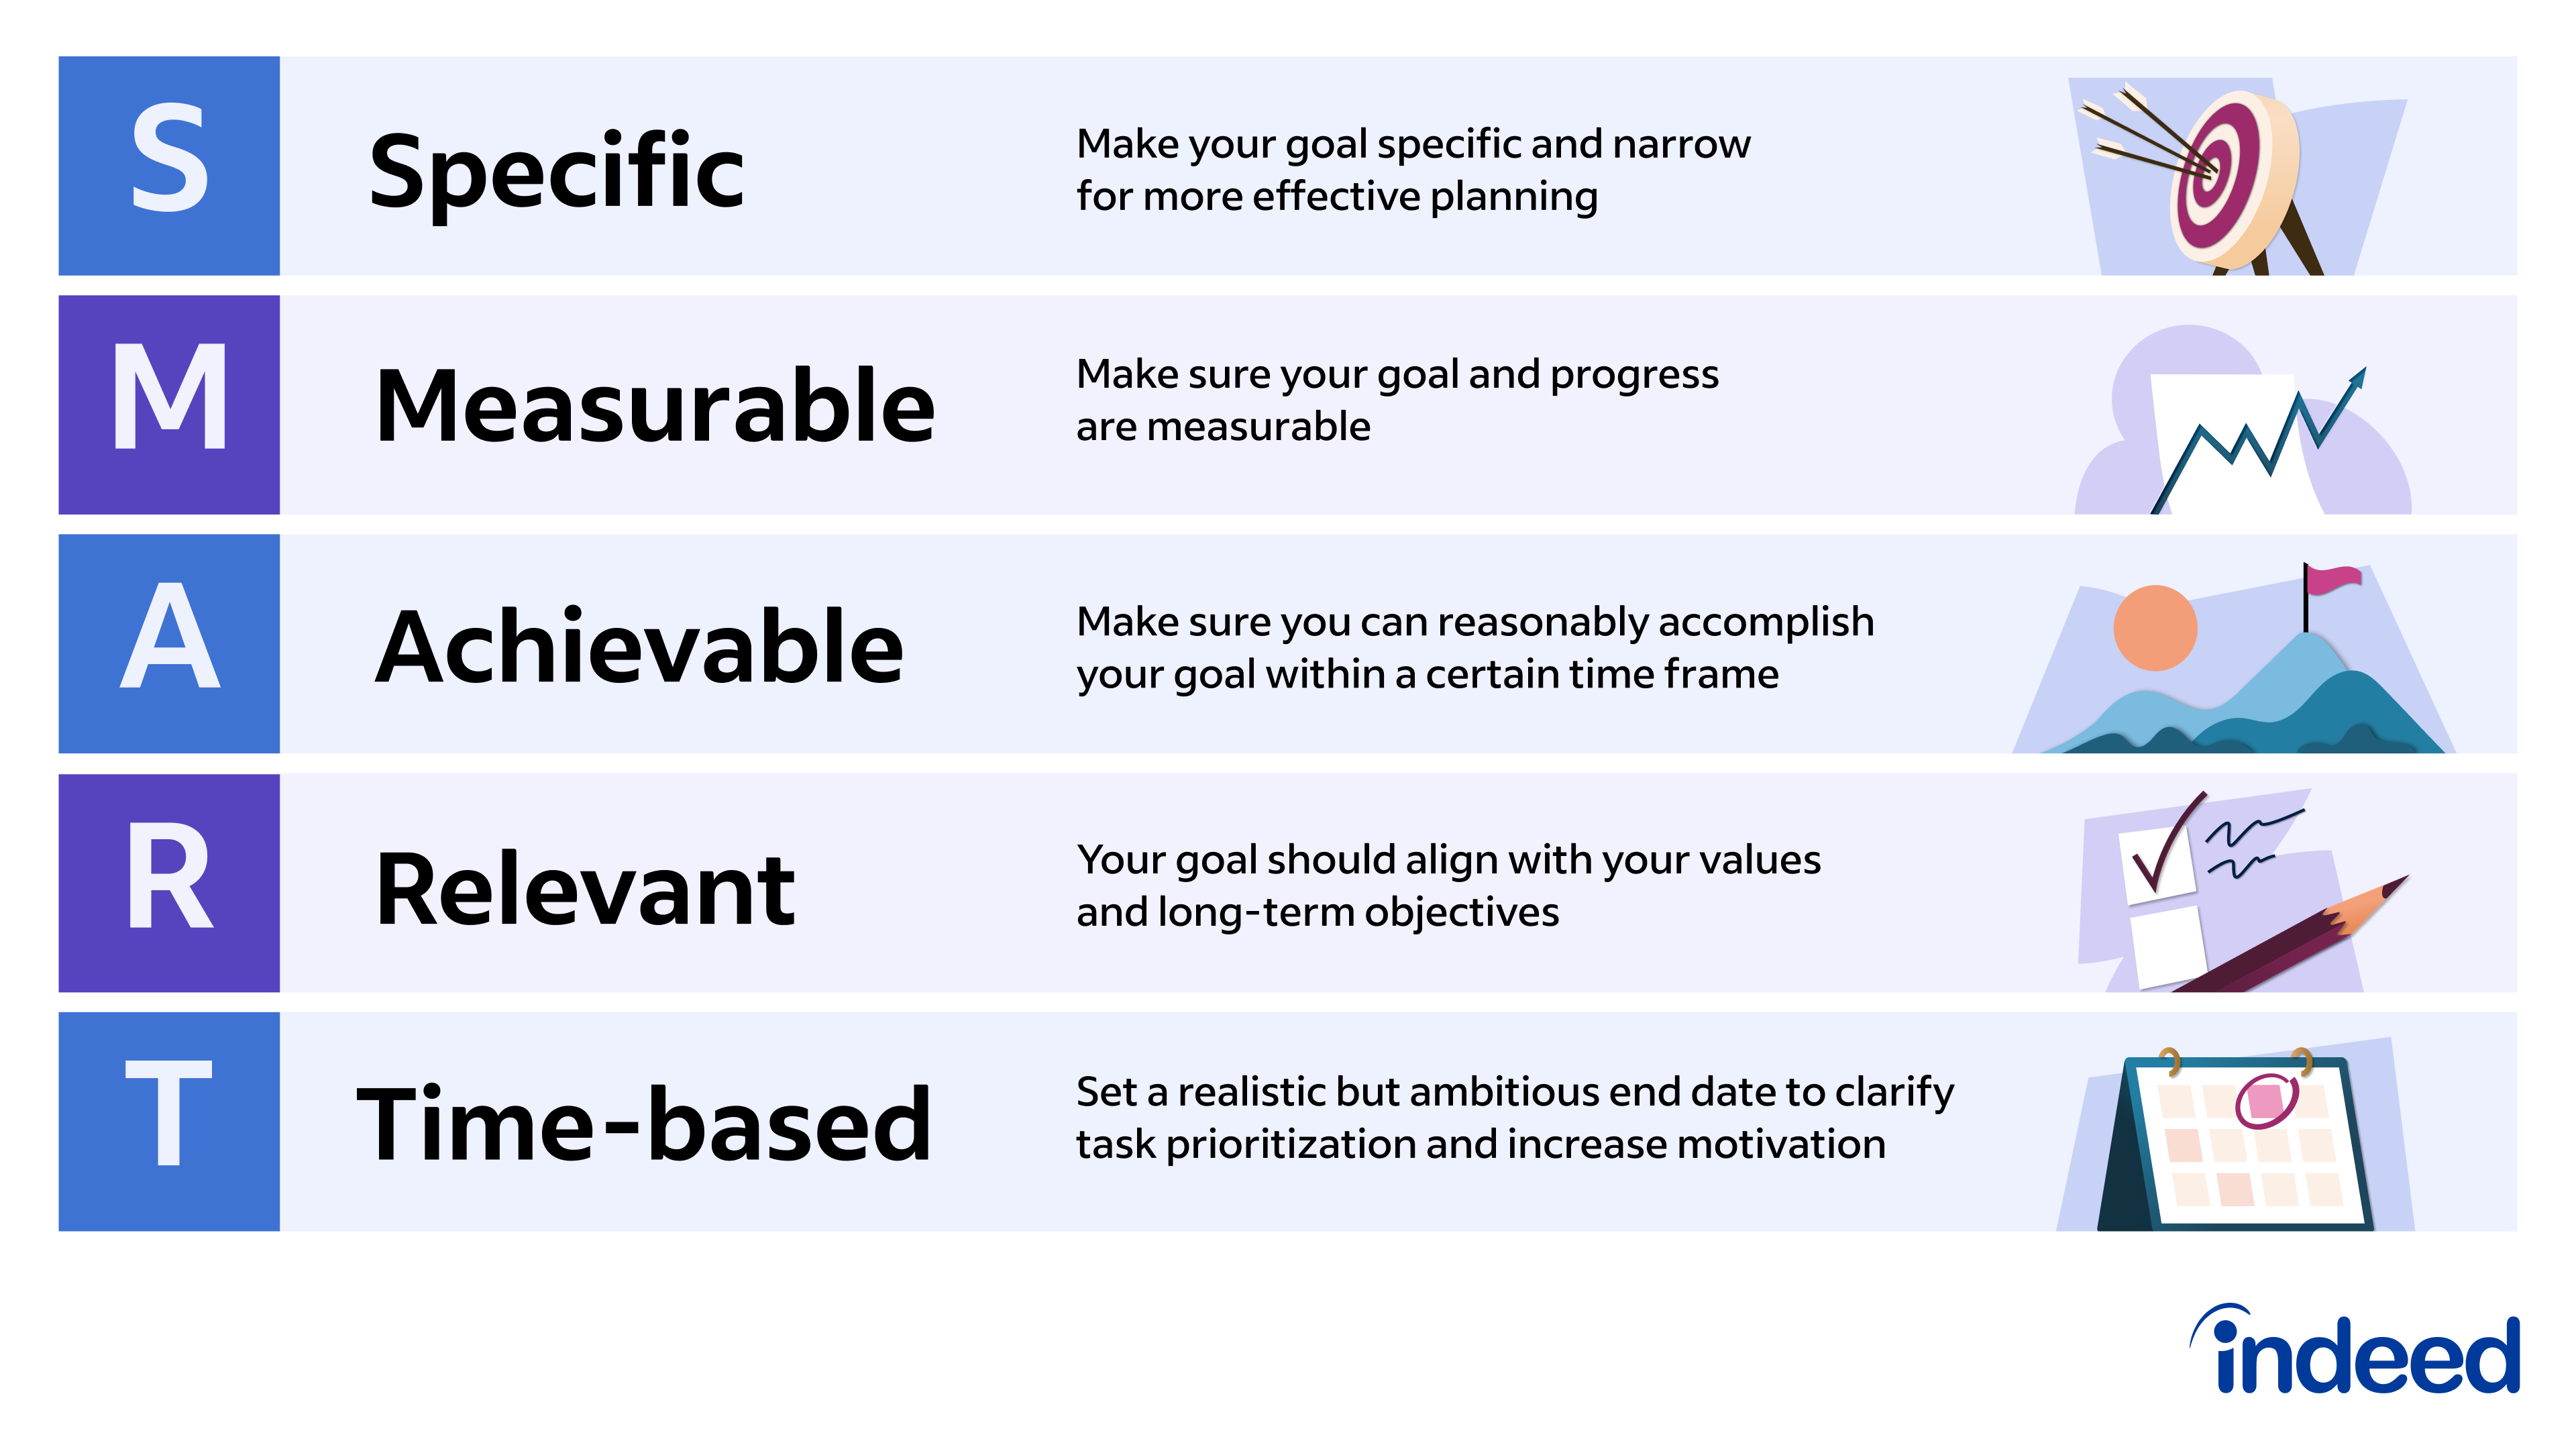
In practice, the two most commonly omitted elements are the baseline and the measurement definition. A target such as “reduce preparation time by 50%” sounds precise but is incomplete until you know:
- preparation time for whom;
- which work is included;
- when the clock starts and stops;
- whether you use the average or median;
- the historic value against which the reduction is calculated;
- the source of the data.
For a workflow with occasional unusually difficult initiatives, the median is often preferable to an average. One exceptionally complex recommendation can distort an average, whereas the median better represents a typical review.
Establish a baseline before claiming improvement
A baseline is the reference performance of the current process. It prevents a team from declaring success simply because a new system feels faster or produces impressive demonstrations.
For a new platform, your baseline normally comes from the legacy workflow, not from the platform’s first week of usage. Priya’s current process might involve document searches, email requests to subject-matter experts, spreadsheet reconciliation, and manual drafting. That is the process the capstone intends to improve.
The GOV.UK Service Manual offers a practical rule: measure continuously where possible, compare performance over time, and set a future target against the current baseline.
How to set performance metrics for your service - Service Manual - GOV.UK
Read the GOV.UK Service Manual guidance for a concise method of deriving benefits from user needs, forming a measurable hypothesis, and establishing a baseline for improvement.
First, in “Base your metrics on a sound understanding of your service’s purpose,” read purpose, benefits, and hypotheses. Notice how a user need becomes a short benefit statement and then a testable claim about how a service change creates value. Then move to “Give context to your measurements” in the later part of the page. Read the paragraph beginning with the discussion of performance “across all channels” through the baseline principle, followed by targets over time. Focus on why a one-time snapshot is weaker than a trend and why a target needs a specified future date.
Three honest baseline states
At capstone framing, do not invent precision. Mark the status of every baseline explicitly.
| Baseline status | Meaning | Appropriate action |
|---|---|---|
| Measured | Existing logs, time studies, audits, or financial records provide a value. | Record the value, period, cohort, and source. |
| Proxy | Direct measurement is unavailable, but a related measure is available. | Use it temporarily and state its limitation. |
| Unknown | Neither direct data nor a credible proxy exists yet. | Create a baseline-collection plan before committing to a final target. |
For example, “Priya spends a lot of time searching” is not a baseline. It is a qualitative problem signal. Turn it into a baseline by sampling a defined set of recent portfolio reviews:
- Select, for example, the last 8 to 12 eligible recommendations.
- Define the start and end of the work being measured.
- Collect preparation effort from work logs, calendars, task records, or a structured time study.
- Record exclusions, such as emergency reviews or initiatives with restricted data unavailable to the user.
- Calculate the agreed statistic, such as median staff-hours.
- Freeze the first baseline version, including the observation period and its known limitations.
This does not have to be perfect. It must be transparent enough that a stakeholder can understand what the number means and challenge it intelligently.
Segment before averaging
A single portfolio-wide number can conceal material differences. Segmenting means looking at meaningful subgroups separately. In this capstone, plausible segments include:
- first-time versus repeat platform users;
- routine monthly reviews versus urgent executive requests;
- recommendations involving one business unit versus several;
- initiatives with complete source data versus fragmented data;
- permitted users with full source access versus users with limited access.
Suppose the overall median preparation time falls, but only for simple single-business-unit reviews. That is useful evidence, but it does not prove the platform has improved the hardest cross-functional decision cases. Segmenting prevents overly broad claims.
Set targets and horizons that drive decisions
A target is not a wish. It is a decision criterion: a stated level of performance at which the team, sponsor, or investment committee will judge whether the initiative is progressing credibly.
The target should be demanding enough to justify investment, yet grounded in the baseline, workflow constraints, and rollout scope. A disciplined way to set one is to consider:
- Materiality: Would this improvement matter to users and sponsors?
- Feasibility: Could the first product scope plausibly produce it?
- Evidence: Is the target informed by historical variation, comparable internal workflows, or a pilot?
- Cost and risk: Would reaching it require unacceptable shortcuts, such as reducing evidence review?
- Decision use: What would the team do if the target is missed?
A time horizon makes the target observable. “Reduce preparation time by 40%” is ambiguous. “Reduce median active preparation time from 90 minutes to 45 minutes within 90 days of pilot go-live” is measurable.
Use several horizons, but avoid confusing them:
| Horizon | Purpose | Example |
|---|---|---|
| Baseline period | Establish current performance | Eight weeks before pilot go-live |
| Early adoption horizon | Confirm that intended users can use the workflow | Four to six weeks after pilot go-live |
| User-outcome horizon | Test whether the workflow improves for users | Within 90 days |
| Business-outcome horizon | Test organization-level efficiency or value realization | Within six months |
A business effect often takes longer than a user effect. It is reasonable to expect a director to retrieve cited evidence faster within a few months. It is less credible to claim immediate organization-wide savings before adoption, workflow change, and governance integration occur.
The following short video reinforces the distinction between high-level goals, observable signals, and a manageable set of action-guiding metrics.
Goals, Signals and Metrics | Key Business Metrics | Product Design | Udacity
Watch Udacity’s “Goals, Signals and Metrics.” It is useful for avoiding a common mistake: treating a convenient metric as the goal instead of defining the user or business improvement first.
Watch goals first for the distinction between a product goal and a metric. Continue with signals to see how positive and negative signals can indicate progress. Finish with metric selection, focusing on the warning against accumulating metrics that do not guide action.
A worked scorecard for the capstone
The values below are illustrative hypotheses, not claims about an actual organization. Replace them with your own measured baseline or an explicit plan to obtain one.
First, state the value hypothesis in plain language:
If the platform gives authorized portfolio staff fast access to current, cited evidence across approved enterprise sources, they will spend less time assembling evidence and produce more traceable recommendation packs. This should reduce the labor required for eligible portfolio reviews without degrading evidence quality.
Now convert it into outcomes.
| Outcome type | Measurable outcome statement | Baseline and measurement definition | Target and time horizon |
|---|---|---|---|
| Business outcome | Within six months of pilot go-live, reduce the median staff effort required to prepare an eligible portfolio recommendation. | 12 staff-hours median across the eight weeks before the pilot. Count time from assignment to submission of the review-ready recommendation, across defined preparer roles; exclude emergency reviews. | 7 staff-hours or less median within six months. |
| User outcome | Within 90 days of pilot go-live, enable Strategic Operations directors to assemble a review-ready, cited evidence pack more quickly. | 90 minutes median active time in a baseline time study for the initial evidence-pack assembly task. | 45 minutes or less median active time within 90 days. |
| User-value guardrail | Within 90 days, improve traceability of material factual claims in recommendation packs. | 75% of sampled material claims are supported by an appropriate source, based on an agreed human audit rubric. | 90% or more of sampled material claims meet the traceability standard within 90 days. |
Notice the relationship among these rows:
- The business outcome concerns organizational effort across the workflow.
- The user outcome concerns the primary user’s ability to complete an important task.
- The guardrail prevents speed from being treated as success if it comes at the expense of defensibility.
A platform could cut preparation time by producing polished but unsupported summaries. In this capstone, that would be a failure, not a success. The traceability guardrail holds the product to the user need defined in the prior lesson.
Specify the metric, not just its label
“Preparation time” is still not sufficient as a metric definition. A measurement register should state the calculation and data source.
| Field | Example specification |
|---|---|
| Metric name | Median active evidence-pack assembly time |
| Population | Authorized Strategic Operations directors participating in the pilot |
| Unit | Minutes |
| Start event | User begins a defined evidence-pack task |
| End event | User marks the pack ready for recommendation review |
| Aggregation | Median across eligible completed tasks per reporting period |
| Baseline window | Eight weeks before pilot go-live |
| Target window | Rolling 30-day period ending 90 days after go-live |
| Source | Task telemetry, workflow records, and periodic time-study validation |
| Exclusions | Emergency requests, training exercises, and tasks blocked by systems outside the pilot scope |
| Owner | Product manager with an analytics or operations partner |
| Review cadence | Weekly operational review; monthly sponsor review |
This level of specificity matters because teams otherwise measure different things while believing they are discussing the same metric.
Keep the scorecard small and balanced
A scorecard should be rich enough to reveal trade-offs but small enough to govern. For this stage of the capstone, use:
- one primary business outcome;
- one or two user outcomes;
- one quality, safety, or risk guardrail;
- optionally, one adoption signal to explain whether an outcome is not yet visible because people are not using the workflow.
An adoption signal might be:
At least 70% of invited pilot users complete one eligible evidence-pack task each week by the end of the first six pilot weeks.
This is useful diagnostic information, but it is not proof of value. If use is low, investigate access, onboarding, workflow fit, trust, or data coverage. If use is high but time and traceability do not improve, investigate retrieval quality, interface design, source permissions, or whether the platform addresses the wrong part of the workflow.
Do not collapse all value into a single “AI success” number. The product should be assessed through a balanced set of measures that makes trade-offs visible.
Create your Outcome and Measurement Register
Create a one-page register for the primary-user hypothesis from the previous lesson. Start with the three rows in the worked scorecard, then adjust the terminology, values, and data sources to fit your real context.
For each outcome, record:
-
Outcome statement
Write it in the “by when, from baseline to target, for whom” format. -
Metric definition
Define the unit, relevant population, inclusions, exclusions, aggregation method, and reporting period. -
Baseline
Record the current value, observation window, source, and status: measured, proxy, or unknown. -
Target and time horizon
State both the target level and a relative deadline, such as “within 90 days of pilot go-live.” Add a calendar date once the pilot date is known. -
Data source and accountable owner
Identify where the measurement will come from and who verifies its quality. -
Guardrail and decision rule
State what cannot degrade and what action follows if the metric misses target or the guardrail fails.
For an unknown baseline, write a collection plan rather than a fabricated number. For example:
During the two weeks before pilot configuration, audit ten recent eligible portfolio recommendations using the agreed evidence-traceability rubric. Record the percentage of material claims supported by an appropriate source. Use the result as version 1.0 of the baseline.
This is a stronger leadership artifact than an unsupported target because it surfaces the data dependency and assigns a practical next action.
Key takeaways
A measurable outcome is a testable promise about a beneficial change for a user or the organization. It is not a feature, activity count, or vanity metric.
For the enterprise intelligence platform:
- Define user and business outcomes separately, while showing how they support one another.
- Attach every key metric to a precise population, calculation method, baseline, target, and time horizon.
- Use the legacy workflow as the baseline for a new platform.
- Segment performance where meaningful differences may be hidden by averages.
- Include a quality or responsible-use guardrail so efficiency does not come at the expense of traceability, safety, or sound judgment.
- Mark uncertain inputs honestly and create a baseline-collection plan.
Next, you will compare candidate AI use cases through a value-feasibility-risk matrix, using these measurable outcomes as the criteria for deciding which use case deserves initial investment.
Can't find a good explanation? Sign up and we'll make it for you
Sign up