
Hello! Welcome back to our module on containerization with Docker.
In the last lesson, we successfully built our Spring Boot microservice into a Docker image and pushed it to a container registry. This made our application portable and ready for distribution. But what happens when that distributed application, now running in a container, doesn't behave as expected?
This brings us to today's crucial lesson. As a developer, your job doesn't end when the code is pushed. Being able to effectively troubleshoot a running service is a non-negotiable skill, especially in production environments. Today, we'll focus on the fundamental techniques for "getting inside the box." Our learning outcome is to debug a running container by accessing its shell, viewing logs, and inspecting its network.
This is a highly practical skill that frequently comes up in interviews, not as a trivia question, but through scenario-based problems like "Your service is timing out when calling another service, how would you investigate?"
1. The First Line of Defense: docker logs
When a container misbehaves, your first and most important diagnostic tool is its log output. The docker logs command fetches the standard output (stdout) and standard error (stderr) streams from your container's main process. For a Spring Boot application, this is where all your SLF4J or Logback output will go.
How to Access a Running Docker Container Shell (exec, attach, and logs)
To start, let's explore the primary commands for interacting with a running container. The article 'How to Access a Running Docker Container Shell' provides an excellent overview.
Please read the section 'docker logs: View Container Output'. Pay close attention to the various flags that allow you to filter and stream the log data, as these are essential for real-time debugging.
Based on the reading, here are the most critical docker logs commands you'll use daily:
-
View all logs:
docker logs my-container-name -
Follow logs in real-time (like
tail -f): This is invaluable for watching what happens as you reproduce an issue.docker logs -f my-container-name -
Show the last N lines: Perfect for quickly seeing the most recent activity.
docker logs --tail 100 my-container-name -
Filter logs by time: Extremely useful for investigating an incident that occurred at a specific time.
docker logs --since 1h my-container-name # Logs from the last hour
Remember, this only works if your application logs to stdout/stderr, which is a core principle of the twelve-factor app methodology we discussed earlier.
2. Going Deeper: docker exec
Sometimes, logs aren't enough. You might need to check the container's environment, view a configuration file, or see if a specific process is running. For this, you need a shell inside the container. This is the job of docker exec.
Unlike docker attach, which connects you to the container's main process (PID 1), docker exec starts a new process inside the running container. This is almost always what you want for debugging.
How to Access a Running Docker Container Shell (exec, attach, and logs)
Now, let's continue with the same article to learn about docker exec.
Read the section 'docker exec: Run Commands in Containers'. Focus on how to start an interactive shell and how to run single, non-interactive commands for quick checks.
There are two main ways to use docker exec:
-
Start an interactive shell: The
-itflags are crucial.-i(interactive) keeps STDIN open, and-tallocates a pseudo-TTY (a terminal).# For containers based on Ubuntu, Debian, etc. docker exec -it my-container-name bash # For minimal containers based on Alpine docker exec -it my-container-name shOnce inside, you have a command prompt and can explore the container's filesystem as if it were a regular Linux machine.
-
Run a single command: This is useful for quick checks without opening a full shell.
# Check environment variables
docker exec my-container-name env

# List files in the app directory
docker exec my-container-name ls -l /app

# Check running processes
docker exec my-container-name ps aux
How docker exec Really Works
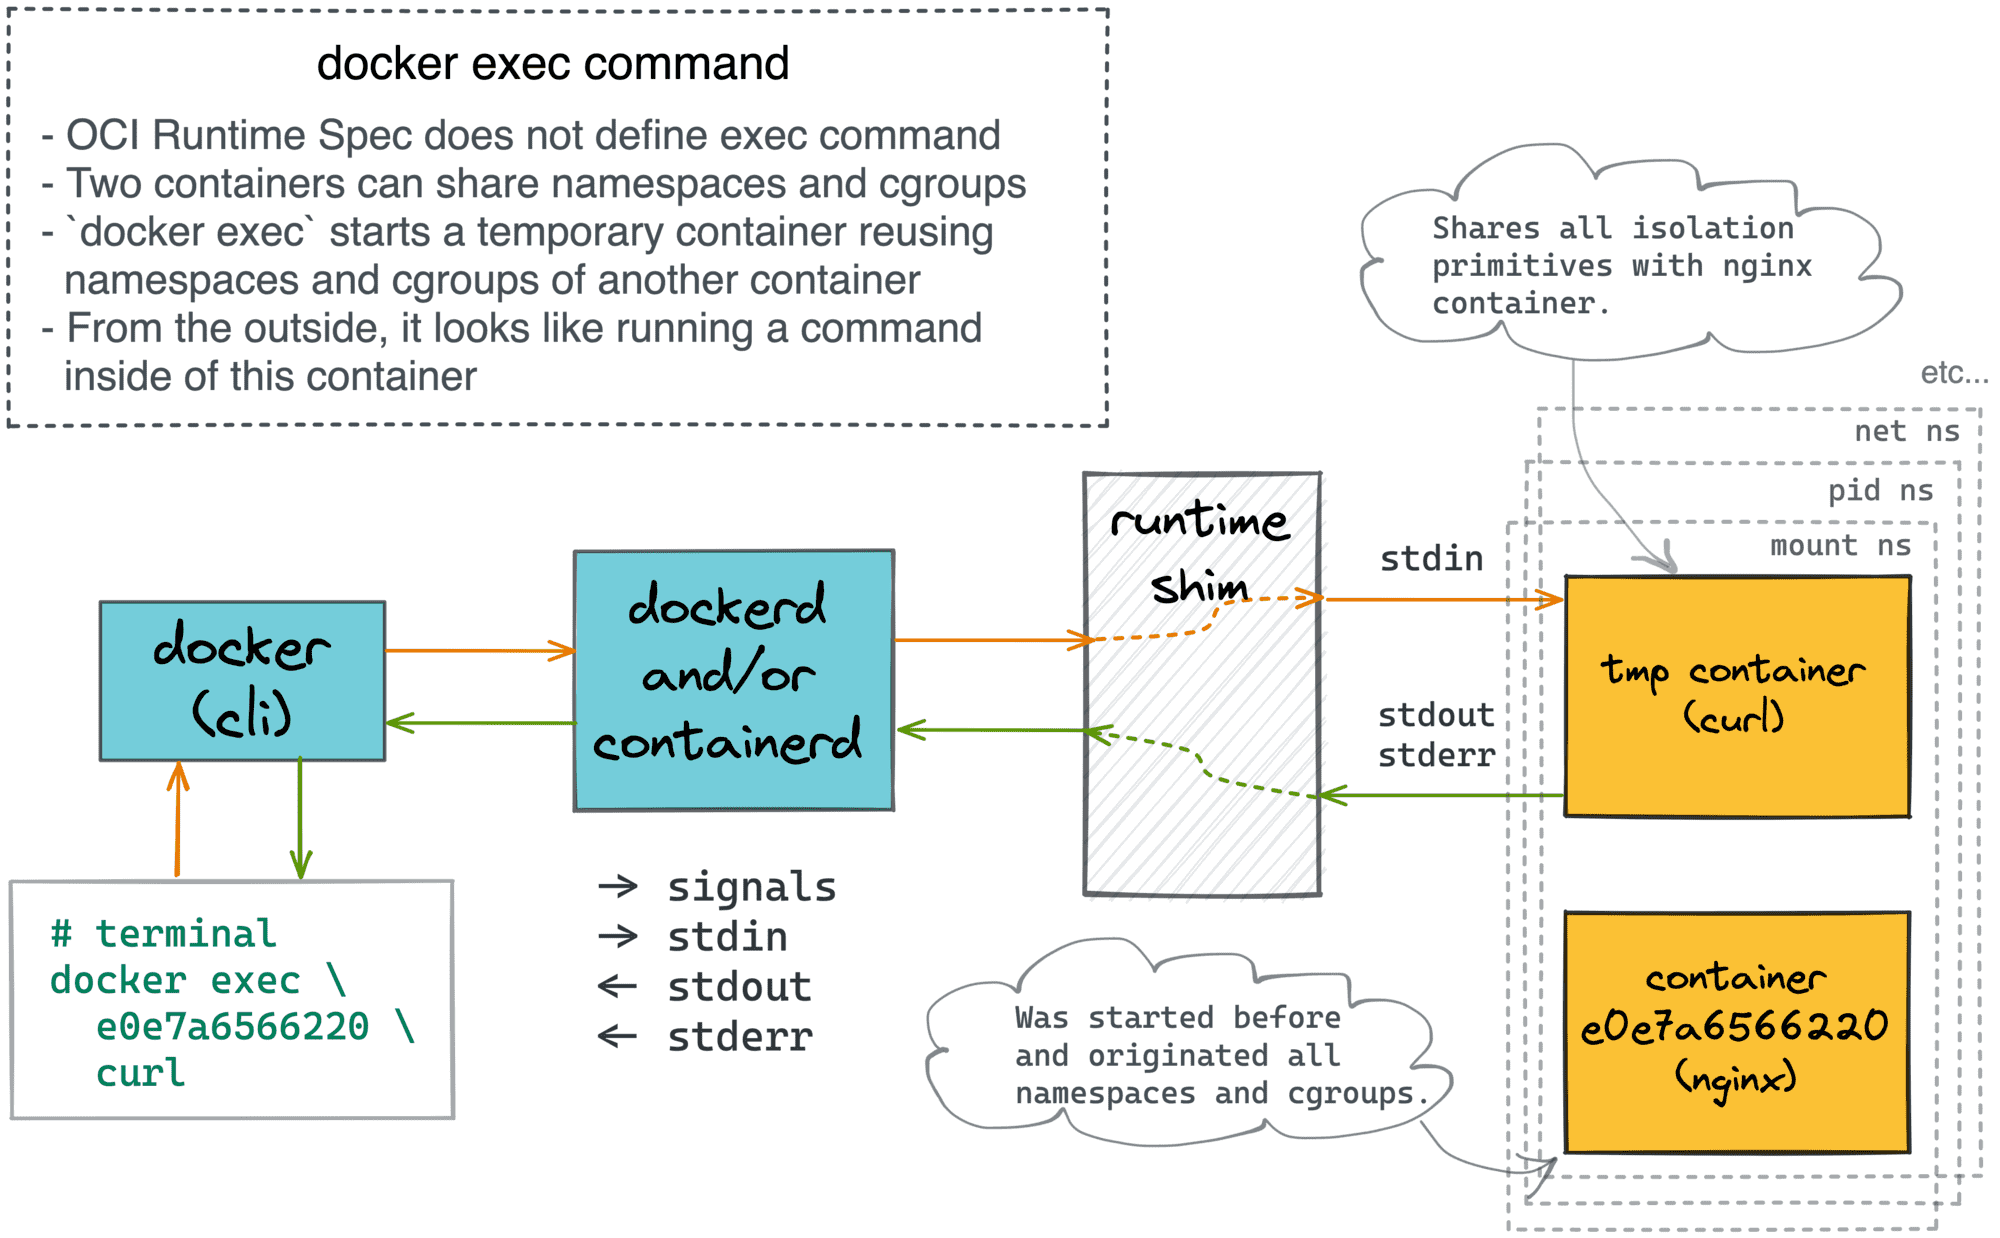
A key detail for a senior-level interview is understanding how exec works under the hood. It doesn't magically inject a process. Instead, the Docker daemon creates a temporary container that shares the same Linux namespaces (like the network, process ID, and mount namespaces) as the target container.
Test your understanding!
You suspect your Spring Boot application inside a container named order-service is failing because it's reading an incorrect database URL from an environment variable. What is the most direct docker command to verify the value of the SPRING_DATASOURCE_URL environment variable without starting a full shell?
Show answer
You would use docker exec to run the env command and pipe the output to grep.
docker exec order-service env | grep SPRING_DATASOURCE_URL
This executes env inside the order-service container, lists all environment variables, and filters the output on your local machine to show only the line containing SPRING_DATASOURCE_URL.
3. Investigating Network Issues
Many microservice issues are network-related: service discovery failures, firewall blocks, or incorrect port mappings. Your debugging skills must extend to the container's network stack.
How to Troubleshoot Docker Container Networking Issues
To become proficient in network troubleshooting, let's consult a specialized guide. This article provides a systematic approach to diagnosing common container networking problems.
First, read 'Diagnostic Commands' to learn the basic inspection commands. Then, jump to 'Container-to-Container Communication Issues' and 'Port Binding Issues' to understand two of the most frequent problem categories you'll encounter. Pay attention to the diagnostic steps for each.
Here’s a practical workflow for diagnosing network problems, combining docker commands with tools inside the container (via docker exec):
Step 1: Check the Basics
- Is the container connected to the right network?
# Get the container's IP and connected networks docker inspect my-container-name | grep "IPAddress" - Is the port mapping correct? Can the host machine see the container's exposed port?
docker port my-container-name
# Expected output might be: 8080/tcp -> 0.0.0.0:8080
Step 2: Test Connectivity from Inside
This is where docker exec becomes powerful.
-
Scenario:
service-acan't connect toservice-b
A common gotcha is that Docker's automatic DNS resolution by container name only works on custom user-defined networks, not the defaultbridgenetwork.# Test from inside service-a docker exec service-a ping service-b # If this fails, check if they are on the same custom network. -
Scenario: You can't reach your service from your browser at
localhost:8080
The port mapping might be correct, but the application inside the container might be listening only on itslocalhost(127.0.0.1) interface. A container'slocalhostis not the host machine'slocalhost. Your Spring Boot app must listen on0.0.0.0to be accessible from outside the container.# Check what address the app is listening on INSIDE the container docker exec my-container-name netstat -tlnp # Look for a line like: tcp ... 0.0.0.0:8080 ... LISTEN # If it says 127.0.0.1:8080, that's your problem!
Step 3: Use a "Network Swiss Army Knife"
Your production image might be minimal (e.g., distroless) and lack tools like ping, curl, or netstat. Instead of adding them to your main image, you can attach a dedicated debugging container that has all these tools pre-installed. nicolaka/netshoot is a popular choice.
# Attach a netshoot container to your running app's network namespace
docker run -it --rm --network container:my-container-name nicolaka/netshoot

# Now you have a shell with a full suite of networking tools
# to debug your application's environment.
# > ping service-b
# > curl http://google.com
# > nslookup database-host
Knowing this technique is a strong indicator of practical experience.
Conclusion
You now have a powerful toolkit for debugging live containers. This three-step process—checking logs, executing commands, and inspecting the network—will help you solve the vast majority of common container-related issues.
Key Takeaways:
- Start with
docker logs: Use-fand--tailto quickly assess the situation. - Use
docker execfor deep inspection: It allows you to run commands and open shells inside the container's isolated environment. Remember it creates a new process. - Master network troubleshooting: Check port mappings with
docker port, inspect IP addresses withdocker inspect, and test internal connectivity withdocker exec ... ping. - Remember common pitfalls: Service-to-service communication by name requires a custom network, and applications must listen on
0.0.0.0to be exposed externally. - Use debug containers like
netshootfor minimal images that lack diagnostic tools.
In our next lesson, we will zoom out. Managing individual containers is one thing, but running a complex microservices application with dozens of containers requires orchestration. We will begin our next module by introducing the fundamental architecture of Kubernetes, the de facto standard for container orchestration. You'll see how concepts like docker exec and docker logs have direct equivalents in the Kubernetes world with kubectl exec and kubectl logs.
Can't find a good explanation? Sign up and we'll make it for you
Sign up