
Good to see you again. In the previous lesson, you separated Steelo’s possible income into subscription, transaction, sponsorship, advertising, and service revenue. You also established an important discipline: money flowing through Steelo is not automatically Steelo revenue. Funds owed to artists, members, merchants, or payment providers must be separated from the amount Steelo actually earns.
This lesson turns those categories into a driver based model. Rather than writing “membership revenue: $X” or “sponsorship revenue: $Y” as unsupported assumptions, you will specify the measurable actions, prices, rates, and volumes that produce each amount. This is the basis of a credible forecast and of a prototype request that tests a commercial assumption rather than merely launching features.
Revenue is an output. Drivers explain why it exists.
A financial model is useful when it answers a practical question:
What would have to happen operationally for Steelo to generate this revenue, and what would it cost to make it happen?
“Steelo will make $500,000 from community commerce” is a target, not a model. A driver based version identifies the moving parts behind that number:
- Number of active artist communities
- Paying members per community
- Percentage of members purchasing an offer
- Orders per purchasing member
- Average order value
- Steelo’s take rate
- Number of partner campaigns sold
- Average retained fee per campaign
- Processing fees, payout obligations, and campaign delivery costs
A driver is a measurable input that has a causal relationship with a financial result. It should have:
-
A clear definition
“Active paying member” is more useful than “user.” Define whether a member must have paid in the current period, whether free trials count, and whether a refunded payment is excluded. -
A unit
Examples include members, orders, dollars per order, campaigns, percentage of GMV, or support tickets. -
A time period
Monthly is usually the most practical starting point for a young platform. Avoid mixing monthly members with annual pricing without making the conversion explicit. -
A plausible source
It may come from product data, payment records, a pilot, comparable market evidence, a signed proposal, or a deliberately labelled assumption. -
A financial connection
A metric matters to the model only when it affects revenue, direct cost, operating cost, working capital, or cash timing.
Watch this short sequence from Financial Modeling for Startups: Explained by Slidebean. It introduces the core principle that revenue should emerge from operational assumptions rather than be typed in as an unexplained output.
Financial Modeling for Startups: Explained - Startups 101
Watch Slidebean's explanation of driver based startup financial modelling. It provides a useful general framework before applying the approach to Steelo's membership, commerce, and opportunity model.
Watch the driver logic for the distinction between inputs and outputs. Then watch business examples, focusing on how different business models require different operational inputs. Finish with revenue drivers and scaling costs; note the use of average revenue per account, churn, active users, and capacity based costs.
A key implication for Steelo is that there is no single “growth rate” worth modelling. Membership revenue, merchandise fees, event fees, and sponsored opportunities grow for different reasons. They need distinct driver chains.
Start with a driver tree for each revenue stream
A practical model has three layers:
| Layer | What it contains | Example |
|---|---|---|
| Business activity | Things users and partners do | Members join, fans buy, brands book campaigns |
| Financial drivers | Measurable rates and prices attached to activity | Monthly price, conversion rate, order value, take rate |
| Financial outputs | Revenue and costs produced by the drivers | Subscription revenue, transaction fee revenue, processing cost |
The most important modelling habit is to avoid skipping the activity layer. For example, do not forecast commerce revenue from “total members” alone. Not every paying member purchases merchandise or attends an event every month.
1. Fan membership subscription revenue
The basic subscription formula is familiar:
The word average matters. If Steelo begins the month with 1,000 paying members and ends with 1,200, a rough monthly model should generally use the average number, 1,100, rather than only the closing balance.
To forecast active members, model the member base itself:
For a simple prototype forecast, reactivations can initially be set to zero if there is no evidence. What matters is that the assumption is visible rather than silently omitted.
The key membership drivers are:
| Driver | Definition | Why it matters |
|---|---|---|
| New paying members | Fans beginning a paid membership in the month | Determines growth |
| Monthly churn rate | Percentage of opening paying members who cancel or fail to renew | Determines retention |
| Average net monthly price | Average amount retained per active member after discounts, refunds, and price mix | Converts members into revenue |
| Paid conversion rate | Percentage of eligible free fans or prospects becoming paying members | Connects acquisition activity to subscriptions |
| Artist communities live | Communities capable of accepting paid members | Defines available supply |
For example, if Steelo has 1,100 average paying members at a net monthly price of $8:
That is a transparent subscription forecast. An owner can now challenge the actual assumptions: whether 1,100 members is attainable, whether $8 is acceptable, and whether the churn implied by the model is realistic.
Membership is not simply “linear”
Your current critique is directionally right: if every member pays one fixed monthly price, subscription revenue is mainly driven by increasing member count or price. That creates a fairly direct relationship:
But the correct commercial conclusion is not that subscriptions are bad. They can be predictable and valuable. The limitation is that they may not fully justify Steelo’s role when artists already have direct channels for fan access.
The opportunity is to use the trusted membership base to enable additional activity, while carefully protecting artists’ approval rights and members’ experience. The financial model should show exactly how that activity produces incremental revenue.
Commerce revenue needs buyer behaviour, not just audience size
For merchandise, tickets, paid experiences, or approved partner offers, the relevant platform activity is usually GMV, gross merchandise value. GMV is the total value of qualifying purchases completed through the platform before deductions.
Stripe’s marketplace metrics guide describes GMV as the total value of goods or services sold through a marketplace before fees and expenses, and distinguishes it from the marketplace’s own revenue.
Marketplace metrics: 14 key metrics to watch | Stripe
Read Stripe’s marketplace metrics guide to establish the difference between marketplace activity, platform revenue, and the behavioural metrics that drive commerce.
In the section “Gross merchandise value (GMV),” read the GMV discussion. Focus on why GMV measures transaction scale but is not the same as Steelo’s earnings. Then, in “Take rate,” identify how a platform’s retained percentage connects GMV to platform revenue. In the later sections “Conversion rate” and “Average order value (AOV),” read the behavioural metrics, noting how conversion and average order value make a revenue forecast measurable.
A useful commerce driver structure is:
Then calculate Steelo’s retained transaction revenue:
Suppose that in one month:
- 1,200 members are actively paying
- purchase a community offer
- Each buyer places 1.25 orders on average
- Average order value is $36
- Steelo earns a take rate
First, calculate purchasing members:
Then transaction count:
Then GMV:
Finally, Steelo’s transaction revenue:
The $10,800 tells the owner whether there is meaningful commercial activity inside the communities. The $1,080 tells the owner the gross transaction fee income Steelo retains before direct costs.
This distinction matters in a pitch. Do not say Steelo “earns” $10,800 from commerce if it only retains $1,080. Say instead:
In this scenario, Steelo facilitates $10,800 in monthly GMV and retains $1,080 in transaction fee revenue at a 10 percent take rate.
That is precise, commercially credible language.
Sponsored opportunities require a separate driver model
The proposed redistribution or opportunity model has more potential than a generic “brand advertising” claim, but it must be modelled as a specific commercial system.
A possible Steelo offer is:
A commercial partner funds an artist approved community activation. Steelo curates the match, coordinates delivery, verifies agreed participation, administers payments, and reports outcomes. The artist retains approval over whether the opportunity enters their community.
This model may include several cash flows:
- A brand pays a campaign amount to Steelo.
- Steelo retains a sponsorship and or service fee.
- A portion is paid to the artist.
- A portion may be paid to participating members as rewards or commissions.
- Steelo incurs verification, processing, campaign management, and support costs.
The gross amount paid by the sponsor is therefore not automatically Steelo revenue. For planning purposes, treat the sponsor’s total budget and Steelo’s retained fee as separate lines.
A practical campaign revenue formula is:
The campaign volume itself can be driven by the commercial pipeline:
For a prototype, that may initially be too detailed. You can model a smaller number of assumptions:
| Driver | Example definition | Why it matters |
|---|---|---|
| Qualified opportunities | Brands or merchants fitting the artist and community | Measures relevant demand, not generic leads |
| Campaign close rate | Percentage of qualified opportunities that sign an agreement | Tests sales viability |
| Average sponsor budget | Total amount paid for a campaign | Indicates commercial value |
| Steelo retained fee | Portion contractually retained by Steelo | Determines Steelo’s revenue |
| Artist payout | Agreed payment to the artist | Affects cash flow and direct economics |
| Member reward budget | Amount paid to participating members | Incentivizes activity but is not Steelo revenue |
| Verified participation rate | Percentage of campaign actions verified as valid | Tests whether promised delivery can be measured |
Suppose two campaigns complete in a month. Each sponsor pays $12,000, of which $8,000 is contractually retained by Steelo for campaign rights and managed delivery, while $4,000 is reserved for artist and member payments.
In this simplified planning example, Steelo models $16,000 of campaign related revenue. The other $8,000 is not treated as Steelo revenue merely because the cash may temporarily pass through Steelo’s payment account. It is an obligation to participants, subject to the eventual contractual and accounting treatment.
This is the financial core of your pitch: not “we will place brands in communities,” but “we can test whether artist approved opportunities produce a sufficient retained fee after participant payouts and operating costs.”
Map each cost to the activity that creates it
Revenue drivers alone produce an incomplete and often misleading model. Every meaningful activity has a cost consequence.
The image below shows the basic card payment chain. A customer pays, the payment gateway and card network process and route the transaction, the issuer authorizes it, and the merchant receives funds after applicable fees. For Steelo, this means payment processing cost is usually tied to payment volume and transaction count, not simply to the number of employees.
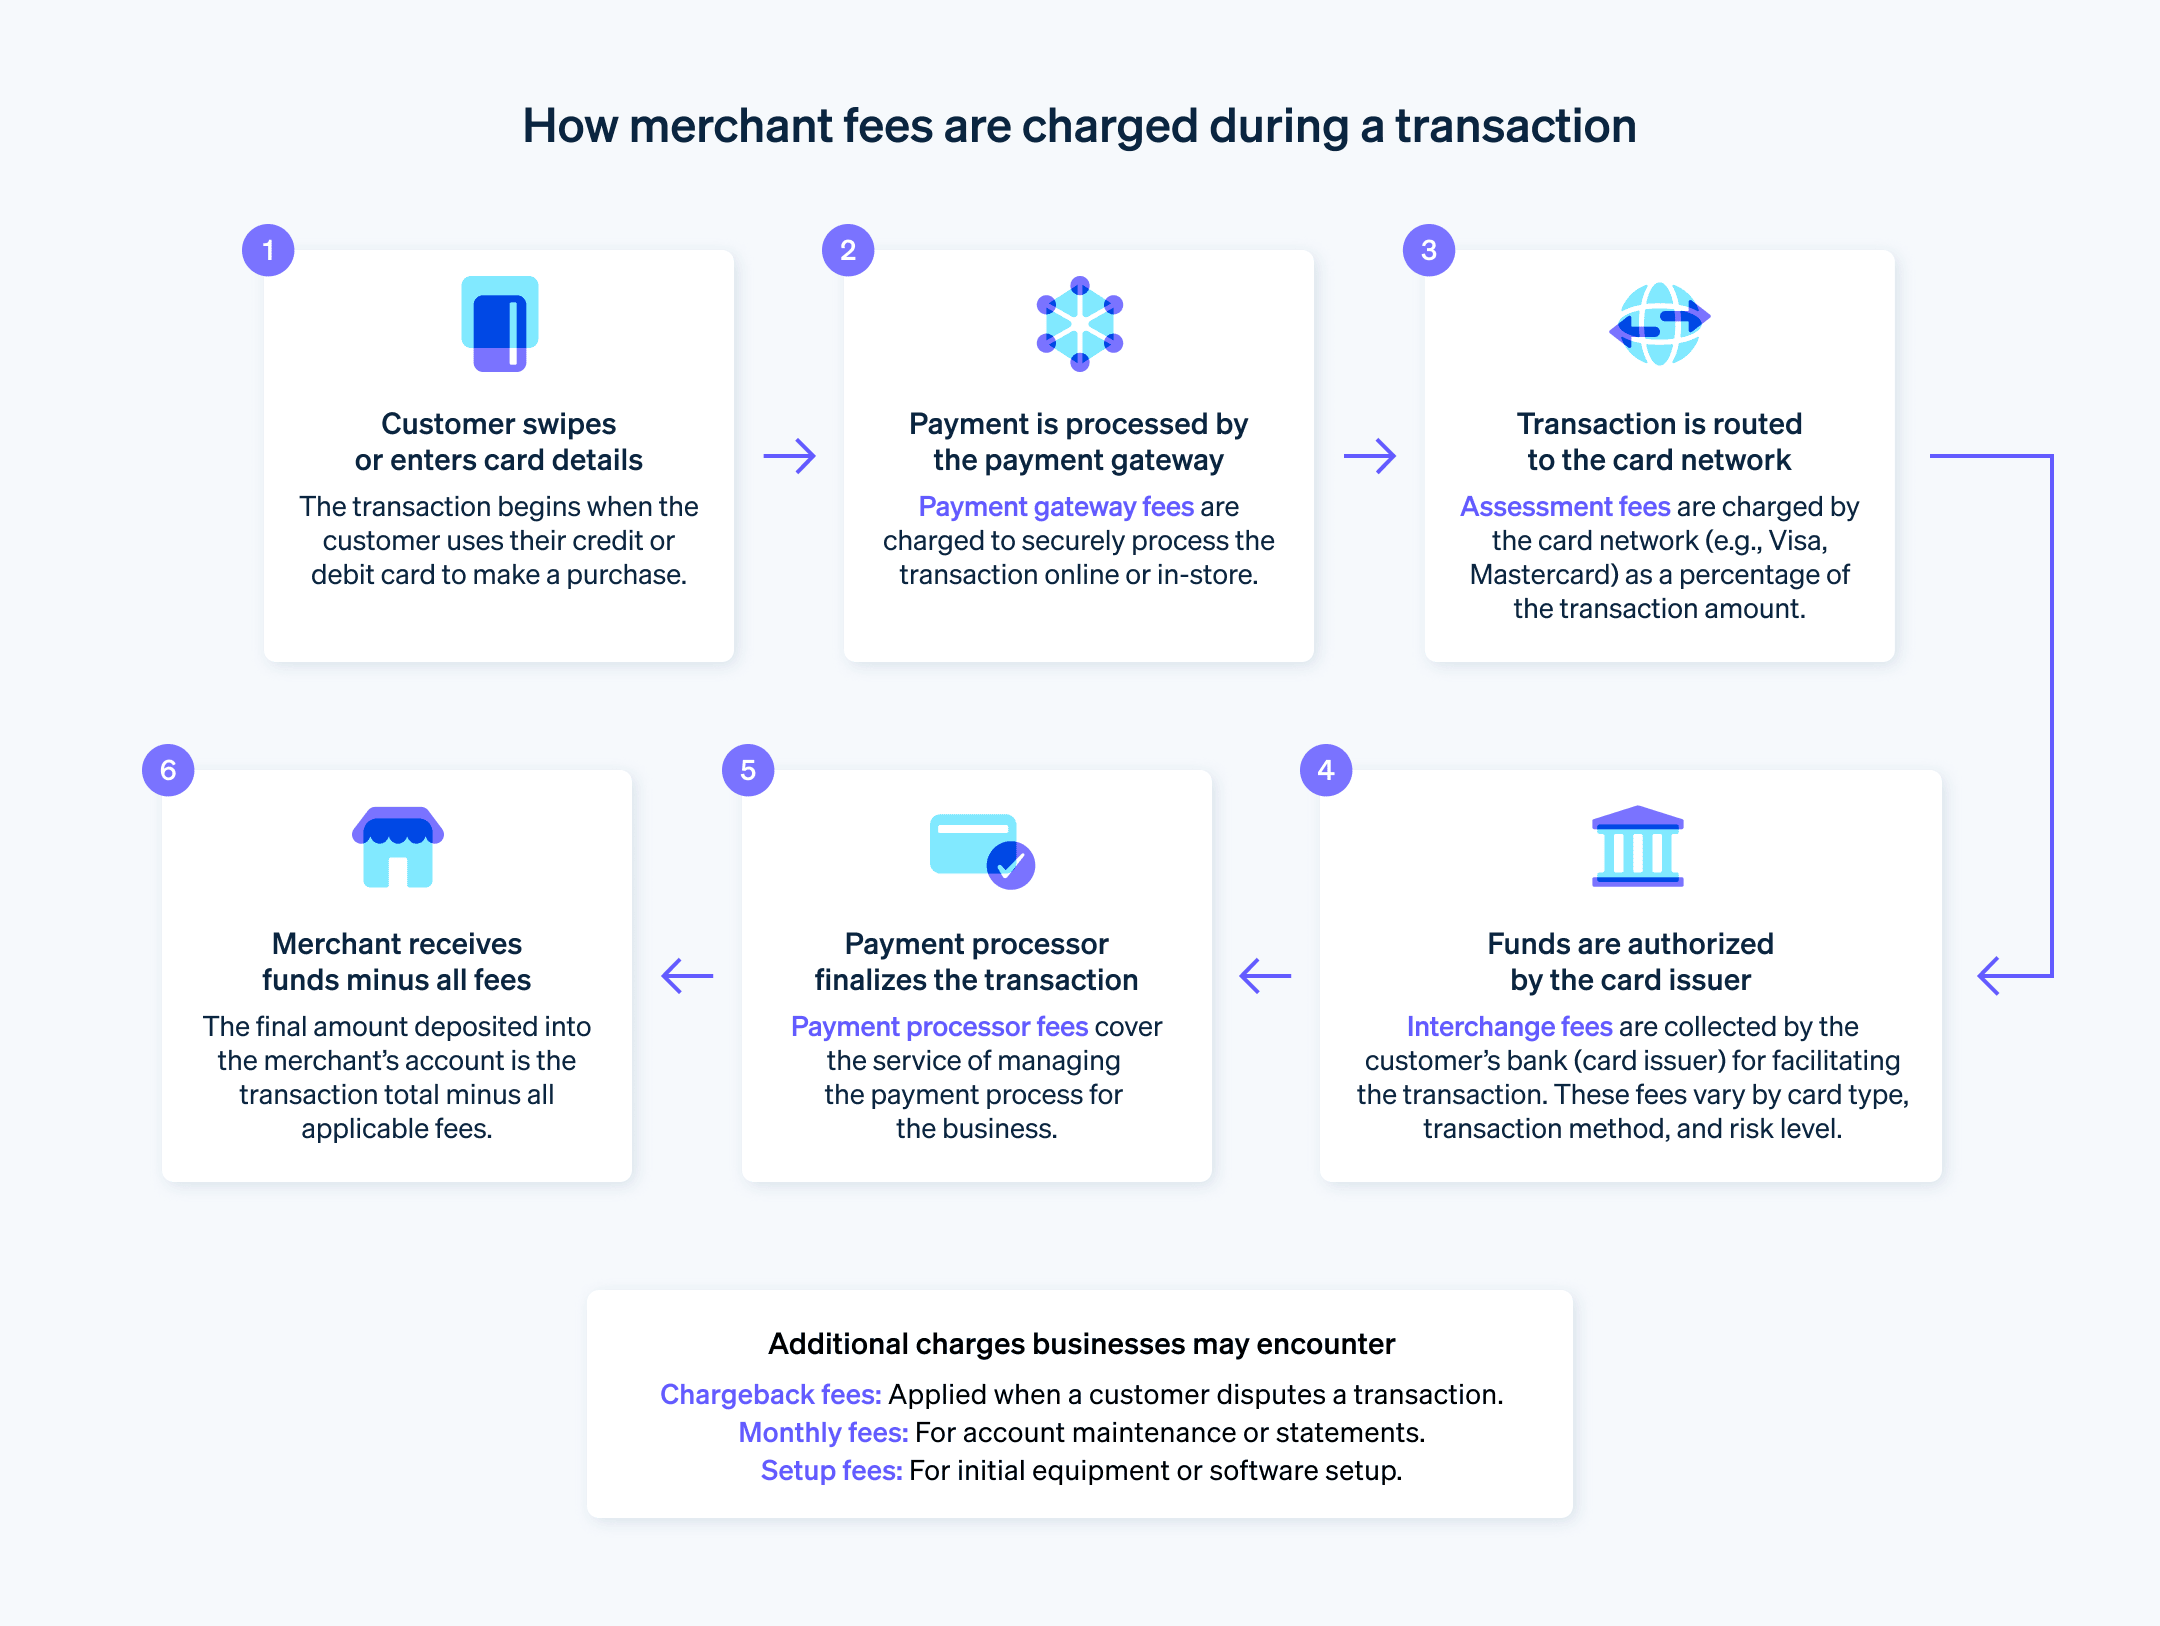
For payment costs, a common driver formula is:
Using the commerce example above, assume all 300 orders are processed by Steelo and the payment provider charges plus $0.30 per transaction.
That fee is not a minor detail. It consumes more than one third of the $1,080 transaction fee income in this illustration, before refunds, customer support, fraud, or any merchant incentives.
The marketplace model tutorial from Slidebean demonstrates how setup fees, commissions, buyer fees, transaction volume, and payment processing interact. Watch the selected segments for the mechanics, while treating its illustrative rates as examples rather than benchmarks for Steelo.
Marketplace Financial Model Tutorial: Projecting Revenue
Watch Slidebean’s marketplace financial model walkthrough for a practical view of how marketplace activity becomes fees, payouts, and payment costs.
Watch seller revenue to see setup fees, commissions, and subscriptions treated as separate revenue mechanisms. Then watch buyer fee mechanics, focusing on the distinction between order value, buyer charges, and amounts due to sellers. Continue with billing structure for the operational importance of who collects customer payment, and finish with processing costs to see why fees must be included in transaction economics.
For Steelo, a useful initial driver map looks like this:
| Financial line | Primary measurable driver | Supporting driver examples |
|---|---|---|
| Fan membership revenue | Average active paying members | New members, churn, reactivations, net price |
| Artist subscription revenue, if offered | Active artist accounts | Plan mix, monthly software price |
| Merchandise transaction revenue | GMV | Buyer conversion, orders per buyer, average order value, take rate |
| Event fee revenue | Paid tickets sold | Events live, tickets per event, ticket price, fee rate |
| Sponsorship and opportunity revenue | Completed paid campaigns | Qualified leads, close rate, retained fee per campaign |
| Managed service revenue | Projects or service retainers delivered | Setup projects, campaign management days, monthly service price |
| Payment processing cost | Processed payment value and transactions | Percentage fee, fixed fee per transaction |
| Artist and member payouts | Eligible campaign actions or agreed budgets | Payout per verified action, artist share, approved reward pool |
| Campaign verification cost | Verified actions or campaigns | Cost per action, vendor fee per campaign |
| Community support cost | Active members and support demand | Tickets per member, resolution time, members per support employee |
| Infrastructure cost | Active users and product usage | Monthly active users, media storage, messages, streamed content |
| Partner acquisition cost | Partners acquired or campaigns closed | Sales spend, partner acquisition cost, sales staff capacity |
| Refund and chargeback cost | Transaction volume and dispute rate | Refund rate, average order value, chargeback fee |
Do not force perfect precision at this stage. The aim is to identify the cost relationship honestly. A new platform may not know its support tickets per member or its verified action cost. That is acceptable if the model labels these as assumptions to validate.
Read marketplace monetization as a set of measurable mechanisms
Stripe’s marketplace guide is useful here because it separates common marketplace income mechanisms such as commissions, subscriptions, advertising, listing fees, and service fees. The point is not to adopt every mechanism. It is to attach a specific measurable driver to each mechanism Steelo chooses to operate.
How to build a marketplace: A quick-start guide
Read Stripe’s overview of marketplace revenue streams to reinforce the idea that each revenue mechanism has its own trigger and therefore needs its own driver set.
In the subsection “Marketplace revenue streams,” read the revenue stream overview. For each mechanism, identify the event that earns the marketplace money: a sale, a listing, an active subscription period, promotional delivery, or a value added service. Apply that trigger logic to Steelo rather than assuming all community activity creates revenue.
Consider how the same Steelo community can generate very different financial lines:
| Activity | Measurable driver | Formula for planning |
|---|---|---|
| Fan joins a membership | New paying members | New members net monthly price |
| Fan renews a membership | Retained paying members | Retained members net monthly price |
| Fan buys artist merchandise | GMV and take rate | GMV platform take rate |
| Fan buys an event ticket | Tickets sold and fee per ticket | Tickets sold ticket fee |
| Brand funds an artist approved activation | Completed campaigns and retained fee | Campaigns retained fee |
| Artist pays for campaign setup | Implementation projects | Projects setup fee |
| Merchant pays for a featured offer | Paid promotional placements | Placements sold price per placement |
The logic is consistent: count the economic event, attach a price or rate, then subtract the costs caused by that event.
A worked monthly Steelo model
The following simplified example brings the pieces together. It is not a forecast to present as fact. It is a transparent calculation structure that can be populated with evidence.
Assumptions
| Revenue or cost area | Assumption |
|---|---|
| Average active paying members | 1,200 |
| Average net membership price | $8 per month |
| Members buying a community offer | |
| Orders per buyer | 1.25 |
| Average order value | $36 |
| Steelo commerce take rate | |
| Completed artist approved campaigns | 2 |
| Sponsor payment per campaign | $12,000 |
| Steelo retained campaign fee | $8,000 per campaign |
| Artist and member payout budget | $4,000 per campaign |
| Payment processing fee | plus $0.30 per transaction |
| Campaign verification and management cost | $1,000 per campaign |
| Artist setup projects delivered | 3 |
| Setup fee per project | $500 |
Financial outputs
Membership revenue
Commerce GMV
Commerce transaction revenue
Campaign related revenue
Setup service revenue
Total modelled revenue
Now identify activity linked cash obligations and costs.
Payment processing cost
There are 300 orders:
Participant payout budget
Campaign verification and management cost
This creates a much better owner conversation than a generic claim that “two campaigns generate $24,000.” The commercial reality is clearer:
| Measure | Amount | Interpretation |
|---|---|---|
| Total sponsor cash paid | $24,000 | Gross campaign budget passing into the ecosystem |
| Steelo retained campaign fee | $16,000 | Modelled campaign related revenue |
| Artist and member payout budget | $8,000 | Funds owed to participants, not assumed Steelo revenue |
| Campaign delivery cost | $2,000 | Direct operational cost to serve the campaigns |
| Commerce GMV | $10,800 | Purchase activity through community offers |
| Commerce transaction revenue | $1,080 | Steelo’s percentage fee before direct costs |
This approach does not settle the final accounting presentation. Whether Steelo reports a gross amount or a net commission depends on contractual responsibilities, who controls the promised service, who bears fulfillment risk, and other accounting considerations. For commercial modelling now, the essential discipline is to separately show:
- Total customer or sponsor payment
- Amount contractually retained by Steelo
- Amount owed to artists, members, merchants, and suppliers
- Costs incurred by Steelo to deliver the service
Build an assumption register, not a hidden spreadsheet
Early models often fail because their assumptions are buried inside formulas. A stronger approach is to keep a concise register alongside the forecast.
| Assumption | Initial value | Evidence status | How Steelo can validate it |
|---|---|---|---|
| Net monthly membership price | $8 | Proposed | Test willingness to pay with pilot communities |
| Monthly member churn | Unknown | Track cohort renewals over several billing cycles | |
| Commerce buyer conversion | Hypothesis | Measure purchase behaviour after targeted offers | |
| Average order value | $36 | Benchmark or merchant estimate | Review actual completed orders |
| Take rate | Proposed | Test merchant and artist acceptance against value delivered | |
| Qualified partner opportunities | 10 per month | Hypothesis | Track outreach, referrals, and inbound leads |
| Campaign close rate | Unknown | Compare signed campaigns with qualified opportunities | |
| Retained fee per campaign | $8,000 | Proposed | Use partner proposals and negotiated contracts |
| Verification cost per campaign | $1,000 | Estimate | Obtain supplier quotes or measure internal time |
| Member reward payout | $4,000 per campaign | Contract design assumption | Define reward rules and estimate eligible participation |
Do not disguise weak evidence with unnecessary decimal places. A forecast that says churn is implies a level of knowledge Steelo may not yet have. At prototype stage, a range such as , , and is often more honest and more useful.
A strong operator can say:
Membership pricing is a proposal. The merchant take rate is a proposal. The campaign close rate is unvalidated. We have separated them, assigned each a measurement method, and will use the prototype to replace the riskiest assumptions with evidence.
That is a stronger investment case than presenting a smooth growth chart without an explanation of how growth occurs.
A practical routine for translating any new idea into drivers
When Steelo considers a new commercial feature, use this routine before adding it to a forecast.
-
State the exchange precisely
Name the payer, recipient, thing sold, and contractual trigger. For example, “a local venue pays for a verified artist approved ticket campaign.” -
Identify the counted event
It might be an active month of membership, completed order, ticket sold, campaign delivered, or project completed. -
Choose the unit economics
Use a price per member, fee per ticket, percentage of GMV, retained fee per campaign, or fee per project. -
Identify direct cash obligations and delivery costs
Include processing, participant payouts, refunds, verification, fulfilment, partner commissions, and required support. -
Define the evidence source and confidence level
Distinguish measured data, contract terms, supplier quotes, comparable evidence, and untested assumptions. -
Keep activity, GMV, revenue, and cash separate
A campaign budget, a commerce GMV figure, and Steelo’s revenue can all be large numbers, but they describe different economic realities.
This routine lets you evaluate the proposed model as a portfolio of revenue engines rather than a vague expansion from “fan access” into “opportunities.”
Key takeaways
A driver based model translates Steelo’s business model into measurable, challengeable assumptions.
- Membership revenue is driven by active paying members and net monthly price, with acquisition and churn explaining member movement.
- Commerce revenue should be modelled from buyer conversion, purchase frequency, average order value, GMV, and Steelo’s take rate.
- Sponsored opportunity revenue should be based on campaigns completed and Steelo’s retained fee, not the total sponsor budget passing through the platform.
- Costs must follow activity, including payment fees, participant payouts, campaign verification, support, and infrastructure.
- A transparent assumption register distinguishes evidence from hypotheses and turns the prototype into a measurement tool.
Next, you will classify Steelo’s operating costs by two dimensions: fixed versus variable and direct versus indirect. That classification will show which costs rise with transactions or members, which costs exist before revenue arrives, and where the model’s operating risk really sits.
Can't find a good explanation? Sign up and we'll make it for you
Sign up