
Welcome. This module examines why venture categories can move from obscurity to consensus enthusiasm, and then from disappointment to broad stigma. We begin with a statistical source of distortion that is easy to acknowledge in principle yet repeatedly mishandled in practice: early-stage outcomes are not evenly distributed. A small number of extreme successes can dominate both returns and the stories investors tell about an entire category.
By the end of this lesson, you should be able to explain why a few visible winners are weak evidence that “the category works,” especially when the underlying sample is small and the failed or merely ordinary companies have disappeared from view. This is foundational for contrarian VC: it helps distinguish genuine category learning from retrospective myth-making.
1. The distribution matters more than the average
In a conventional investment setting, one often expects observations to cluster around a reasonably informative average. In early-stage venture, that intuition is hazardous. Outcomes are typically right-skewed: many investments produce little or nothing, while a tiny minority generate very large outcomes.
A power-law-like distribution is an extreme version of this pattern. If returns have a heavy right tail, exceptionally large values are rare but consequential enough that they can dominate aggregate results. The relevant practical point is not whether every dataset satisfies a perfect mathematical power law. It is that VC outcomes frequently have a tail heavy enough that:
- the mean is pulled upward by a few exceptional companies;
- the median company can look very different from the mean company;
- a small sample can be dominated by one observation;
- historical winners become unusually persuasive evidence, whether or not they are representative.
For example, suppose a category contains twelve funded companies. Ten return , one returns , and one returns . The average gross multiple is , despite the fact that eleven of twelve investments did not produce a meaningful venture outcome. “The average return was attractive” and “a typical company did well” are entirely different claims.
That distinction matters at category level. A successful company in a category may demonstrate that a large outcome is possible. It does not, on its own, demonstrate that:
- the category is broadly investable;
- the original entry valuations were sensible;
- the winning company’s advantages can be replicated;
- new entrants can capture similar economics; or
- the category’s present conditions resemble those at the winner’s formative moment.
The need to tolerate this asymmetry is real. It is partly why early-stage firms often use a “champion” rather than consensus decision rule: an exceptional company can possess one overpowering strength while looking weak on many ordinary checklist dimensions. But the same asymmetry also makes inference fragile. The fact that a small number of huge outcomes exist does not license indiscriminate extrapolation from them.
Power-Law Returns in Venture Capital: Strategies for Building and Working with Great Companies
Watch “Power-Law Returns in Venture Capital: Strategies for Building and Working with Great Companies” from Berkeley School of Information. It gives a concise visual introduction to heavy-tailed venture outcomes and to the feedback through which successful companies can accumulate further resources.
Watch the distribution intuition for the contrast between a normal distribution and a heavy-tailed one. Then watch the return data, focusing on the distinction between a category with many losses and a portfolio whose aggregate result is nevertheless dominated by a small number of extreme gains. Treat “power law” here as a warning about aggregation and inference, not as a claim that every startup category inevitably yields a winner.
The empirical record is consistent with this. In research using realized round-level data, seed returns appear more heavy-tailed than later-stage returns: the downside is common, while the extreme upside is concentrated in a small fraction of investments. This is especially relevant to pre-seed through Series A, where the absence of operating history leaves investors with sparse and noisy evidence precisely when outcome variance is greatest.
2. Why small samples make categories look clearer than they are
Small samples are not merely incomplete; under a heavy-tailed distribution, they are systematically prone to dramatic but misleading patterns.
Suppose an emerging category has only eight credible venture-backed companies. If one breaks out, observers may infer a general rule: “Customers clearly want this,” “the technical risk is resolved,” or “this business model has proven itself.” Yet the evidence may equally be consistent with a much narrower explanation:
- one founder had unusual distribution access;
- one company found an atypical regulatory opening;
- one team benefited from an unusually favourable platform shift;
- the outcome reflected timing, luck, or a singular partnership;
- the apparent winner was strengthened by exceptional financing conditions rather than intrinsic category economics.
The inference problem becomes sharper because people often observe success before they observe the denominator. A well-known breakout is salient: it is in board conversations, media coverage, LP letters, and founder pitches. The less visible set includes the startups that failed quietly, never raised institutional financing, or survived without enough traction to become comparables. In a category with ten visible companies, even identifying the true population of attempted companies can be difficult.
The chart below illustrates a related principle: an observed proportion is highly unstable when only a few observations have occurred. It is not a chart of VC returns, and a startup category is neither independent nor stationary in the way coin tosses are. Its value here is narrower: early evidence naturally fluctuates widely, so a handful of data points should not be mistaken for a settled rate.
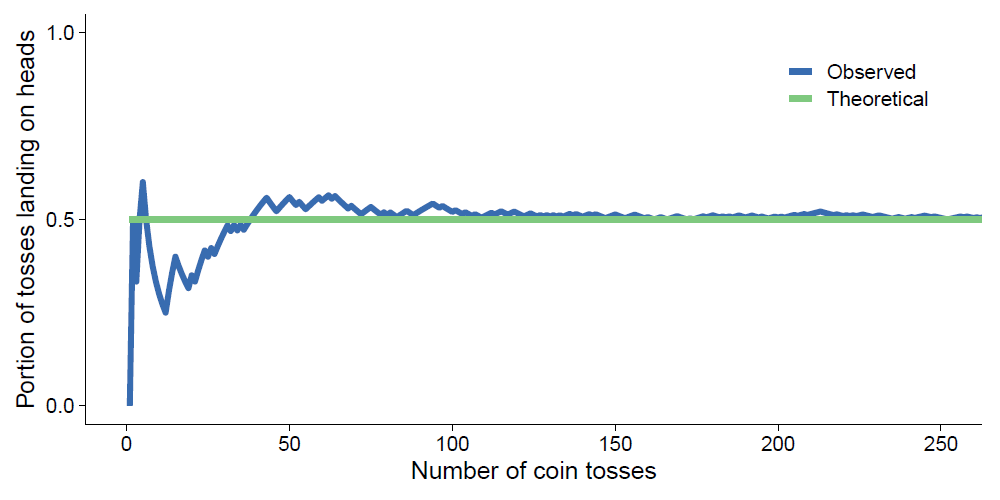
In venture, the simplifying assumptions behind this intuition often fail:
| Coin-toss intuition | Venture-category reality |
|---|---|
| Each observation is broadly comparable | Companies differ in founders, market access, geography, and timing |
| The probability is fixed | Capital conditions, regulation, technology, and demand evolve |
| Observations are independent | A prominent financing can change hiring, customer adoption, and follow-on funding for others |
| The full sequence is observable | Failed and unfunded attempts are often missing from the record |
Thus more observations help, but merely accumulating observations does not guarantee better inference. A late cohort may have formed under a radically different capital regime than the first cohort. Nor does repeated visibility of a winner prove that the original causal thesis was correct.
A useful discipline is to ask four questions whenever a category thesis is justified by a few successes:
- What is the denominator? How many serious attempts, funded or unfunded, were made?
- How concentrated are outcomes? Does one company account for most of the category’s value creation?
- What was idiosyncratic? Which characteristics belonged to the winner rather than to the category?
- What has changed since? Are current entrants competing under the same conditions, valuations, and financing availability?
These questions do not deny the significance of the outlier. They prevent the outlier from silently becoming a category-wide base rate.
3. Survivorship bias: seeing the winners, losing the denominator
Survivorship bias occurs when analysis focuses on the entities that remain visible or active while excluding entities that failed, exited, or otherwise left the sample. It is a form of selection bias: the observed group is selected partly because it survived.
In startup analysis, this often takes several forms at once:
- Company survival: failed companies disappear from databases, events, and founder narratives.
- Funding survival: only startups that raise subsequent rounds are visible in round-based datasets and valuation discussions.
- Fund survival: investors with poor outcomes stop raising funds or lose prominence, while successful firms remain highly visible.
- Narrative survival: a founder’s strategy is studied because it succeeded; similar strategies that failed are rarely written up.
- Category survival: a label may be retrospectively applied to successful companies but not to failed near-peers.
The European Investment Fund’s analysis makes the basic statistical point clearly: if riskier companies default or disappear at higher rates, later-year performance statistics describe an increasingly selected subgroup rather than the original cohort. The surviving companies will tend to look larger and healthier, inflating average and median estimates of performance.
[PDF] The European venture capital landscape: an EIF perspective
Read the selected passages from the European Investment Fund report to connect the abstract concepts of skewness and survivorship bias to startup-portfolio evidence. The report is particularly useful because it distinguishes average from typical outcomes and explicitly warns that later-period data concern only firms that remain observable.
Begin with the discussion of survivorship bias in the report’s treatment of cohort trends. Read the survivorship discussion, focusing on why later observations refer only to firms that have survived until that point. Then, in Section 4.1, read the skewness passage. Notice why the median is presented as more representative of a typical startup than the mean. Finally, in Section 6.1, use Table 1 and the paragraphs immediately below it to compare the four growth profiles. Read from the profile interpretation. Focus on how a portfolio can contain meaningful growth outliers alongside a substantial group of underperformers and a much larger group of moderate performers.
A particularly dangerous form of survivorship bias occurs when an investor says: “Look at the leading companies in this category; they all share feature .” The proper response is not necessarily that is irrelevant. It is that the comparison is incomplete. One must ask: How many failed companies also had ? If the same feature was widespread among failures, it may have little explanatory value.
This is close to the classic problem of examining armour damage on returning aircraft while ignoring aircraft that did not return. In venture, the “missing aircraft” include failed startups, abandoned products, down rounds that were never publicized, and founders who never reached the institutional funding dataset.
4. The reflexive consequence: winners create evidence that then creates more winners
The previous two sections concern inference from a dataset. In venture, however, the dataset is not passive. A visible early winner may alter the category’s future outcomes.
Once a company succeeds, it may attract capital, high-quality employees, distribution partners, customer attention, and follow-on investors. That can make the company’s success more durable. It may also cause investors to fund similar startups, founders to enter the field, and customers to treat the category as legitimate. The initial success is then both evidence of potential and a force that changes the potential itself.
This produces a subtle but crucial distinction:
- Descriptive claim: one company succeeded in this category.
- Causal claim: the category’s core economics reliably produce such companies.
- Reflexive claim: belief in the category has improved financing and adoption conditions, helping more companies succeed.
All three may be true, but they are not interchangeable.
Consider an illustrative “neolabs” cycle. A small number of laboratories may demonstrate compelling technical capabilities. A respected investor funds one of them at a high valuation. That financing becomes a public signal; it helps the company recruit scientists, secure partnerships, and endure a long commercialization cycle. If its progress is then read as proof that all companies in the label are similarly attractive, new startups receive capital on increasingly permissive terms. The category’s apparent quality rises partly because the best teams, capital, and attention have flowed into it.
The error begins when observers read the reinforced outcomes as wholly independent confirmation of the original thesis. The winner’s later strength may indeed reflect real technical merit. It may also reflect a financing-and-attention advantage unavailable to later entrants. When funding conditions tighten, that distinction becomes visible: startups that required abundant follow-on capital may suddenly look like evidence against the category, even if the underlying science has not materially changed.
This is why a contrarian investor should be wary of both narratives:
- “A few winners prove this category is inevitably huge.”
- “A few failures prove the category is permanently broken.”
In a heavy-tailed world, both can be overgeneralizations from sparse, selected, and reflexively shaped evidence.
5. A practical inference protocol for category claims
When hearing a category thesis grounded in celebrated precedents, separate the claim into three layers.
Layer 1: Outcome evidence
What actually happened?
- List successful companies, but also closures, acqui-hires, low-value exits, and stalled firms.
- Count attempts as well as visible financings.
- Examine medians, dispersion, and the share of value created by the top one or two companies.
- Separate realized outcomes from high private marks.
Layer 2: Causal explanation
Why did the successes occur?
- Identify candidate mechanisms: a technological discontinuity, regulatory change, supply constraint, buyer urgency, distribution advantage, or network effect.
- Test whether those mechanisms were present in failures too.
- Identify winner-specific advantages: founder reputation, a proprietary dataset, a unique partnership, geography, timing, or unusually patient capital.
Layer 3: Forward relevance
Why should the historical pattern persist for a new investment?
- Have entry valuations risen faster than underlying evidence?
- Are later entrants now competing for the same talent, customers, and infrastructure?
- Does the company require another period of abundant financing before it can prove the thesis?
- Has the original winner made the opportunity easier to see but harder to capture?
A concise formulation is:
This is not a rejection of pattern recognition. It is a demand that a pattern survive denominator checks, selection-bias checks, and causal scrutiny.
Key takeaways
VC returns are often heavily right-skewed: a small minority of companies can account for a disproportionate share of value. That makes early-stage investing capable of producing extraordinary outcomes, but it also makes category inference unusually fragile.
Small samples amplify this fragility. One exceptional company can make a new category look validated even when it is an outlier rather than representative evidence. Survivorship bias then compounds the error by removing failed, stalled, and unfunded attempts from the visible record.
For category analysis, treat prominent winners as evidence of possibility, not automatic evidence of prevalence or repeatability. Ask for the denominator, identify what was unique to the winner, and distinguish intrinsic category progress from outcomes strengthened by capital and attention.
Next, we will examine how a brand-name VC investment acts as a public signal — not merely changing other investors’ beliefs, but potentially changing the startup’s financing, hiring, customer adoption, and therefore its underlying performance.