
Hello. Last lesson separated the quality of a policy from the quality of individual Jev judgments: automatic accuracy, coverage, review rate, and failures all need distinct accounting. You also preserved a frozen held-out dataset and recorded Jev responses separately from gold labels.
Now we examine whether the confidence in those recorded responses is actually useful. Specifically: when Jev reports higher confidence, do those decisions prove more accurate on your held-out support-routing cases? This is an empirical question, not a property to assume from the API. Plan for roughly 40 minutes.
1. Confidence is a signal to validate, not an automation guarantee
For a Jev Choice or Score answer, confidence is a number from to , derived from the concentration of its answer probabilities. It is not identical to the probability of the selected option.
For example, a response might select technical with a selected-option probability of and report confidence of . The former concerns that particular winning option; the latter summarizes how concentrated the overall distribution is. Your application should record both, but this lesson evaluates the confidence field because it is the signal you used to gate automation.
A tempting but unsafe interpretation is:
“A confidence of means this case has a chance of being correct.”
That may become approximately true for your workflow and dataset, but it must be demonstrated with held-out evidence. In particular, a model can be internally decisive for the wrong reason: incomplete state, ambiguous taxonomy boundaries, unsupported language, or a brittle question design can all yield high-confidence mistakes.
Read Braintrust’s short operational warning before implementing the measurement.
Eval agent responses with Jev - Blog - Braintrust
In the “Review uncertain results” section, Braintrust explains both the practical value and the limits of Jev confidence in a production evaluation workflow.
Find the subsection titled “Review uncertain results.” Read from the explanation that Choice and Score answers include confidence through the end of the thresholding discussion. Focus on the operational caution: confidence can guide review and automation, but teams must compare it with observed accuracy on their own examples first.
For the support router, we will make two related assessments:
- Ranking value: Do higher-confidence groups have higher empirical accuracy than lower-confidence groups?
- Reliability alignment: Within a group of similar confidence values, is mean confidence reasonably close to the observed fraction correct?
The first tells you whether confidence is a useful ordering signal. The second tells you whether its numeric scale has a stable operational meaning.
2. Calibration means comparing stated certainty with observed outcomes
Suppose Jev produces 100 valid routing judgments with confidence near . If 80 of those selected intents match the gold label, confidence and empirical accuracy align well in that region. If only 55 are correct, the workflow is overconfident there. If 92 are correct, it is underconfident there.
More formally, let each valid held-out case have:
- confidence ,
- selected intent ,
- gold intent ,
- correctness indicator , where if , and otherwise.
Because individual confidence values are usually diverse, group cases into confidence bins . For each bin, calculate:
Here:
- is the mean reported confidence in the bin.
- is the empirical accuracy of the selected intents in that bin.
The signed calibration gap is:
Interpret it as follows:
| Bin result | Interpretation |
|---|---|
| Confidence and observed correctness align in this region. | |
| The workflow is overconfident in this region. | |
| The workflow is underconfident in this region. |
A calibration plot makes this comparison visible. The diagonal line represents perfect agreement between a predicted probability and the observed outcome rate.
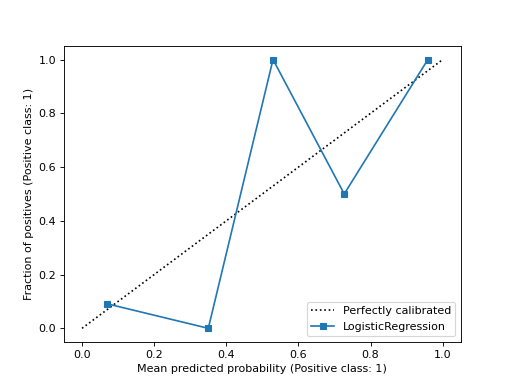
The important adaptation is the outcome on the vertical axis. In the displayed binary-classification example it is “fraction of positives.” For your router, it is:
Watch this concise overview for the mechanics of reliability curves and a summary error measure.
Model Calibration - Estimated Calibration Error (ECE) Explained
“Model Calibration - Estimated Calibration Error (ECE) Explained” from DataMListic introduces calibration visually, then shows how reliability curves and Expected Calibration Error summarize the comparison.
Watch the motivation for calibration, then the reliability curve to connect the diagonal line with empirical frequencies. Finish with ECE calculation, focusing on why it compares average confidence and observed accuracy inside bins.
3. Choose the right evaluation population before binning
Calibration is always conditional on a population. Mixing different populations without labeling them makes results difficult to interpret.
For the primary assessment, use every held-out case with a valid Jev Choice response, including cases where Jev selected other.
That gives the cleanest answer to:
Across all valid support-intent judgments, does higher Jev confidence correspond to more correct selected labels?
A valid other selection can be correct if the gold label is also other. It belongs in this measurement because it is a real judgment made under the same question contract.
Keep the following categories outside this primary calculation:
| Category | Why exclude from confidence calibration | What to report instead |
|---|---|---|
| Timeout, rate limit, unavailable service | There is no valid confidence value. | Failure rate, as in the previous lesson |
| Invalid response | The response cannot be trusted as a typed model judgment. | Invalid-response count and fallback rate |
| Development split | Using it for the final assessment would contaminate your held-out evidence. | Use only for exploratory diagnostics |
| Manually changed outcomes | A human correction is not Jev’s original judgment. | Review outcome, separately |
You can later report a secondary calibration table for the subset eligible for automation: supported intents excluding other. This can be helpful for operational analysis, but it is not a replacement for the primary result. If you filter only the cases your current threshold already accepts, you will hide most low-confidence behavior and make calibration look artificially favorable.
Also preserve the distinction between evaluation labels and model inputs:
- Jev receives the case
stateand question contract. - Your evaluator compares the recorded Jev response against
expected.intent. - Gold labels, review outcomes, and reviewer rationales must never enter the state sent to Jev.
4. Build equal-count confidence bins
A reliability table needs enough examples in each bin to be informative. Fixed-width bins such as –, –, and so on are easy to explain, but they can be misleading when most responses cluster above . You might end up with one huge high-confidence bin and nearly empty lower bins.
For an early Jev evaluation, use equal-count bins:
- Sort valid held-out responses by increasing confidence.
- Divide the ordered rows into a small number of similarly sized groups.
- Calculate mean confidence and empirical accuracy in each group.
- Compare the groups while keeping their sample counts visible.
With 100–200 valid held-out cases, start with 4 or 5 bins. With only 30 cases, use 3 bins at most. Ten bins with three examples each create a visually detailed but statistically weak chart.
Here is an illustrative result from 120 cases divided into four equal-count bins:
| Confidence range | Cases | Mean confidence | Correct | Empirical accuracy | Gap |
|---|---|---|---|---|---|
| 0.41–0.61 | 30 | 0.54 | 16 | 53.3% | -0.7 points |
| 0.62–0.75 | 30 | 0.69 | 21 | 70.0% | +1.0 points |
| 0.76–0.87 | 30 | 0.82 | 25 | 83.3% | +1.3 points |
| 0.88–0.98 | 30 | 0.93 | 27 | 90.0% | -3.0 points |
This is encouraging evidence:
- Accuracy generally rises with confidence: , , , then .
- The observed accuracies are reasonably close to the bin means.
- The highest-confidence cases are slightly overconfident in this finite sample, but not dramatically so.
Now contrast that with a concerning pattern:
| Confidence range | Cases | Mean confidence | Empirical accuracy |
|---|---|---|---|
| 0.45–0.66 | 30 | 0.59 | 73.3% |
| 0.67–0.78 | 30 | 0.73 | 70.0% |
| 0.79–0.89 | 30 | 0.84 | 66.7% |
| 0.90–0.99 | 30 | 0.95 | 63.3% |
The system reports greater certainty, but accuracy falls. A higher threshold would not be a reliable safety gate here. Investigate the question wording, taxonomy, state payload, and error slices before attempting to optimize a threshold.
5. Implement a deterministic calibration report in TypeScript
Use the recorded IntentEvalRun artifacts from the previous lesson. This function makes no API calls; it only interprets frozen held-out results. Put the shared IntentEvalRun type in an evaluation module so both your policy metrics and this report use the same representation.
type CalibrationRow = {
  id: string;
  confidence: number;
  choice: string;
  expectedIntent: string;
  correct: boolean;
};

type CalibrationBin = {
  count: number;
  confidenceMin: number;
  confidenceMax: number;
  meanConfidence: number;
  correctCount: number;
  empiricalAccuracy: number;
  signedGap: number;
};

type CalibrationReport = {
  validResponseCount: number;
  excludedFailureCount: number;
  binCount: number;
  expectedCalibrationError: number;
  bins: CalibrationBin[];
};

function mean(values: number[]): number {
  const total = values.reduce(function (sum, value) {
    return sum + value;
  }, 0);

  return total / values.length;
}

function calibrationRows(
  runs: IntentEvalRun[],
): { rows: CalibrationRow[]; excludedFailureCount: number } {
  const heldout = runs.filter(function (run) {
    return run.split === "heldout";
  });

  const rows: CalibrationRow[] = [];
  let excludedFailureCount = 0;

  for (const run of heldout) {
    if (run.actual === null) {
      excludedFailureCount += 1;
      continue;
    }

    const confidence = run.actual.confidence;

    if (!Number.isFinite(confidence) || confidence < 0 || confidence > 1) {
      throw new Error(
        `Invalid confidence for held-out case ${run.id}: ${confidence}`,
      );
    }

    rows.push({
      id: run.id,
      confidence,
      choice: run.actual.choice,
      expectedIntent: run.expected.intent,
      correct: run.actual.choice === run.expected.intent,
    });
  }

  return { rows, excludedFailureCount };
}

export function measureConfidenceCalibration(
  runs: IntentEvalRun[],
  requestedBinCount = 5,
): CalibrationReport {
  if (!Number.isInteger(requestedBinCount) || requestedBinCount < 1) {
    throw new Error("requestedBinCount must be a positive integer.");
  }

  const extracted = calibrationRows(runs);
  const rows = extracted.rows.sort(function (left, right) {
    return left.confidence - right.confidence;
  });

  if (rows.length === 0) {
    throw new Error("No valid held-out Choice responses to calibrate.");
  }

  const binCount = Math.min(requestedBinCount, rows.length);
  const bins: CalibrationBin[] = [];
  let expectedCalibrationError = 0;

  for (let binIndex = 0; binIndex < binCount; binIndex += 1) {
    const start = Math.floor((binIndex * rows.length) / binCount);
    const end = Math.floor(((binIndex + 1) * rows.length) / binCount);
    const members = rows.slice(start, end);

    const confidences = members.map(function (row) {
      return row.confidence;
    });

    const correctCount = members.filter(function (row) {
      return row.correct;
    }).length;

    const empiricalAccuracy = correctCount / members.length;
    const meanConfidence = mean(confidences);
    const signedGap = empiricalAccuracy - meanConfidence;

    bins.push({
      count: members.length,
      confidenceMin: confidences[0],
      confidenceMax: confidences[confidences.length - 1],
      meanConfidence,
      correctCount,
      empiricalAccuracy,
      signedGap,
    });

    expectedCalibrationError +=
      (members.length / rows.length) * Math.abs(signedGap);
  }

  const report = {
    validResponseCount: rows.length,
    excludedFailureCount: extracted.excludedFailureCount,
    binCount,
    expectedCalibrationError,
    bins,
  };

  console.table(
    bins.map(function (bin) {
      return {
        confidenceRange:
          `${bin.confidenceMin.toFixed(2)}-${bin.confidenceMax.toFixed(2)}`,
        cases: bin.count,
        meanConfidence: `${(bin.meanConfidence * 100).toFixed(1)}%`,
        correct: `${bin.correctCount}/${bin.count}`,
        empiricalAccuracy: `${(bin.empiricalAccuracy * 100).toFixed(1)}%`,
        signedGap: `${(bin.signedGap * 100).toFixed(1)} points`,
      };
    }),
  );

  console.table([
    {
      metric: "Valid held-out responses",
      value: report.validResponseCount,
    },
    {
      metric: "Excluded failures",
      value: report.excludedFailureCount,
    },
    {
      metric: "Equal-count bins",
      value: report.binCount,
    },
    {
      metric: "Expected calibration error",
      value: `${(report.expectedCalibrationError * 100).toFixed(1)} points`,
    },
  ]);

  return report;
}
The function reports an Expected Calibration Error:
ECE is the weighted average absolute gap between empirical accuracy and mean confidence. Lower is better.
Use ECE as a compact summary, not as the sole verdict:
- ECE loses the direction of the error. It cannot tell you whether the system is overconfident or underconfident.
- Different bin counts can produce somewhat different ECE values.
- A low ECE can conceal a concerning high-confidence region if that region contains relatively few cases.
- The table of bins is the primary diagnostic artifact; ECE is supporting context.
For each row in the printed table, verify three things:
- Sample count: Is the bin large enough to take seriously?
- Ordering: Does empirical accuracy tend to improve as confidence rises?
- Gap: Does accuracy fall noticeably below mean confidence in the region where you would automate?
6. Interpret a small dataset cautiously
Held-out evidence is noisy. A bin with 5 cases and 5 correct results has observed accuracy of , but it does not prove that this confidence range is perfectly reliable. Likewise, 3 incorrect results in a small high-confidence bin may be chance variation rather than a stable defect.
A rough way to see this is through the binomial standard error of an observed accuracy:
When is small, uncertainty is large. That is why calibration reports must include raw counts, not only percentages or attractive curves.
When you find apparent miscalibration, inspect the individual cases rather than immediately changing a threshold. High-confidence errors often identify a more fundamental defect:
| Error pattern | Likely investigation |
|---|---|
High-confidence cancel_order predictions for return questions | Clarify mutually exclusive intent definitions and add discriminating evidence to state. |
| High confidence only for a particular language or channel | Inspect language coverage, state normalization, and slice representation in the evaluation dataset. |
| Accurate low-confidence predictions | The taxonomy may be correct but overly fine-grained, or the question may contain unnecessary ambiguity. |
High-confidence other on common requests | The supported taxonomy may be missing a real demand category. |
| Confidence mostly clustered near | Confidence may provide little ranking resolution for threshold-based policy. |
Do not “fix” a weak calibration result by remapping to some lower number in the client. Such recalibration can be valid in some statistical systems, but it requires substantially more data, a stable deployment distribution, and careful separation of tuning data from final evaluation. First establish whether the underlying Jev question and state contract produce a useful confidence ordering at all.
7. Produce a reviewable calibration artifact
After running the report, save a versioned artifact alongside the recorded Jev responses. It should contain:
- evaluation dataset version and contract version;
- Jev model identifier from the recorded responses;
- number of held-out cases;
- valid-response count and excluded failure count;
- bin boundaries, counts, mean confidence, accuracy, and signed gap;
- ECE;
- IDs of incorrect cases in the highest-confidence bin;
- IDs of correct cases in the lowest-confidence bin.
The last two lists are unusually valuable:
- High-confidence errors are the cases most likely to create unsafe automation.
- Low-confidence correct cases show where your workflow may be leaving automation value on the table, although they are not by themselves a reason to lower a threshold.
For now, treat this report as descriptive evidence. Do not repeatedly adjust the confidence threshold until the held-out table looks favorable. The next lesson will choose thresholds based on the relative costs of false positives, false negatives, and human review—not merely on a single accuracy percentage.
Key takeaways
Confidence only becomes operationally meaningful after comparison with gold-labeled held-out outcomes.
- Evaluate confidence on valid held-out Jev responses; report service failures separately because they have no confidence value.
- Group cases by confidence and compare each bin’s mean confidence with its empirical accuracy.
- Higher-confidence bins should generally be more accurate if confidence is a useful ranking signal.
- Bins below the diagonal of a reliability plot are overconfident: observed accuracy is lower than reported confidence.
- Use ECE as a compact summary, but always inspect bin counts, signed gaps, and individual high-confidence errors.
- Small bins are noisy. Preserve numerators and denominators, not just percentages.
Next, you will turn these measurements into an action policy: selecting automation and review thresholds from the real cost of wrong automated routes versus human review.
Can't find a good explanation? Sign up and we'll make it for you
Sign up