
Hello. In the previous lesson, you learned to choose a mean or median based on both the distribution and the business decision. That same decision-first discipline matters here: a KPI is not useful merely because it is measurable. It must connect to the outcome the business is trying to improve.
This final lesson in Analytical Thinking and Business Metrics introduces the KPI tree: a structured map from a business objective at the top to the measurable drivers and operational actions beneath it. By the end, you should be able to construct a small, defensible KPI tree, distinguish exact metric relationships from business hypotheses, and use the tree to guide analysis rather than simply populate a dashboard.
From a headline number to an explanation
A dashboard might show revenue, conversion rate, active customers, support response time, and many other figures. Seeing them side by side is not the same as understanding how they relate.
A KPI tree (also called a metric tree or driver tree) makes those relationships explicit. It begins with one important outcome, then breaks that outcome into progressively more actionable inputs.
For example, a retailer’s top-level goal could be monthly revenue. Revenue itself is a useful headline, but it does not identify what should change. A first breakdown can make the metric operational:
Now the business has two direct places to investigate:
- Did the number of orders fall?
- Did average order value fall?
The orders branch can be decomposed further:
And average order value can be expressed as:
This does not mean every revenue problem is solved by changing conversion rate. It means the tree gives analysts a logical starting point for diagnosis. Rather than asking “Why is revenue down?” as one broad question, you can examine the components that must account for that movement.
Intro to Metrics tree - a powerful way to make metrics operational
Watch “Intro to Metrics tree - a powerful way to make metrics operational” by Timo Dechau. It gives a concise explanation of why a collection of dashboard metrics is less useful than a model of their relationships.
Watch the purpose for the practical reason to use a metric tree. Then watch isolated metrics to contrast a dashboard with a connected model. Finish with the MRR example; focus especially on the distinction between relationships that are true by formula and relationships that are influences to investigate.
The three useful layers of a KPI tree
A practical tree usually has three layers, although a simple tree may have only two.
-
Business objective or North Star metric
This is the outcome that represents success for the decision at hand: monthly revenue, gross profit, customer retention rate, on-time delivery rate, or active paying customers. -
Direct drivers or contributing metrics
These explain the immediate structure of the objective. For example, revenue depends directly on orders and average order value; gross profit depends on revenue and cost of goods sold. -
Operational metrics
These are the lower-level, monitorable measures that teams can act on or investigate: qualified leads, checkout conversion rate, stock availability, app response time, customer-support resolution time, and so forth.
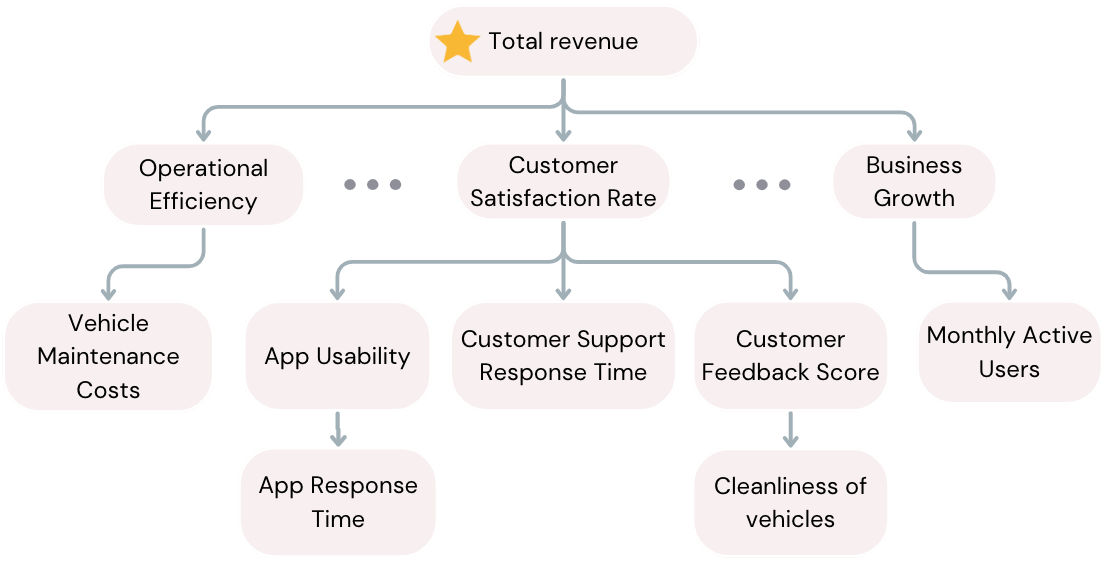
The supplied KPI Tree Framework image illustrates the overall idea: total revenue is connected to broad driver areas, which are then connected to increasingly specific measures. Notice that it includes both operational factors, such as vehicle maintenance costs, and customer-experience factors, such as app usability and response time. This is useful as a business driver map because it prompts investigation across functions.
However, a strong analyst labels the type of relationship used in each branch. Some branches are exact mathematical decompositions, while others are plausible influences. Treating both as equally certain is a common error.
KPI Tree Framework - Business Performance Metrics Structure
Read “KPI Tree Framework - Business Performance Metrics Structure” from CaseBasix for a clear business-oriented definition and a compact construction process.
In “What Is the KPI Tree Framework in Business Analysis,” read the opening explanation, including the definitions of strategic indicators, drivers, and operational metrics. Then go to “Building a KPI Tree Framework for Business Performance Analysis.” Read the construction steps. Focus on the question each layer answers: whether the business is succeeding, why the outcome changes, and which activities can be monitored.
Two relationships: components and influences
The most important technical distinction in KPI-tree design is between component relationships and influence relationships.
Component relationships are true by definition
A component relationship is a mathematical identity. If the metrics are consistently defined, the relationship must hold.
For a transaction-based e-commerce business:
It can also be expressed as:
where:
If revenue is 500,000 and the business received 10,000 orders, average order value is 50. The two components reconcile exactly:
Likewise, if the business defines conversion rate as orders divided by sessions:
These formula-based branches are especially valuable because they support reliable diagnosis. If the formula does not reconcile, the problem may be a data-definition mismatch, a time-period mismatch, or an incorrect calculation.
Influence relationships are hypotheses about the business
Other measures affect an outcome without being part of its mathematical definition. For example:
- Faster page load time may improve checkout conversion.
- Better product availability may increase completed orders.
- A shorter support response time may improve retention.
- A promotional discount may increase conversion but reduce average order value.
These are influence relationships. They may be supported by evidence, business experience, experiments, or historical analysis, but they are not universally true in the way that a formula is. Their direction and strength can differ by customer segment, country, season, or product.
A useful notation in your own KPI tree is:
| Relationship type | Example | What an analyst should do |
|---|---|---|
| Component | Revenue, orders, and average order value | Reconcile the formula and diagnose the component that changed. |
| Influence | Page load time and conversion rate | Test or investigate whether the relationship exists, for whom, and how strongly. |
| Possible trade-off | Discount rate and gross margin | Monitor both metrics; improvement in one may harm the other. |
Do not write “app usability causes revenue” simply because both moved in the same direction. At this stage, use careful language such as “may influence,” “is a hypothesised driver,” or “should be tested.” Later in the course, correlation, regression, and A/B testing will give you tools to evaluate such claims more rigorously.
Constructing a KPI tree: a disciplined method
Start with the decision, not a list of convenient fields in a dataset. The following method works for sales, finance, operations, and product questions.
1. Define one measurable top outcome
Write the metric with enough detail that someone else could calculate it consistently.
Weak objective:
Improve revenue.
Stronger KPI definition:
Increase monthly net revenue in India, excluding cancelled orders and indirect taxes.
A strong top metric specifies, where relevant:
- Measure: revenue, gross profit, retention rate, or another outcome
- Population or scope: which customers, products, regions, or business unit
- Time period: daily, weekly, monthly, or quarterly
- Inclusions and exclusions: returns, refunds, cancelled orders, taxes, free users, and so on
- Direction: whether higher or lower is preferable
The goal is not to make every KPI definition long. It is to prevent ambiguity. “Revenue” can otherwise mean gross sales, invoiced revenue, recognised revenue, or net revenue after returns.
2. Find the smallest set of direct components
Ask:
What quantities, by formula or definition, make up this outcome?
For monthly gross profit, the first breakdown is:
For net revenue, one useful breakdown is:
These nodes are direct components. Together, they explain the arithmetic of the top metric.
Avoid adding every metric the organisation tracks. A KPI tree should be selective: each node must either define the parent metric or help explain a driver that the business can realistically investigate.
3. Decompose until the metrics become actionable
Continue breaking down a branch while the next level gives a more useful explanation.
For an e-commerce revenue objective:
You might then examine:
- Orders: sessions, purchase conversion rate, repeat-purchase rate
- Average order value: units per order, average selling price, discount rate
- Refunds: delivered orders, return rate, average refunded value
At the leaves, add operational measures or hypotheses. For example, product stock-out rate may influence conversion; delivery delays may influence returns; recommendation-widget usage may influence units per order.
Stop when a node is both measurable and actionable enough for a team to investigate. A tree with twenty levels is usually not more insightful than one with three or four.
4. Define each node before trusting it
Every important metric should have a short definition. For example:
| Node | Definition | Grain and period |
|---|---|---|
| Net revenue | Paid order value less discounts, returns, and refunds | All completed orders, monthly |
| Orders | Count of distinct completed order IDs | One record per order, monthly |
| Purchase conversion rate | Distinct completed orders divided by eligible sessions | Sessions, monthly |
| Average order value | Net revenue divided by completed orders | Order-level aggregate, monthly |
| Return rate | Returned orders divided by delivered orders | Order-level aggregate, monthly |
This is where earlier lessons matter. Your formulas must respect observation grain. If an order can contain many order lines, counting rows in an order-items table does not necessarily count orders. If categories have different order volumes, use the appropriate weighted calculation instead of averaging category averages.
5. Validate the tree with both data and business knowledge
Validation has two parts:
- Mathematical validation: Component branches should reconcile with the parent metric for the same period, scope, and filters.
- Business validation: Stakeholders should agree that the lower-level metrics plausibly describe how the business operates.
Suppose the KPI tree says revenue equals orders times average order value, but the calculation does not match reported revenue. Before explaining performance, investigate whether one metric includes refunded orders, one uses gross revenue, or the dates differ. A visually attractive tree built on inconsistent definitions is not reliable analysis.
Worked example: a monthly net-revenue tree
Imagine an online retailer whose stakeholder asks:
Net revenue was below target in April. Where should we investigate?
The decision-focused outcome is:
Diagnose the components and likely operational drivers of April net revenue versus target.
A concise KPI tree could be structured like this:
The diagram uses solid links for the tree’s principal component structure and dashed links for hypotheses that should be tested. In reporting, make the formula explicit rather than relying only on the diagram:
Assume April’s results are:
| Metric | March | April | Change |
|---|---|---|---|
| Eligible sessions | 200,000 | 220,000 | |
| Purchase conversion rate | percentage points | ||
| Completed orders | 6,000 | 5,500 | |
| Average order value | 80 | 82 | |
| Refunds | 12,000 | 18,000 | |
| Net revenue | 468,000 | 433,000 |
The tree guides the narrative:
- Traffic increased, so lack of sessions is not the immediate explanation.
- Conversion fell from to , producing fewer completed orders despite higher traffic.
- Average order value improved slightly, but not enough to offset the decline in orders.
- Refunds also increased and further reduced net revenue.
- The next analysis should investigate the conversion and refunds branches: stock availability, checkout failures, product mix, delivery performance, and return reasons.
That is much stronger than reporting, “April revenue decreased by .” The KPI tree turns a headline result into focused analytical questions and possible business actions.
Make the KPI tree usable, not decorative
A KPI tree becomes useful when it is part of a recurring decision process.
For each meaningful node, record:
- Owner: the team accountable for monitoring or improving it.
- Source: transaction system, web analytics, finance system, support platform, or another source.
- Refresh cadence: daily, weekly, or monthly.
- Target or benchmark: plan, prior period, service-level target, or peer group.
- Segment cuts: product, channel, customer type, region, or cohort.
- Relationship type: component, influence, or trade-off.
- Confidence: especially for influence relationships that have not yet been tested.
For example, “purchase conversion rate” may be healthy overall but poor on mobile devices. The metric definition remains the same, while the dimension used to slice it changes. This lets you locate where a problem is concentrated without inventing a new KPI every time.
A KPI tree should also include guardrail metrics when improvement can create harm elsewhere. A marketing team might try to raise conversion through deeper discounts. Conversion could increase while net revenue or gross margin deteriorates. In that case, discount rate and gross margin should sit alongside the relevant branch as monitored trade-offs.
Common mistakes to avoid
Treating a KPI tree as a list of metrics
If a node does not have a clear relationship to its parent, it may belong on a dashboard but not in that branch of the tree. The tree’s value is its logic, not the number of boxes.
Mixing time periods, populations, or definitions
Monthly revenue cannot reliably be decomposed using weekly active users unless the relationship and time aggregation are carefully defined. Likewise, gross revenue and net revenue should never be used interchangeably.
Confusing correlation with a proven driver
A customer satisfaction score and retention may move together, but that does not itself prove satisfaction caused retention. Label this as an influence hypothesis, then investigate with segmented analysis or later experimental methods.
Going too deep too soon
Begin with a small tree that covers the most important drivers. Add detail when it supports a real decision. A tree that nobody can explain in a business review will not be used.
Ignoring trade-offs
“Improve one metric” is rarely a complete business objective. Faster customer support may increase operating cost; lower delivery times may require more expensive shipping. Connect the outcome to the costs and quality measures that protect the business from one-sided optimisation.
Key takeaways
A KPI tree connects a clearly defined business objective to the measurable drivers that explain and influence it. It replaces a collection of isolated dashboard metrics with a structured model for diagnosing performance and selecting actions.
When constructing one:
- Define one top outcome with a clear scope and time period.
- Break it into a small number of direct, measurable components.
- Decompose those components until the leaves are actionable operational metrics.
- Separate exact component relationships from evidence-based influence hypotheses.
- Define every metric consistently, respecting its grain, numerator, denominator, and filters.
- Validate formula branches against the data, then refine hypotheses as evidence develops.
You have now completed the course’s first module. The next module moves from asking the right business questions to preparing trustworthy data: beginning with how to create a data dictionary containing field definitions and validation rules.
Can't find a good explanation? Sign up and we'll make it for you
Sign up