
Good to see you again. In the previous lessons, you identified an ELF’s protection profile, observed which mappings ASLR randomizes, and translated mitigations into concrete exploit requirements. That tells you what a route would need. This lesson focuses on the step that must come first: proving where attacker-controlled bytes enter the program, how they travel, and exactly which memory object they corrupt.
You already know the individual Ghidra and GEF features. The goal now is to use them as one evidence loop: form a static hypothesis in Ghidra, test it in GDB, and record only what runtime behavior confirms. By the end, you should be able to distinguish “this function looks suspicious” from “my bytes reach this destination through this call, and this write crosses this specific boundary.”
The trace you are trying to prove
A memory-corruption finding is not simply the presence of gets, strcpy, or a large read count. It is a chain of evidence:
- Input entry point: where data from the user, file, network, environment, or command line enters.
- Propagation: which variables, buffers, pointers, or helper functions carry that data onward.
- Dangerous operation: the copy, parse, formatting operation, or index calculation that lacks an adequate bound.
- Corrupted destination: the adjacent local variable, saved frame state, heap object, or other memory region actually modified.
- Observable consequence: an altered branch, a failed canary check, a crash, or eventual control-flow impact.
A useful trace statement is therefore specific:
mainreads a menu choice from standard input, dispatches toedit_note, andedit_notecallsread(0, stack_buffer, 0x100)even thoughstack_bufferoccupies only 0x40 bytes. A marked input reaches the buffer, and a watchpoint confirms that the write later changes the saved frame state.
That statement is much more useful than “there is a buffer overflow in edit_note.” It contains enough detail to plan the next debugger experiment and, eventually, assess the resulting primitive.
A subtle but important point: the input function is not always the corruption site. A program might safely read 512 bytes into a heap buffer, transform them, then later copy them unsafely into a 64-byte stack buffer. Following only the first input function would miss the bug.
Start with static analysis: find a plausible data path
In an unfamiliar ELF, begin from behavior you can observe rather than immediately scrolling through every function.
Locate external input and its callers
Run the binary normally first. Record prompts, expected arguments, menu choices, and whether it reads one line or several. Then, in Ghidra, use a combination of:
- Strings and cross-references to prompts such as
"Name:","Choice:", or"Enter data:". - Imported functions, especially
read,recv,fgets,scanf,gets,strcpy,strncpy,memcpy,strcat, andsprintf. - Callers of those imports and the functions they invoke afterward.
- The
mainfunction, or its likely equivalent in a stripped binary, to understand top-level dispatch.
Do not treat a risky function name as a proof. read itself is safe or unsafe depending on the relationship between its count argument and destination capacity. strncpy can still lead to problems if a later consumer expects a null-terminated string. Conversely, a memcpy may be safe if its computed length has been validated.
This short segment from CryptoCat’s Buffer Overflow with Shellcode Injection – Easy Register shows the intended static-analysis rhythm: open the program in Ghidra, identify the user-input path, rename the destination meaningfully, and compare its apparent allocation with the input routine’s behavior.
Buffer Overflow with Shellcode Injection - Easy Register - [Intigriti 1337UP LIVE CTF 2022]
Watch CryptoCat’s Ghidra and GDB walkthrough to see a compact example of moving from a visible prompt to an unsafe input call, then validating the stack impact at runtime.
Watch the Ghidra trace first. Focus on how the decompiler reveals an 80-byte local buffer and why gets makes its apparent size security-relevant. Then watch the runtime check, noting that the breakpoint is placed at the function’s return and the cyclic pattern confirms, rather than merely assumes, the offset.
The video’s binary is intentionally simple. CTF binaries often split the same logic across helper functions, but the method remains the same.
Read calls through the ABI, not only through decompilation
The Ghidra decompiler is a hypothesis generator. Verify important calls in the Listing view and with the System V AMD64 calling convention.
For common functions:
| Call | Registers that matter before the call | The question to answer |
|---|---|---|
gets(destination) | RDI holds destination | Where does RDI point, and how large is that object? |
strcpy(destination, source) | RDI destination, RSI source | Is RSI derived from input, and is destination bounded? |
read(fd, buffer, count) | RDI file descriptor, RSI buffer, RDX count | Does count exceed the available capacity at RSI? |
recv(socket, buffer, length, flags) | RDI socket, RSI buffer, RDX length | Is the supplied length safely constrained? |
fgets(buffer, size, stream) | RDI buffer, RSI size, RDX stream | Is the declared size consistent with the actual object? |
scanf(format, destination, ...) | RDI format, RSI first destination | Does the format, such as %s, impose a safe width? |
Consider this common assembly pattern:
lea    rax, [rbp-0x50]
mov    edx, 0x100
mov    rsi, rax
xor    edi, edi
call   read@plt
The ABI tells you that this is likely:
read(0, buffer_at_rbp_minus_0x50, 0x100);
The lea identifies the destination; RDX supplies a maximum input of 256 bytes. You still need to establish the true capacity of the object beginning at [rbp-0x50]. If the stack layout and Ghidra both support a 64-byte buffer there, the copy is suspicious because the possible input is larger than its capacity. If the object is actually a 256-byte array, it is not an overflow on that basis.
Build a small “data-flow ledger”
As you work through a function, write down a compact ledger rather than relying on memory:
Entry: stdin menu option
Function: edit_note
Input routine: read(0, local_58, 0x100)
Destination: stack address rbp-0x50
Static capacity evidence: local array appears to occupy 0x40 bytes
Input transformation: none observed
First affected object above buffer: saved canary at rbp-0x8
Hypothesis: input longer than 0x48 reaches the canary
Runtime status: not yet tested
The phrase “static capacity evidence” is deliberate. Ghidra’s names like local_58 describe an offset, not an authoritative C declaration. Compiler padding, optimized frames, reused stack slots, and imperfect type recovery can make the decompiler’s array size misleading. Inspect the instructions that form the buffer address and the surrounding stack accesses.
Turn the static hypothesis into a debugger experiment
Static analysis says where the program appears to send input. Dynamic analysis answers what happens in the actual process.
Set two breakpoints in the suspected vulnerable function:
- One immediately before the input or copy call, when its argument registers are still intact.
- One immediately after that call returns, so you can inspect the destination contents.
For an unstripped local binary, first inspect the routine:
gef➤ disassemble /r edit_note
Identify the call instruction to the input function and the first instruction after it. Then set breakpoints at those exact addresses:
gef➤  break *edit_note+OFFSET_BEFORE_CALL
gef➤  break *edit_note+OFFSET_AFTER_CALL
Using offsets relative to a symbol is convenient when symbols exist, even if PIE is enabled. GDB resolves the symbol within the current process. For a stripped PIE binary, use the runtime base shown by GEF’s mappings or other relocation-aware breakpoint techniques, but preserve the same principle: break before the relevant call, not somewhere vaguely nearby.
At the first breakpoint, inspect both the instruction and the arguments:
gef➤  x/i $pc
gef➤  info registers rdi rsi rdx rbp rsp rip
For read, confirm that:
RDIis the expected descriptor, commonly0for standard input;RSIpoints into the expected stack or heap mapping;RDXis the maximum requested byte count.
For gets, inspect RDI. For strcpy, inspect both RDI and RSI.
Save the destination in a GDB convenience variable before continuing:
gef➤  set $dst = $rsi
gef➤  x/32bx $dst
Use $rdi instead if the function’s destination is its first argument. The initial memory need not be readable text; at this stage you are confirming an address and its region, not expecting meaningful contents.
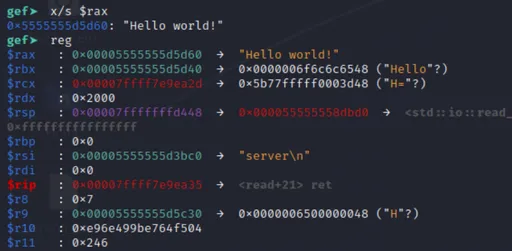
After the input call returns, inspect the same address again:
gef➤  x/64bx $dst
gef➤  x/64cb $dst
A deliberately distinctive marker such as TRACE_AAAA_BBBB_CCCC makes it easier to recognize your bytes and detect any transformation. Remember that input functions do not all preserve input identically:
readandrecvpreserve raw bytes, including null bytes.getsdiscards the newline and writes a terminating null byte.fgetsusually retains the newline if there is room, then appends a null byte.scanf("%s", ...)stops at whitespace and appends a null byte.
This distinction often explains why an offset or payload behaves differently than expected.
Watchpoints: catch the instruction that changes the target
Breakpoints answer, “Did execution reach this function?” Watchpoints answer the more precise question, “Which instruction changed this memory?”
Read the relevant part of the official GDB documentation now. It is short, but it clarifies the distinction between watching a variable expression and watching memory at a chosen address.
Set Watchpoints (Debugging with GDB) - Sourceware
Read GDB’s official “Set Watchpoints” documentation from Sourceware to learn how data breakpoints stop on a memory change and why an address must be dereferenced before it can be watched.
In Section 5.1.2, “Setting Watchpoints,” begin with the opening explanation. Focus on why this is useful when the responsible instruction is not yet known. Later in the same section, read the address example, including the watch *(int *) 0x600850 command and the discussion immediately after it about hardware watchpoints.
Watch the destination buffer
At the pre-call breakpoint, after setting $dst, place a watchpoint on the first eight bytes of the destination:
gef➤  watch -location *(unsigned long *)$dst
gef➤  continue
When the program writes input there, GDB should stop and show both the old and new values. Then inspect the responsible context:
gef➤  x/i $pc
gef➤  bt
gef➤  info registers
For library-based operations, the stop may occur inside libc, perhaps in an optimized copy routine rather than in a readable function such as strcpy. That is still useful evidence: the backtrace should show the application call site that led into the copy.
On most x86-64 systems, GDB can use a hardware watchpoint. It stops very close to the instruction responsible for the write and adds little runtime overhead. Hardware watchpoints are limited in both number and size, though, so watching an entire large buffer at once is not realistic. Watch strategically chosen words: the beginning of a buffer, a sensitive adjacent field, a canary location in an authorized training binary, or the saved control data boundary.
Watch the object you believe will be corrupted
Suppose static analysis suggests an overflow reaches an integer at [rbp-0xc]. Break after the function prologue and set its address:
gef➤  set $flag = $rbp - 0xc
gef➤  x/wx $flag
gef➤  watch -location *(unsigned int *)$flag
gef➤  continue
Now the debugger stops at the first instruction that changes that particular object. This is stronger than observing an altered value later at a comparison: it identifies the write itself.
For a frame-pointer-based function, the saved return address is conventionally at [rbp+8]. In an authorized CTF binary, you can monitor that location similarly:
gef➤  set $saved_rip = $rbp + 8
gef➤  watch -location *(unsigned long *)$saved_rip
gef➤  continue
Do not assume this layout blindly. Optimized code may omit RBP as a frame pointer, and a stack canary may lie between the buffer and saved frame state. Derive the relevant address from the current function’s actual instructions.
A watchpoint only triggers when the watched value changes. Use a marker payload that differs from the initial data, and recreate stack-derived convenience variables on every fresh run because ASLR changes the frame address.
Use a cyclic pattern as corroboration, not your first claim
You have already used cyclic patterns in GEF. Here, use them after you have established that the suspected route is genuine.
A disciplined order is:
- Run with a short marker and prove it appears at the expected destination.
- Run with a length that tests the suspected boundary.
- Set a watchpoint on the adjacent object or control-data boundary.
- Only then use a cyclic pattern to calculate the exact overwrite position.
For a conventional frame-pointer stack function, a rough initial model is:
local buffer
possible padding and other locals
possible canary
saved RBP
saved return address
The compiler, not the source declaration order, chooses the actual layout. Thus, “buffer size plus eight” is only valid for a particular observed frame, not a universal rule.
When stopping just before a ret, the next return address is the eight-byte word at $rsp:
gef➤ x/gx $rsp
If that word contains cyclic bytes, use GEF or pwntools to locate the corresponding offset. This is preferable to relying solely on a post-crash RIP value: on x86-64, an invalid non-canonical return target can fault before the CPU visibly loads the pattern into RIP.
Also keep mitigation behavior in the interpretation:
- If a canary check aborts before
ret, you have demonstrated that the input crossed the canary, not instruction-pointer control. - If a watchpoint shows a local flag changes but no frame metadata changes, you have a data-only modification primitive.
- If a cyclic sequence appears at the return slot and execution attempts to return through it, that is evidence of return-address control—subject to canary and address constraints discussed last lesson.
This distinction prepares you for the next lesson, where you will classify crashes by the primitive they actually provide.
A repeatable 20-minute trace routine
Use this workflow on one authorized local pwn challenge or a small binary you compiled yourself.
1. Form one narrow static hypothesis
In Ghidra:
- Find the prompt or imported input routine.
- Follow its caller into the handling function.
- Rename the input destination to something meaningful, such as
name_buf,note, orpacket. - Record the function, destination stack or heap location, apparent capacity, input count, and the first adjacent target of interest.
Avoid trying to understand the whole binary. Your first objective is one path from input to one suspected write.
2. Validate arguments before the copy
In GDB/GEF:
- Break immediately before the input or copy call.
- Inspect the appropriate ABI registers.
- Save the destination pointer in
$dst. - Check its mapping with
vmmap $dstif needed. - Inspect the bytes at
$dstbefore input is written.
This eliminates common static-analysis mistakes, such as mistaking the source pointer for the destination or misreading a reused stack slot.
3. Confirm your bytes after the copy
Continue to the post-call breakpoint. Inspect $dst and verify the marker is present. If it is transformed, truncated, or located somewhere else, update the hypothesis before trying longer input.
4. Instrument the boundary
Set a watchpoint on the intended target: an adjacent integer, pointer, canary boundary, saved frame pointer, or return-address slot. Use a controlled input length that is expected to approach that boundary.
When it triggers, capture:
Function and instruction:
Backtrace:
Watched address:
Old and new value:
Input length:
Effect after continuing:
This is enough evidence to reconstruct the path later without repeating the whole session.
Key takeaways
A reliable input-to-corruption trace combines static and dynamic evidence:
- In Ghidra, start from observable prompts, imports, cross-references, and callers; then identify the destination and its apparent capacity.
- Read critical calls through the AMD64 ABI, verifying which registers hold destination pointers, sources, and lengths.
- In GDB/GEF, break immediately before and after the suspected operation to prove that your marker reaches the predicted address.
- Use watchpoints to identify the instruction that changes a particular memory object, rather than only observing the consequence later.
- Treat a cyclic-pattern result as confirmation of a measured boundary, not as a substitute for understanding the input path.
- State the finding precisely: input source, propagation route, unsafe operation, corrupted target, and observed consequence.
Next, you will use this evidence to classify crashes and outcomes: whether you have return-address control, only limited data corruption, a useful write primitive, or merely a failed protection check.
Can't find a good explanation? Sign up and we'll make it for you
Sign up