
Good to see you again. In the last lesson, you used your solved IEEE 9-bus base case as the starting point for a manual N-1 line outage. That result is only as trustworthy as the intact case beneath it. This lesson closes the 9-bus module by performing a more formal external validation: comparing your PSS®E base case with a published WSCC/IEEE 9-bus reference and documenting whether any differences are material.
This is the same discipline required when you receive an SPP cluster model, a transmission-owner planning case, or an OEM test system: do not merely accept that it converges. Establish which reference you used, prove that the modeled inputs are comparable, compare the solved electrical state, and leave an auditable explanation for every meaningful discrepancy.
Validation is not simply “my case converges”
A converged AC load flow solves the equations for the network you entered. Validation asks a different question:
Does the solved network represent the intended published system closely enough for the stated study purpose?
Two cases can both converge cleanly while differing in a transformer base, tap, line-charging entry, generator voltage schedule, load sign, reactive limit, or branch status. Those differences can change voltages, losses, reactive production, and contingency behavior.
For this exercise, use the public 9-bus PSS®E package hosted by Alroomi as the primary reference artifact. Treat the associated single-line values as visual checks, but treat the actual reference files and their documented contents as more authoritative than numbers visible in a diagram.
Alroomi Website - 9-Bus System
Read “9-Bus System” from Alroomi Website. It identifies the equipment composition of the WSCC 9-bus case and provides a downloadable Siemens PSS/E version 33 package that you can use as an independent benchmark.
At the beginning of the page, read the short case description immediately before “II. Single-Line Diagram.” It states the modeled equipment count. Then go to “III. Files” and locate the “Siemens PSS/E (v. 33)” download. Download and extract it into a separate REFERENCE_READONLY folder; do not overwrite files in your own PSS/E workspace. Record the archive name, download date, extracted filenames, and any version-conversion messages when you open the case.
The published single-line diagram provides a quick visual check of the expected operating condition.
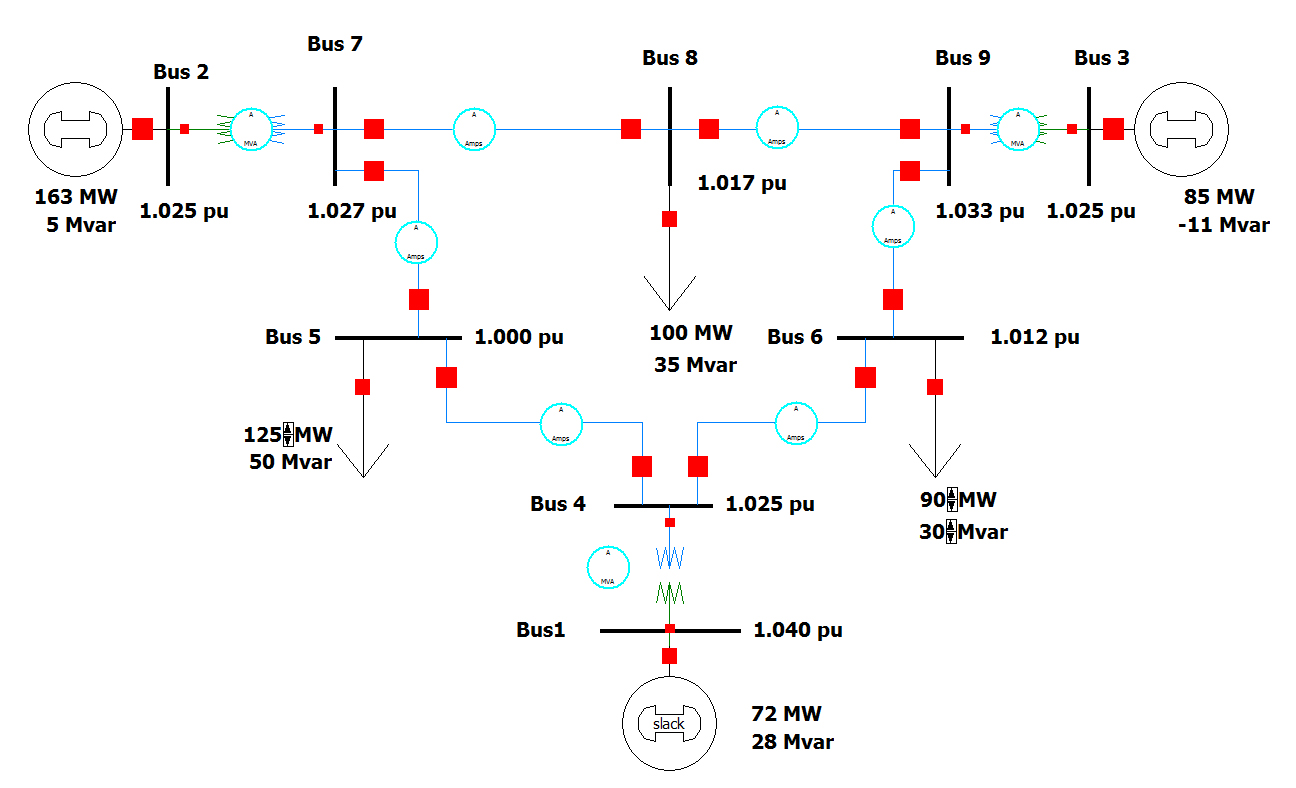
From the diagram, the following displayed values are useful checkpoints:
| Quantity | Published displayed value |
|---|---|
| Bus 1 voltage | 1.040 p.u. |
| Bus 2 voltage | 1.025 p.u. |
| Bus 3 voltage | 1.025 p.u. |
| Bus 4 voltage | 1.025 p.u. |
| Bus 5 voltage | 1.000 p.u. |
| Bus 6 voltage | 1.012 p.u. |
| Bus 7 voltage | 1.027 p.u. |
| Bus 8 voltage | 1.017 p.u. |
| Bus 9 voltage | 1.033 p.u. |
| Generator at Bus 1 | about 72 MW, 28 Mvar |
| Generator at Bus 2 | about 163 MW, 5 Mvar |
| Generator at Bus 3 | about 85 MW, -11 Mvar |
| Loads at Buses 5, 6, and 8 | 125/50, 90/30, and 100/35 MW/Mvar |
Because the diagram rounds values for display and may reflect a particular software implementation, do not expect it alone to prove an exact numerical match. The independent PSS®E case is the stronger comparison.
First prove that the two cases mean the same thing
Before comparing solved results, compare the model definition. This is more important than the final voltage table. If two input models differ, their output differences are expected rather than diagnostic.
Open your intact solved case, not the N-1 case:
IEEE9_SOLVED_BASE_R01.sav
Then create a working copy of the downloaded reference case. Preserve both originals. If your installed PSS®E version converts the older reference case, save the converted version with a clear name such as:
REF_IEEE9_ALROOMI_CONVERTED_R01.sav
Do not silently overwrite the original file. A later reviewer needs to distinguish the downloaded artifact from a version-converted copy.
Create a reference manifest before changing or solving anything:
Validation study: IEEE 9-bus external reference comparison
Internal case: IEEE9_SOLVED_BASE_R01.sav
Reference source: Alroomi 9-Bus System PSS/E package
Reference archive/file name: [record]
Download date: [record]
PSS/E release used: [record]
System base MVA: [record]
Reference case conversion performed: [yes/no; describe]
Solution method and tolerance: [record]
Comparison date and analyst: [record]
Now compare the two cases in the following order.
1. Network identity and topology
Confirm that both cases contain:
- nine buses;
- three generators;
- three two-winding generator step-up transformers;
- six transmission lines;
- three loads;
- no unintended out-of-service element;
- no extra switched shunt, fixed shunt, series device, or load representation that you did not intend to add.
For the conventional 9-bus arrangement, the generator buses are connected through transformers to the 230 kV transmission network. The transmission mesh includes the six line paths among Buses 4 through 9. A topology mismatch is material by definition: do not attempt to compensate for it by adjusting output tolerances.
2. Bus and control definition
Check, bus by bus:
- bus number and nominal kV;
- swing, PV, and PQ bus classification;
- voltage schedules at the swing and PV buses;
- load MW and Mvar;
- generator MW dispatch;
- generator reactive-power limits;
- transformer tap positions and control status;
- line resistance, reactance, charging, and in-service status.
The comparison must include control assumptions, not only equipment values. For example, a generator held at 1.025 p.u. is not equivalent to a generator producing the same initial MW but allowed to regulate a different bus or operating against different reactive limits.
A practical input comparison table is:
| Item | Your case | Reference case | Match? | If different, likely importance |
|---|---|---|---|---|
| System MVA base | [record] | [record] | [yes/no] | High |
| Swing bus and angle reference | [record] | [record] | [yes/no] | High |
| Bus 2 MW and voltage schedule | [record] | [record] | [yes/no] | High |
| Bus 3 MW and voltage schedule | [record] | [record] | [yes/no] | High |
| Loads at Buses 5, 6, 8 | [record] | [record] | [yes/no] | High |
| Transformer impedances and taps | [record] | [record] | [yes/no] | High |
| Six line impedances and charging | [record] | [record] | [yes/no] | High |
| Generator reactive limits | [record] | [record] | [yes/no] | Medium to high |
| Ratings, areas, zones, owners | [record] | [record] | [yes/no] | Depends on use |
Items such as areas, zones, and owners will not normally change an ordinary load-flow solution, but they matter for later contingency and reporting workflows. Keep them in the manifest even if they are not validation-critical today.
Solve both cases under controlled conditions
Use the same full Newton-Raphson solution method, mismatch tolerance, and control settings for both cases. The reference case should first be solved without altering its model data. Your objective is to observe what it does as supplied.
For each case, record:
- convergence status;
- total MW load and Mvar load;
- total MW generation and Mvar generation;
- total MW losses;
- swing-generator MW and Mvar output;
- PV buses that converted to PQ because of reactive limits;
- transformer tap or shunt movements, if automatic control was enabled;
- largest final mismatch.
If the reference case does not converge under your PSS®E release, first investigate case conversion, missing model data, and solution settings. Do not modify its network parameters merely to obtain convergence. Instead, document the behavior and establish whether the provided solved state is compatible with your installed release.
For a solved case, active-power balance should be internally coherent:
The slack machine makes up the residual balance. Therefore, a difference in slack MW can indicate a difference in total real-power losses, a dispatch difference, or both. It is an important clue, not automatically an error.
Compare outputs with consistent conventions
Once input comparability is established and both cases solve, export bus and branch reports from each case into a spreadsheet or comparison workbook. Do not compare screen captures manually if you can avoid it; a structured table becomes reusable later for utility-case reproduction.
For a bus voltage magnitude, calculate:
For voltage angle, first ensure both cases use the same angular reference. If needed, normalize every angle to its swing-bus angle:
Then calculate:
This normalization matters because an absolute shift in all bus angles does not change physical power flows. A mismatch in angle differences, however, can indicate a dispatch, impedance, transformer, or topology discrepancy.
Use a bus comparison table like this:
| Bus | p.u. | p.u. | p.u. | deg | deg | deg | Status |
|---|---|---|---|---|---|---|---|
| 1 | [record] | [record] | [calculate] | 0.0 | 0.0 | 0.0 | [record] |
| 2 | [record] | [record] | [calculate] | [record] | [record] | [calculate] | [record] |
| 3 | [record] | [record] | [calculate] | [record] | [record] | [calculate] | [record] |
| 4–9 | [record] | [record] | [calculate] | [record] | [record] | [calculate] | [record] |
For generators, compare scheduled and solved quantities separately:
| Generator bus | Scheduled MW match? | Voltage schedule match? | Your solved Mvar | Reference solved Mvar | Difference | Reactive-limit status |
|---|---|---|---|---|---|---|
| 1 | [record] | [record] | [record] | [record] | [calculate] | [record] |
| 2 | [record] | [record] | [record] | [record] | [calculate] | [record] |
| 3 | [record] | [record] | [record] | [record] | [calculate] | [record] |
For branches, align the orientation before comparing signed MW and Mvar. A reference report may label a line as 5–7 while your export may show the flow from 7–5. In that situation, the signed flows should be opposite; the apparent-power magnitudes and losses should agree.
Compare branch loss using the sum of terminal real-power flows after applying the same orientation convention:
A good branch comparison table includes both terminals when reactive-power behavior is relevant, especially for lines with charging and transformers with magnetizing assumptions.
| Element | Your MW flow | Reference MW flow | Your Mvar flow | Reference Mvar flow | Your MW loss | Reference MW loss | Assessment |
|---|---|---|---|---|---|---|---|
| Transformer 1–4 | [record] | [record] | [record] | [record] | [record] | [record] | [record] |
| Line 4–5 | [record] | [record] | [record] | [record] | [record] | [record] | [record] |
| Line 4–6 | [record] | [record] | [record] | [record] | [record] | [record] | [record] |
| Remaining elements | [record] | [record] | [record] | [record] | [record] | [record] | [record] |
Decide what counts as material before looking for explanations
For a public teaching reference with displayed values rounded to three decimal places and whole MW/Mvar, use pre-declared screening flags, not arbitrary after-the-fact tolerances:
| Comparison | Suggested flag for this exercise | Interpretation |
|---|---|---|
| Bus-voltage difference | $\left | \Delta V\right |
| Normalized angle difference | $\left | \Delta \delta\right |
| Generator or branch real-power difference | $\left | \Delta P\right |
| Generator or branch reactive-power difference | $\left | \Delta Q\right |
| Total real-loss difference | $\left | \Delta P_{\mathrm{loss}}\right |
| Topology, bus type, base kV, schedule, or status mismatch | Any difference | Material input discrepancy |
These are practical teaching thresholds, not ERCOT, SPP, WECC, NERC, or transmission-owner acceptance criteria. If the reference PSS®E file is confirmed to have identical inputs and can be solved in the same release, tighten the numerical threshold substantially. Near-identical machine-readable cases should agree to normal numerical precision.
A difference smaller than a screening threshold is not automatically irrelevant. Conversely, a difference larger than a threshold is not automatically a modeling error. It is a prompt to identify the cause.
Use a published numerical table carefully
The following article contains an alternative published IEEE 9-bus numerical solution. It is useful as an example of why validation must begin with case identity rather than an assumption that every item called “IEEE 9-bus” represents the same benchmark.
Read the Newton-Raphson bus-result and line-flow tables in the IIETA article as a secondary cross-check and as an audit exercise. The article reports a distinct published numerical solution, including voltage magnitudes, angles, generation, branch flows, and losses.
In the results section, locate “Table 5. Simulation result for IEEE 9 bus system using Newton Raphson load flow solution.” Read the full bus-result table, beginning with the Newton-Raphson bus results. Then locate “Table 7. Line flow and losses of IEEE 9-bus system obtained from Newton Raphson” and read the line-flow results. Compare its reported Bus 1 voltage, Bus 5 voltage, generator reactive powers, and total losses with the case you solved. Also note the stated maximum mismatch in Table 9 before deciding whether this article is suitable as a tight numerical acceptance reference.
Do not merge parameters from this article with the Alroomi PSS®E package. For example, the IIETA Newton-Raphson table displays a Bus 1 voltage of 1.030 p.u., whereas the published single-line reference shown earlier displays 1.040 p.u. Its Table 9 also reports a 4 MW Newton-Raphson maximum mismatch. Those facts may arise from a different model configuration, a solution/reporting convention, or other implementation details; they do not, by themselves, prove that either source is wrong.
The professional conclusion is narrower and more useful:
A numerical result can serve as a validation target only after its input data, operating condition, control assumptions, and convergence quality have been established.
For a production interconnection study, the utility-provided reference solved case and associated study assumptions would take precedence over a generic published test case.
Diagnose discrepancies systematically
Investigate in an order that moves from high-impact structural causes toward smaller numerical details.
| Observed discrepancy | First checks |
|---|---|
| Many voltages, angles, and flows differ | System base MVA, topology, bus types, load and generation dispatch |
| One generator Mvar differs strongly | Voltage schedule, remote regulation, reactive limits, PV-to-PQ conversion |
| Voltage differences concentrated near one generator transformer | Transformer impedance base, winding data, tap ratio, phase shift, control mode |
| Real-power flows differ but voltages are similar | Generator MW dispatch, load MW, branch resistance/reactance, slack treatment |
| Reactive flows and losses differ more than MW flows | Line charging, transformer magnetizing data, shunts, voltage schedules |
| Only one branch flow has opposite sign | From-bus/to-bus orientation, not necessarily an electrical mismatch |
| Reference and internal total generation differ | Total load, losses, fixed shunts, or an unintended in-service device |
| Reference case does not solve after version conversion | File conversion, incomplete extraction, incompatible settings, or unintended edits |
When you identify a cause, do not overwrite history. Make a controlled correction in a new revision, for example:
IEEE9_SOLVED_BASE_R02_TAPCORRECTED.sav
Then rerun the complete validation comparison. Never revise only the one output cell that looked wrong; corrections to voltage control or transformer data can affect the entire AC solution.
Write a concise validation note
Your final deliverable for this lesson is a short validation record. It should allow another engineer to reproduce both the comparison and the conclusion without reconstructing your decisions from memory.
Title: IEEE 9-Bus PSS/E Base-Case Validation Record

Purpose
Validate internal IEEE9_SOLVED_BASE_R[revision].sav against the
published Alroomi PSS/E reference package.

Reference identity
Source and download date: [record]
Archive and extracted reference file(s): [record]
PSS/E version used for comparison: [record]
Conversion or import notes: [record]

Input-data comparison
Topology/equipment count: [match / describe difference]
System base MVA: [match / describe difference]
Bus types and voltage schedules: [match / describe difference]
Load and generator MW/Mvar schedules: [match / describe difference]
Transformer and line parameters: [match / describe difference]
Control, tap, shunt, and Q-limit assumptions: [match / describe difference]

Solution comparison
Both cases converged: [yes/no]
Largest bus-voltage difference: [value] p.u. at Bus [number]
Largest normalized angle difference: [value] degrees at Bus [number]
Largest MW-flow difference: [value] MW on [element]
Largest Mvar-flow difference: [value] Mvar on [element]
Total MW-loss difference: [value] MW
PV buses at reactive limits: [record]

Material differences and disposition
1. [difference, cause, case revision or rationale]
2. [difference, cause, case revision or rationale]

Conclusion
[Validated for IEEE 9-bus power-flow and manual N-1 teaching use /
not validated; additional correction required.]
If the base-case validation exposes a material difference from the external reference, repeat the Bus 4–Bus 5 N-1 contingency from the previous lesson using the corrected and newly validated base revision. The contingency result belongs to the validated model version, not to an earlier approximate draft.
Key takeaways
A valid PSS®E study case is more than a converged solution. It is a traceable model whose topology, inputs, controls, and solved behavior have been compared against an appropriate reference.
- Use a machine-readable published PSS®E case as the primary benchmark when available; use diagrams and rounded numerical tables as supporting checks.
- Compare input data before interpreting output differences.
- Solve the intact reference and internal cases using controlled, documented settings.
- Compare voltage magnitude, normalized angle, generator output, branch flow, and losses with consistent sign and orientation conventions.
- Declare screening thresholds before reviewing differences, while recognizing that topology and control-definition discrepancies are material regardless of numerical size.
- Document the source, software version, case revisions, differences, causes, and final suitability conclusion.
This completes the IEEE 9-bus PSS®E foundation. The next module moves from a compact teaching network to utility-scale solar, BESS, collector-system, GSU-transformer, and POI-control representations—the modeling boundary that will later support interconnection, MQT, and PSS®E–PSCAD comparison work.
Can't find a good explanation? Sign up and we'll make it for you
Sign up