
Good to begin the hands-on PSS®E portion of the course with a system small enough to understand completely. In the previous module, you defined the data and assumptions needed for credible interconnection studies. The WSCC/IEEE 9-bus system is not a substitute for an authorized utility case, but it is an excellent controlled environment for learning how a transmission model is assembled, solved, checked, and stressed.
This lesson maps the system’s physical structure: the buses, synchronous generators, loads, generator step-up transformers, and alternate transmission paths. It also establishes an important professional habit: separate the network topology from a particular solved operating condition, and separate both from the much broader evidence required for an interconnection study.
The system at a glance
The IEEE 9-bus system represents three generating stations connected through step-up transformers to a 230 kV transmission network supplying three loads. Its nine buses are not nine arbitrary nodes: the bus numbers encode useful functional roles.
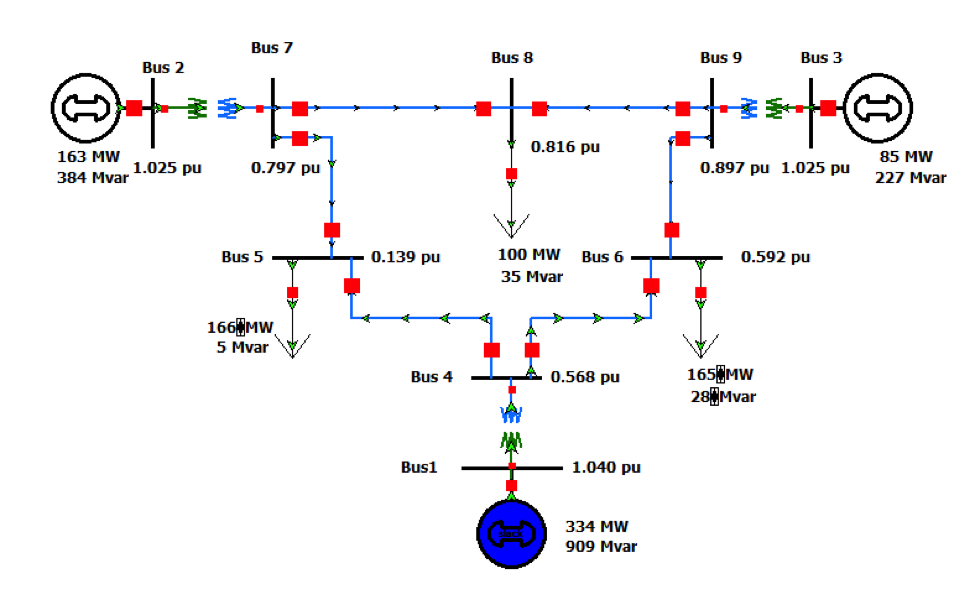
The network can be understood in two layers:
- Generating-station layer: generator terminal buses 1, 2, and 3 connect to the transmission system through GSUs.
- 230 kV transmission layer: buses 4 through 9 form a six-bus ring. Generation is injected at three points on that ring, and loads are withdrawn at three other points.
This makes the case particularly useful for power-flow learning. You can change a generator dispatch, load, line status, transformer tap, or voltage setpoint and observe a network-wide response without navigating thousands of buses.
The case is commonly called “WSCC 9-bus,” “IEEE 9-bus,” or “three-machine nine-bus system.” Published versions can differ in dispatch, load level, ratings, naming, and dynamic data. Therefore, treat a chosen set of input data as a specific reference case, not as the one universal IEEE 9-bus dataset.
Identify each bus by its electrical role
The following table gives the conventional interpretation used in the one-line diagrams. This is the functional map you should retain before opening PSS®E.
| Bus | Typical nominal-voltage role | Primary function | Direct connections |
|---|---|---|---|
| 1 | 16.5 kV generator terminal | Generator 1 terminal; normally the swing or reference generator in the standard power-flow case | GSU to bus 4 |
| 2 | 18 kV generator terminal | Generator 2 terminal; normally a voltage-controlled generator bus | GSU to bus 7 |
| 3 | 13.8 kV generator terminal | Generator 3 terminal; normally a voltage-controlled generator bus | GSU to bus 9 |
| 4 | 230 kV | High side of Generator 1 GSU; transmission junction | Buses 1, 5, and 6 |
| 5 | 230 kV | Load A bus and transmission junction | Buses 4 and 7 |
| 6 | 230 kV | Load B bus and transmission junction | Buses 4 and 9 |
| 7 | 230 kV | High side of Generator 2 GSU; transmission junction | Buses 2, 5, and 8 |
| 8 | 230 kV | Load C bus and transmission junction | Buses 7 and 9 |
| 9 | 230 kV | High side of Generator 3 GSU; transmission junction | Buses 3, 6, and 8 |
A few distinctions matter:
- Bus 4, bus 7, and bus 9 are not generator terminal buses. They are the high-voltage network buses on the transmission side of the GSUs.
- Bus 5, bus 6, and bus 8 each carry a load, but they are also transmission junctions. They are not electrically isolated “load-only” stubs.
- Buses 1, 2, and 3 are generator-side buses at lower nominal voltages. Each connects to the remainder of the network only through its generator step-up transformer.
In a conventional PSS®E steady-state representation, the usual bus-type arrangement is:
| PSS®E role | Standard bus assignment | Meaning |
|---|---|---|
| Swing bus | Bus 1 | Establishes the angle reference and supplies the residual real and reactive power needed to balance the solved case. |
| Generator or PV buses | Buses 2 and 3 | Hold specified real-power output and voltage magnitude, while reactive output varies within limits. |
| Load or PQ buses | Buses 4–9 | Include the load buses and the zero-injection transmission junction buses. |
The labels “swing,” “PV,” and “PQ” describe how the bus participates in the power-flow solution. They do not necessarily describe the physical equipment permanently. For example, a synchronous generator at bus 2 is physically capable of regulating voltage, but if it reaches its reactive limit in a solve, PSS®E may no longer be able to hold its voltage target.
The three generators and their GSUs
Each generating station has a synchronous generator represented at a low-voltage terminal bus. A generator step-up transformer then raises voltage to the 230 kV transmission network.

The three station connections are:
| Generating station | Generator terminal bus | Transmission-side bus | GSU function |
|---|---|---|---|
| Generator 1 | Bus 1 | Bus 4 | Connects the 16.5 kV generator terminal to the 230 kV network |
| Generator 2 | Bus 2 | Bus 7 | Connects the 18 kV generator terminal to the 230 kV network |
| Generator 3 | Bus 3 | Bus 9 | Connects the 13.8 kV generator terminal to the 230 kV network |
In the parameter diagram, each GSU is shown primarily as a reactance. For example, the transformer joining buses 1 and 4 is labeled with a series reactance, as are the GSUs between buses 2 and 7 and between buses 3 and 9.
For the steady-state case you will build later, a PSS®E transformer record needs more than the conceptual statement “there is a GSU here.” It must eventually include items such as:
- terminal buses;
- winding nominal voltages;
- impedance and its MVA base;
- winding ratings;
- tap data, if applicable;
- winding connections and phase shift where relevant; and
- control settings, if the transformer regulates voltage.
The published nine-bus diagrams are intentionally simplified. They are useful for topology and basic parameter entry, but they do not replace a project transformer test report or a utility-approved transformer data package.
Why the swing generator matters
The three listed generator MW outputs may not exactly equal the three listed load MW demands. Real-power losses occur in transmission lines and transformers. The swing generator absorbs the residual difference required to balance generation, demand, and losses.
Conceptually:
In a solved power flow, bus 1 is commonly assigned as the swing bus. Its active and reactive output are therefore results of the solved network, within its modeled limits. This is why a generator’s reported output in a solved one-line may differ from an initially scheduled value.
For later interconnection studies, this same idea becomes more consequential: adding a solar plant, BESS charge load, BESS discharge, or large data-center load requires an explicit balancing assumption. PSS®E cannot solve a physically meaningful case if new MW is added without specifying which generators, loads, interchange schedules, or equivalent sources respond.
The loads: buses 5, 6, and 8
The standard system places three loads on the 230 kV transmission network:
- Load A at bus 5
- Load B at bus 6
- Load C at bus 8
A commonly used reference dataset specifies loads approximately as follows:
| Load bus | Typical real-power demand | Typical reactive-power demand |
|---|---|---|
| Bus 5 | 90 MW | 30 MVAr |
| Bus 6 | 100 MW | 35 MVAr |
| Bus 8 | 125 MW | 50 MVAr |
Do not assume that the MW and MVAr labels shown on every published diagram must match these values exactly. A diagram may depict a different solved dispatch or an altered educational operating condition. When you build the case, choose one documented dataset and validate your final solved results against the corresponding reference solution.
The loads are normally modeled as fixed PQ demand for this introductory case. That means each load has specified real and reactive power rather than a voltage-dependent load model. This is an appropriate simplification for learning the mechanics of an AC solution, but it is a major limitation for studying realistic data centers, motor loads, converter-fed load, or voltage-collapse behavior.
A utility-scale data-center model would typically require much more information than a fixed MW and MVAr value: staged expansion, power factor range, voltage sensitivity, UPS/rectifier behavior, transfer schemes, backup-generation operation, controllable-load functions, and restoration assumptions. Those details are deliberately absent here.
The 230 kV transmission ring and its alternate paths
The six high-voltage buses form a closed transmission ring:
- Bus 4 connects to bus 5 and bus 6.
- Bus 5 connects to bus 7.
- Bus 7 connects to bus 8.
- Bus 8 connects to bus 9.
- Bus 9 connects to bus 6.
- Bus 6 closes the ring back to bus 4.
The branch connectivity is therefore:
| Transmission branch | Network significance |
|---|---|
| Bus 4–5 | One path from Generator 1’s high-side bus toward Load A and Generator 2’s area |
| Bus 4–6 | A second path from Generator 1’s high-side bus toward Load B and Generator 3’s area |
| Bus 5–7 | Connects Load A with Generator 2’s high-side bus |
| Bus 7–8 | Connects Generator 2’s area to Load C |
| Bus 8–9 | Connects Load C to Generator 3’s area |
| Bus 9–6 | Connects Generator 3’s area to Load B |
Because the 230 kV network is a ring, electrical power can take alternative routes. For example, power injected at bus 4 can reach bus 8 through the bus 5 and bus 7 side of the ring, or through the bus 6 and bus 9 side. The actual flow split is not selected manually. It emerges from:
- branch series impedance;
- line charging;
- voltage magnitudes and phase-angle differences;
- generation dispatch;
- load distribution;
- transformer ratios and control settings; and
- the status of all in-service network elements.
This point is fundamental. A transmission line does not “belong” to a particular generator or load simply because it is visually nearby on a one-line. After a dispatch change or an outage, the entire flow pattern can redistribute.
What the impedance labels mean
The parameter diagram shows transmission branches with values such as:
where is series resistance and is series reactance. It also shows terms written as , which represent half of the line’s shunt charging susceptance assigned to each end of a standard transmission-line pi model.
For example, a branch data record in a power-flow model usually needs:
- series resistance ;
- series reactance ;
- total line charging susceptance ;
- normal and emergency ratings;
- terminal buses;
- circuit identifier; and
- in-service or out-of-service status.
The diagram gives you the electrical structure and some key electrical parameters. It does not necessarily give all the ratings, ownership information, seasonal limits, relay settings, sequence data, or control logic needed for a planning-quality model.
How to read an operating diagram without confusing results and inputs
The operational diagram includes voltage magnitudes in per unit and generator/load MW and MVAr quantities. Those labels are useful, but they should be interpreted carefully.
Inputs to a power-flow case
Typical inputs include:
- bus nominal kV;
- generator voltage setpoints;
- scheduled generator MW output;
- generator reactive limits;
- load MW and MVAr;
- branch impedance and charging;
- transformer impedance, ratio, and tap information;
- equipment ratings; and
- branch and equipment status.
Results from a successful solution
Typical solved outputs include:
- bus voltage magnitude and angle;
- actual generator reactive output;
- swing-generator MW and MVAr output;
- branch MW, MVAr, and MVA flow at each end;
- real-power loss;
- reactive-power loss or charging contribution; and
- equipment loading relative to its rating.
A displayed voltage such as 1.025 per unit is therefore not merely a decorative label. At a generator-controlled bus, it often reflects a specified voltage target. At a load bus, it is ordinarily a calculated result. In later PSS®E work, this distinction will help you diagnose whether an unexpected voltage is caused by an incorrect setpoint, a generator reactive limit, a missing shunt, a transformer-control issue, or a genuine network weakness.
Why this case is useful for PSS®E practice
The IEEE 9-bus case is a compact laboratory for essential PSS®E habits:
- translating a one-line into buses, branches, transformers, generators, and loads;
- maintaining consistent per-unit bases and nominal voltages;
- selecting swing and generator bus roles;
- solving an AC power flow;
- reviewing bus voltages, generator reactive output, and branch loading;
- applying a line or transformer outage;
- recognizing flow redistribution in a meshed transmission system; and
- comparing your solved results to a documented reference.
It also has a useful scale for learning contingency logic. A single transmission-line outage generally leaves an alternate route around the 230 kV ring. That makes it easier to observe voltage and thermal changes without immediately producing a fragmented system.
Given your ETAP load-flow and short-circuit experience, the unfamiliar part is not the electrical logic. It is the PSS®E representation and workflow: its bus records, branch records, transformer records, case files, solution options, and validation practices. The nine-bus system keeps those software-specific details visible rather than burying them in a large network.
Limitations for real interconnection and siting studies
A successful IEEE 9-bus contingency run is evidence that you can operate the analysis workflow. It is not evidence that a renewable, BESS, data-center, or transmission project is feasible.
| Missing or simplified feature | Why it matters in real interconnection work |
|---|---|
| Only three conventional synchronous generators | It does not represent a diverse resource mix, inverter-based-resource penetration, retirement patterns, commitment states, or regional dispatch. |
| No solar, BESS, hybrid-plant, or PPC model | It cannot demonstrate POI voltage control, reactive capability, charge/discharge behavior, grid-forming behavior, inverter current limits, or plant-controller coordination. |
| No complete dynamic model chain | A static one-line does not establish dynamic stability, ride-through performance, frequency response, or model quality. |
| No EMT representation | It cannot answer phase-angle-jump, detailed protection, converter-control interaction, harmonic, or sub-cycle fault-recovery questions. |
| Very small, symmetric-like network scale | A few branches can dominate results unrealistically. Real regional systems have multiple voltage levels, parallel paths, major interfaces, and geographically distributed generation and demand. |
| Simplified load behavior | Fixed PQ loads do not capture data-center energization, load blocks, UPS systems, motor behavior, voltage dependence, or demand response. |
| Limited contingency realism | It has no approved regional contingency database, planned-outage set, protection-system contingencies, common-mode events, or operational adjustment rules for N-1-1 studies. |
| No regional operating scenarios | It has no seasonal peak and light-load cases, renewable profiles, BESS state of charge, transfer assumptions, interchange schedules, or future portfolio assumptions. |
| No authorized utility model basis | It cannot represent actual transmission-owner ratings, topology, queue projects, confidential equipment data, or the assumptions used in a cluster study. |
| Insufficient short-circuit detail | A realistic fault study needs credible positive-, negative-, and zero-sequence data, grounding, transformer vector groups, and source behavior. |
| No commercial or contractual context | It contains no POI agreement, export/import limit, generation interconnection agreement, large-load service arrangement, or study-specific operating restriction. |
Two limitations deserve particular emphasis for your target work.
First, grid strength in the nine-bus system is not a project siting conclusion. You could compute fault duty or create a simplified SCR-like calculation, but it would only characterize that artificial case under its chosen dispatch and topology. It does not establish the strength of a real candidate POI in ERCOT, WECC, or SPP.
Second, an N-1 result in the nine-bus case is instructional, not planning-criteria compliance. A real study must use the governing regional criteria, an approved base case, applicable ratings, a controlled contingency list, and the required treatment of non-convergence, islanding, corrective action, and sequential N-1-1 adjustments.
A productive way to state the model’s purpose is:
The IEEE 9-bus system is a verified training case for building and checking modeling competence. It is not a surrogate for an authorized interconnection base case or a basis for project-development decisions.
A working topology note for the next lessons
Before creating records in PSS®E, retain this compact map:
- Three generator terminal buses: 1, 2, 3
- Three GSU transformers: 1–4, 2–7, 3–9
- Three load buses: 5, 6, 8
- Six 230 kV transmission branches: 4–5, 4–6, 5–7, 7–8, 8–9, 9–6
- One meshed 230 kV ring: 4, 5, 7, 8, 9, 6
- Standard power-flow roles: bus 1 swing; buses 2 and 3 voltage-controlled generators
This is the topology you will translate into PSS®E. Keep the topology, published equipment data, assumptions, and solved results in separate notes or files from the start. That discipline scales directly to controlled cluster-model work.
Key takeaways
The WSCC/IEEE 9-bus system contains three synchronous generators at buses 1–3, each connected through a GSU to a 230 kV ring. Buses 4, 7, and 9 are generator-side transmission buses; buses 5, 6, and 8 are load buses that also lie on the transmission network.
Its six 230 kV branches provide alternate pathways, so changing dispatch or removing a line redistributes flows across the ring. In the standard power-flow formulation, bus 1 is the swing bus, buses 2 and 3 are voltage-controlled generator buses, and buses 4–9 are load or network buses.
The case is ideal for learning PSS®E modeling and contingency fundamentals, but it lacks the network scale, regional scenarios, approved contingency definitions, detailed sequence data, renewable and BESS controls, dynamic models, EMT behavior, and contractual context needed for real interconnection decisions.
Next, you will establish a traceable PSS®E workspace and distinguish the roles of RAW, SAV, SEQ, DYR, snapshot, playback, and simulation-output files.
Can't find a good explanation? Sign up and we'll make it for you
Sign up