
Good to continue from time and news risk into data alignment risk. You have now defined a personal NY execution window and a news-blackout policy. Those rules only work if the chart used for context and the order-flow display used for confirmation describe the same market, on the same price basis, over the same time window.
Before any NQ analysis, you will verify three things:
- Contract identity: TradingView and Bookmap refer to the same NQ or MNQ expiration.
- Price basis: the displayed prices are comparable, including whether a continuous chart has been adjusted across rollovers.
- Session basis: both platforms use the same time zone and the same NY-session boundaries for the references you intend to use.
This is a short operational lesson, but it is foundational. A volume-profile level, overnight high, or apparent liquidity response is not trustworthy as a cross-platform observation if one platform is showing a different contract or session.
Alignment is a precondition, not a chart preference
TradingView and Bookmap have different jobs:
- TradingView is useful for higher-level structure, drawings, session references, and profiles.
- Bookmap shows the order book and executed transactions for a particular data-feed symbol.
They can legitimately look different in style. Alignment does not mean matching candle colors, indicators, zoom level, or Bookmap heat-map contrast. It means that a price such as 21,450.00 denotes the same tradable instrument and comparable point in time on both screens.
A useful daily standard is:
Do not interpret Bookmap activity at a TradingView level until the contract, time zone, session definition, and live-price status have passed a quick verification.
The most dangerous mismatch is subtle. You may draw a prior-session high on a continuous NQ chart, then watch Bookmap on an individual contract whose price differs because of a rollover. The heat map may appear to react “early” or “late” to your level. That is not necessarily meaningful order flow; it may simply be two different price series.
1. Match the actual futures contract
A futures symbol contains more information than its root name.
| Component | Example | What it tells you |
|---|---|---|
| Product root | NQ or MNQ | E-mini Nasdaq-100 or Micro E-mini Nasdaq-100 |
| Month code | H, M, U, or Z | Contract expiration month |
| Year | 26 | Contract year |
| Exchange | CME | The venue for the contract |
| Data-feed notation | Varies | The syntax required by TradingView, Bookmap, or your broker |
For index futures, the principal quarterly contracts are March, June, September, and December. Their codes are , , , and , respectively. For example, an NQ symbol with the code is the March contract; one with is the June contract.
Bookmap’s Symbol Table is useful because the same contract is written differently by different feeds. Read the Month Codes table, then find the E-mini NASDAQ 100 Futures and Micro E-mini NASDAQ 100 Futures rows in the Symbols Mapping table. The objective is not to memorize every vendor syntax; it is to recognize that different labels can still refer to the same underlying expiration.
Bookmap®️ Symbol Table | Bookmap
Read Bookmap’s reference table to connect futures month codes with the NQ and MNQ naming conventions used by common data feeds.
In the “Month Codes” table, review the month codes, paying particular attention to March, June, September, and December. Then, in “Symbols Mapping,” locate the “E-mini NASDAQ 100 Futures” and “Micro E-mini NASDAQ 100 Futures” rows. Finally, use the “Notations” example to see how a root, month code, and year form a complete contract identifier.
NQ and MNQ are not interchangeable for order-flow evidence
NQ and MNQ track the same Nasdaq-100 benchmark, but they are separate contracts with separate order books and separate executed volume. Their quoted prices will often be close, but they need not be identical tick for tick at every instant.
Therefore:
- If you intend to trade NQ, use NQ for Bookmap order-flow analysis whenever possible.
- If you intend to trade MNQ, use MNQ for Bookmap order-flow analysis.
- Do not treat liquidity displayed in MNQ as if it were resting NQ liquidity, or vice versa.
- If you use one product for execution and another for contextual charting, record that choice explicitly and do not assume exact level equivalence.
For this course, the clean default is simple: use the same product and same expiration in both platforms.
Continuous chart versus tradable contract
A TradingView continuous symbol such as NQ1! is a stitched series made from successive expirations. It is valuable for a long-term chart because it prevents a chart from ending whenever a contract expires. However, it is not itself a contract you can trade and it cannot be the exact instrument shown in a live Bookmap order book.
On a normal non-roll date, the continuous chart may closely resemble the current active contract. Around rollover, however, the old and new contracts can trade at different prices. In addition, a provider may use an adjusted continuous series to reduce visible gaps between contracts. That adjustment can alter the historical numerical price of an old level.
TradingView provides contract-switching icons and optional separators so you can identify where its continuous series changes from one contract to the next.
Switching continuous futures contracts — TradingView
TradingView’s support note shows how to identify the contract boundaries hidden inside a continuous futures chart and how to open the underlying individual contract.
In “Switching continuous futures contracts,” read the explanation of switching icons and separators. On your NQ1! chart, enable the contract-switching markers or vertical separators. Click a recent switch marker once so that you know which individual contract TradingView used before and after that boundary.
The practical rule is:
Use a continuous chart for broad historical context if you wish, but use the active individual contract for precise intraday levels and for any direct comparison with Bookmap.
This matters especially in replay. If you replay a date from a prior expiration in Bookmap, compare it with that historical contract in TradingView, not with today’s active contract or an adjusted continuous series.
2. Put both platforms on the same price basis
Contract identity is necessary, but it is not enough. The next question is: do the prices on both screens represent the same live market?
For NQ and MNQ, the minimum price increment is index points. A displayed level should therefore fall on a quarter-point increment, such as 21,450.00, 21,450.25, or 21,450.50.
Use this live price check before your analysis window:
- Confirm that both symbols have the same root, expiration, and CME venue.
- Confirm that both services are receiving live rather than delayed data.
- Place both displays at a similar current timestamp.
- Compare the most recent traded price, allowing only normal momentary movement while the market is updating.
- If the displayed values diverge persistently, stop and identify the cause before marking levels.
A persistent mismatch usually has one of four causes:
| Likely cause | What it looks like | Correct response |
|---|---|---|
| Different product | NQ on one platform, MNQ on the other | Use the same product for execution-sensitive analysis |
| Different expiration | One platform has rolled; the other has not | Select the same current or replay-date contract |
| Delayed market data | One price updates materially later | Do not use the delayed display for live confirmation |
| Continuous-series adjustment | Historical levels differ near or before a roll | Open the individual contract; reassess old drawings |
A minor difference observed while price is actively moving is not automatically a problem. TradingView’s candle close is based on transactions; Bookmap may show the most recently traded level, bid, ask, or a dynamically aggregated visual display. The question is whether both platforms converge when you compare the same individual contract at the same moment, not whether two rapidly changing displays freeze on the identical tick.
One important distinction for later lessons: Bookmap’s visual aggregation can change the apparent size of bubbles or displayed liquidity as you zoom. That affects how volume is displayed, not the underlying contract’s tick grid. For this lesson, keep the focus on symbol and price-level alignment.
3. Match the session clock before using session references
The prior lesson defined three clocks:
- The broader CME futures session.
- The NY cash-equity session.
- Your personal execution window of 10:00–11:30 a.m. ET.
They serve different purposes. Your execution window is not the same thing as the analysis session used to create an NY high, low, VWAP, or volume profile.
For this course, use the following default definitions unless you deliberately document a different research convention:
| Reference | Default boundary | Purpose |
|---|---|---|
| Overnight reference | CME session start through 9:29:59 a.m. ET | Overnight high, low, and inventory context |
| NY regular-hours analysis | 9:30 a.m.–4:00 p.m. ET | NY high/low, RTH profile, session VWAP |
| Personal execution window | 10:00–11:30 a.m. ET | Period in which new Version 1 trades are permitted |
The session-selection image below illustrates the distinction between electronic and regular trading hours in TradingView. It uses an S&P 500 futures chart, but the operational issue is the same for NQ: inspect the actual boundary of the selected session rather than relying solely on its label.
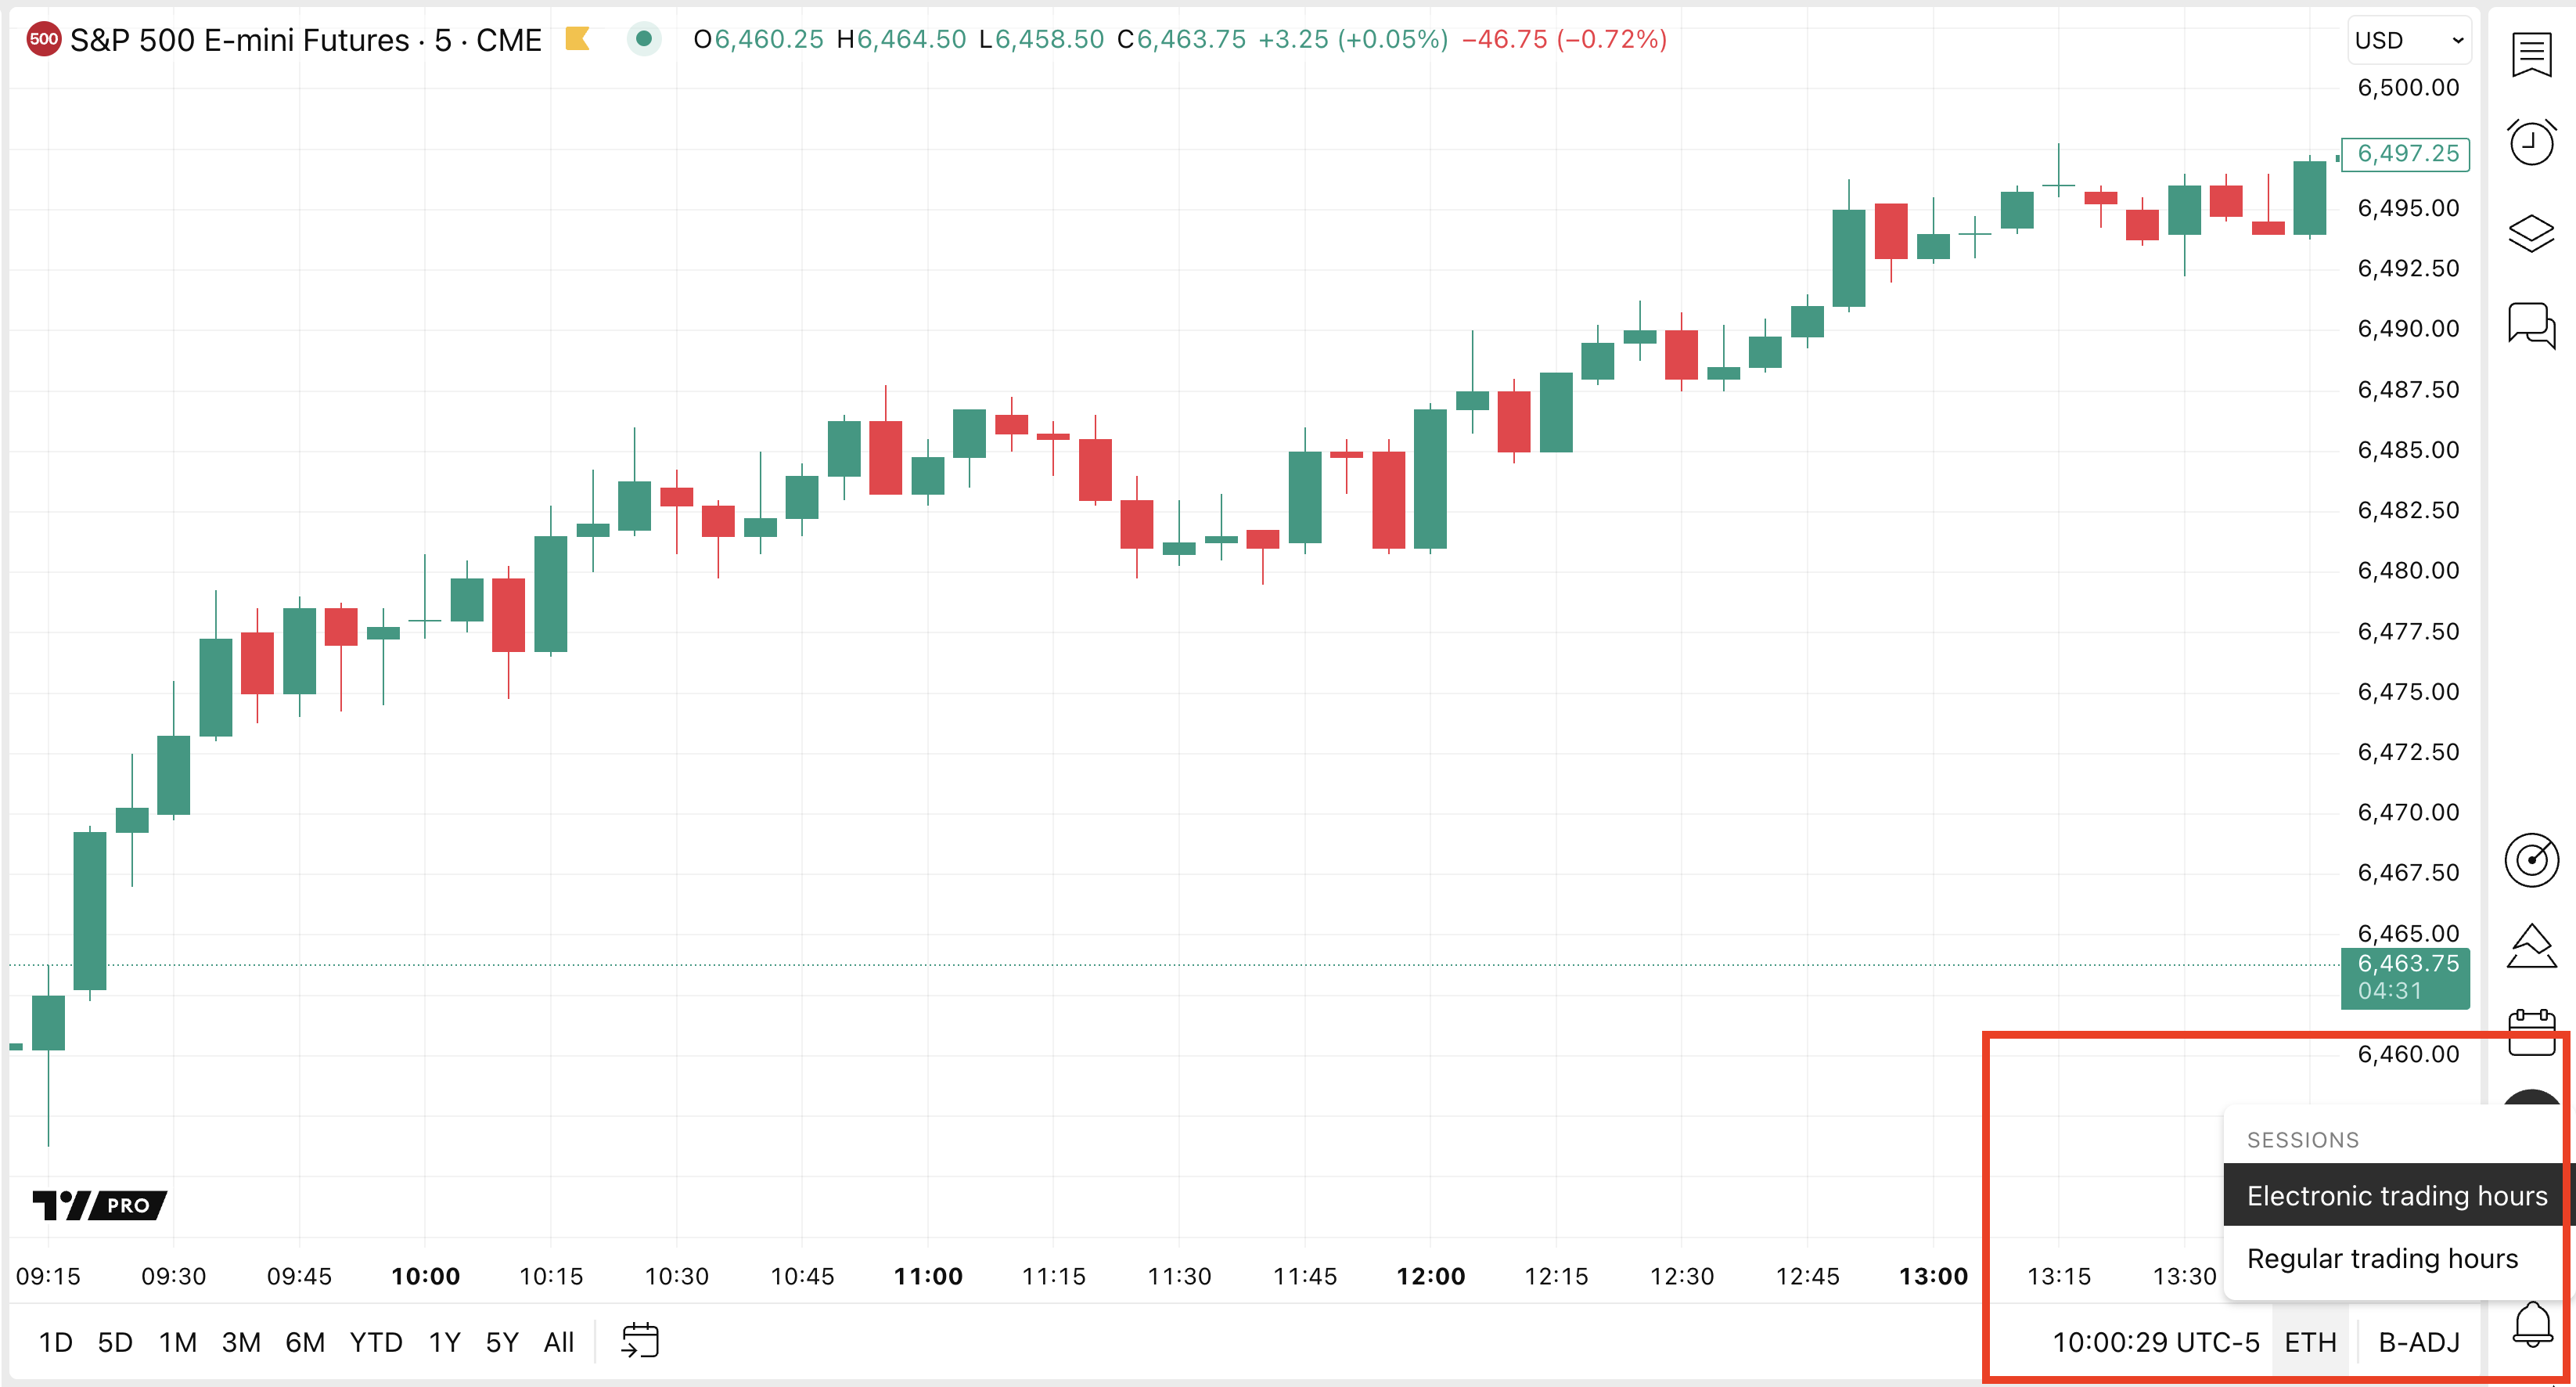
TradingView session checks
On TradingView:
- Set the chart time zone to New York / Eastern Time.
- Select the session mode that matches the reference you are creating.
- Verify visually that the first NY regular-hours bar begins at 9:30 a.m. ET.
- Verify that a session-specific profile, VWAP, or drawing uses the intended boundary.
- Keep in mind that a visible chart’s session setting and an indicator’s individual session input can be separate settings. Check both when applicable.
“Regular trading hours” is a platform label, not a substitute for verification. Templates and available choices can vary by symbol, exchange, or chart configuration. The observable test is always the same: does the NY session begin at 9:30 a.m. ET and end at 4:00 p.m. ET on the chart you are using?
Bookmap session checks
In Bookmap, verify:
- The loaded symbol is the same NQ or MNQ expiration as TradingView.
- The Bookmap clock is set to, or clearly interpreted in, Eastern Time.
- Any session-volume-profile column labeled “RTH” resets at 9:30 a.m. ET.
- You are not confusing a chart-volume profile, which changes with the visible chart range, with a fixed session profile.
- Your overnight and NY-session references are derived from the same boundaries you use in TradingView.
The Bookmap tutorial demonstrates this distinction: the presenter configures an RTH session profile to reset at 9:30 a.m. ET, while a chart volume profile changes when the displayed chart range changes. Watch this portion as a configuration concept, not as a recommendation to copy the presenter’s colors, add-ons, or trading method.
Bookmap Tutorial: The Best Trading Tool
In “Bookmap Tutorial: The Best Trading Tool,” Carmine Rosato distinguishes a fixed RTH session profile from a chart-range profile. This is the key configuration idea for making Bookmap’s session references comparable with TradingView’s.
Watch session profiles. Focus on the explanation that the RTH column resets at 9:30 a.m. Eastern Time, whereas the chart volume profile changes with the visible chart window. In your own Bookmap layout, identify which profile column is session-reset based and record its reset time.
Do not compare an RTH profile on one platform with a full electronic-session profile on the other. Both may be internally correct, but they answer different questions and will produce different POCs, value areas, highs, and lows.
A five-minute daily alignment protocol
Complete this before your 8:45 a.m. ET preparation period. It should become routine enough that it requires little thought.
A. Record contract identity
Write the following in your premarket note:
| Field | Example entry |
|---|---|
| Product used for execution | NQ or MNQ |
| TradingView symbol | Exact displayed symbol |
| Bookmap symbol and feed | Exact displayed symbol and feed |
| Expiration | Same month and year on both platforms |
| Contract status | Current active contract or historical replay contract |
Do not write merely “NQ.” Write the full contract information as your platforms show it.
B. Verify the price basis
Check that both displays are live and compare current price action for the same contract. If one screen is delayed, has rolled differently, or appears to use an adjusted historical series, mark it as a failed check and correct it before analysis.
For a rollover week, take an extra minute to inspect TradingView’s contract-switch marker. The active contract can change before its formal expiration as volume and liquidity migrate. Follow the contract your broker and primary execution venue are actually using, then make TradingView and Bookmap match it.
C. Verify the session basis
Record:
- Time zone: Eastern Time.
- NY-session start: 9:30 a.m. ET.
- NY-session end: 4:00 p.m. ET.
- Bookmap RTH/profile reset: 9:30 a.m. ET.
- Execution permission: still begins only at 10:00 a.m. ET under the Version 1 plan.
At 9:30 a.m., perform a visual confirmation: TradingView should begin its intended NY session, and Bookmap’s session-reset profile should begin accumulating from the same point. If either does not, fix the setting before using that day’s levels.
D. Give the setup a pass or fail status
End the note with one line:
Platform alignment: Pass / Fail
Reason if failed: contract / data delay / price basis / session boundary.
A failed check is not a technicality. It means you may observe the market, but you should not rely on cross-platform agreement to support a trade decision.
Key takeaways
Cross-platform analysis begins with a shared reference frame:
- A continuous TradingView symbol such as NQ1! is a useful stitched chart, not a tradable order-book contract.
- For intraday execution-sensitive analysis, align TradingView and Bookmap to the same product, expiration, and CME contract.
- NQ and MNQ are related but separate markets; do not treat their liquidity or executed volume as interchangeable.
- Check that prices are current and comparable, particularly during rollover periods or when a continuous series has adjusted historical prices.
- Use Eastern Time and explicitly verify that NY regular-hours references begin at 9:30 a.m. ET on both platforms.
- Your 10:00–11:30 a.m. execution window remains a risk rule; it is distinct from the full NY analytical session.
You now have a controlled technical environment for the next module: Auction Market Theory. With contract and session mismatches removed, you can begin interpreting whether the market is balancing around value or searching for a new area of value.
Can't find a good explanation? Sign up and we'll make it for you
Sign up