
Hello again. Your dashboard from the previous lesson described an economy with improving early-2026 output per person and easing inflation, but a cooling labour market, fragile investment, and weak underlying productivity growth. That is a useful diagnosis, but it is not yet an explanation.
This lesson adds the explanation layer: a compact causal map beside the dashboard. You will distinguish policy transmission—how a decision can affect the economy—from a claim of proven causation in the latest data. The map will show how inflation conditions shape Bank of England decisions; how Bank Rate reaches households and firms; and how tax and spending choices affect both short-run demand and the economy’s longer-run productive capacity.
1. Treat the map as a set of mechanisms, not a blame chart
A dashboard records what is happening. A causal map sets out plausible pathways through which policy and economic conditions interact. It should not imply that every movement in GDP, inflation, or investment has one cause.
For example, business investment was lower year on year in the dashboard. Higher financing costs can discourage investment, but firms also respond to expected demand, uncertainty, their existing cash reserves, sector-specific opportunities, regulation, and trade conditions. Your map should therefore use language such as:
- can raise / can reduce
- puts upward or downward pressure on
- operates with a lag
- depends on household and firm circumstances
This is much more rigorous than writing “higher rates caused weak growth.”
There are two useful distinctions to keep visible.
| Distinction | Meaning for your UK outlook brief |
|---|---|
| Demand versus capacity | Demand is current spending on goods and services. Capacity, or potential output, is what the economy can sustainably produce without generating persistent inflation. |
| Level versus growth rate | Inflation is the rate at which prices rise, not the overall price level. Lower inflation eases the erosion of purchasing power, but prices may still be rising. |
| Direct versus indirect effects | A tax change directly changes disposable income or post-tax profits. Spending, investment, pricing, hiring, and monetary-policy responses are later effects. |
| Short-run versus durable effects | A demand boost may lift GDP temporarily. A change that raises the capital stock, skills, or productivity can raise potential output more durably. |
The final distinction will be especially important in the next module: the UK’s central question is not simply whether growth picks up for a quarter, but whether investment and productivity lift the country’s medium-term capacity to grow.
2. Inflation and Bank Rate: the monetary-policy transmission map
The Bank of England’s Monetary Policy Committee sets Bank Rate, the core interest rate paid on commercial-bank reserves and charged on loans to eligible financial institutions. It influences, but does not mechanically dictate, the rates households and firms face.
Interest rates and Bank Rate: our latest decision
Read the Bank of England’s short explanation of Bank Rate and its primary spending-and-inflation channel. This is the authoritative UK foundation for the monetary side of your map.
In the section “What is Bank Rate?”, read from Bank Rate's role. Notice that Bank Rate changes commercial banks’ lending and savings rates rather than setting every mortgage, business-loan, or deposit rate directly. Then, in “How do interest rates affect inflation?”, read the higher-rate channel, followed by the immediately following explanation of lower rates. Focus on the intermediary mechanism: borrowing costs, saving incentives, spending, firms’ pricing power, and inflation.
The Monetary Transmission Mechanism image below gives a useful visual template. It starts with the official rate and separates four major channels: market rates, asset prices, expectations/confidence, and the exchange rate. These channels then influence domestic demand, net external demand, imported prices, and ultimately inflationary pressure.
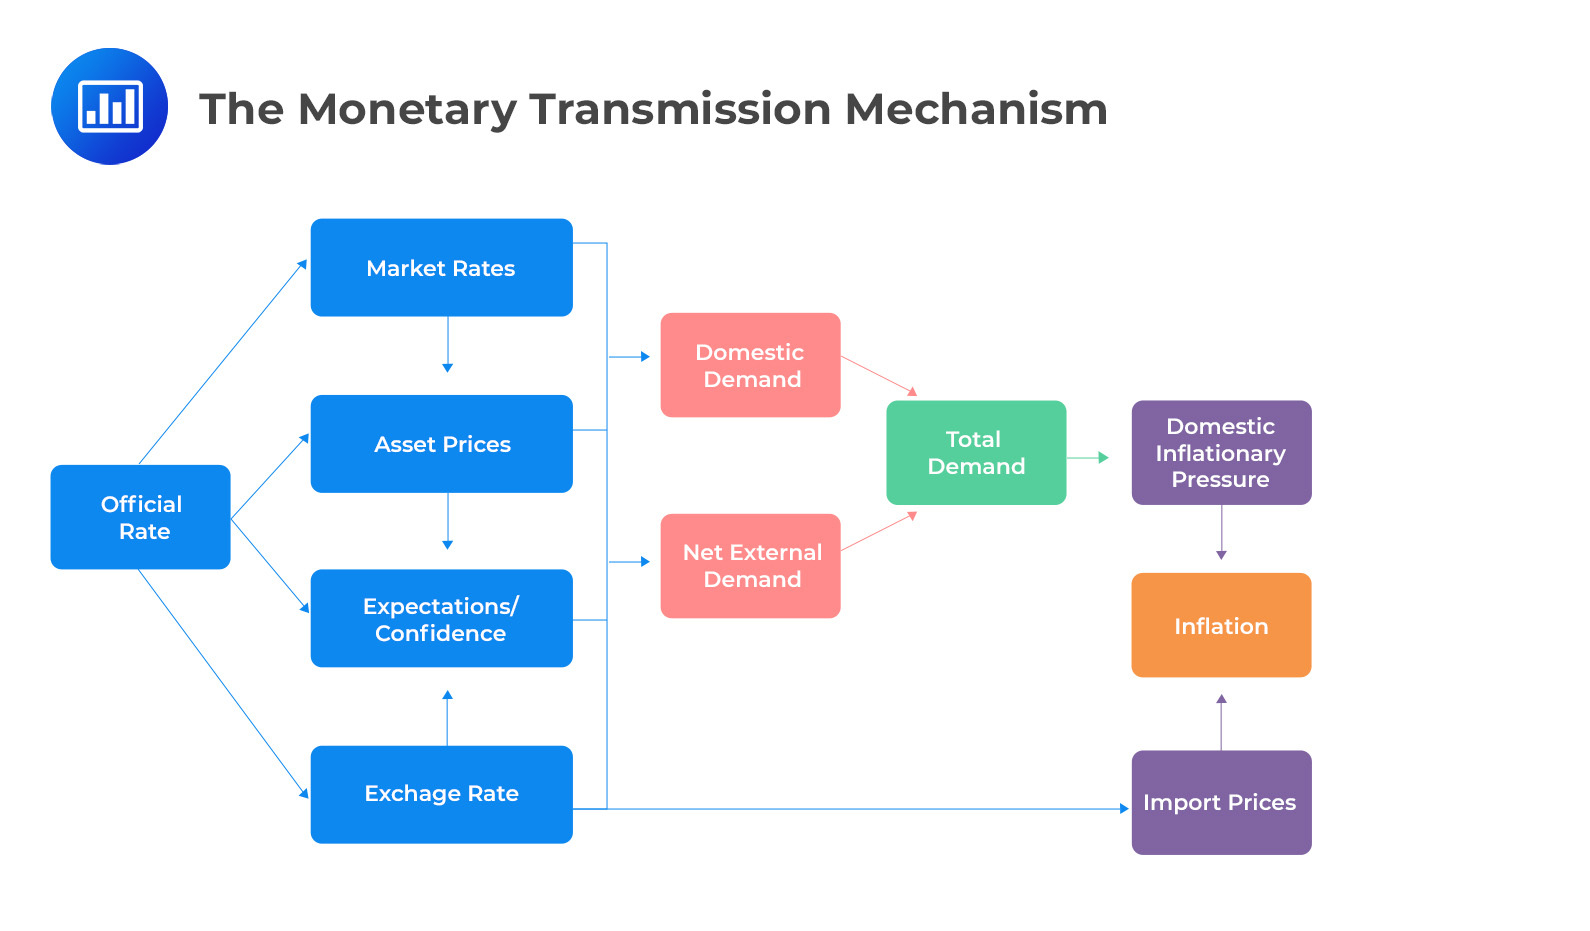
The arrows in this diagram represent mechanisms, not fixed-size effects. In a particular period, one channel can be weak while another is powerful. For instance, a household with no debt is not directly squeezed by a mortgage-rate increase; a firm funding investment from retained profits is less immediately exposed than a firm refinancing a loan.
For a clear visual walk-through of the channels, use the following short segment.
Monetary Policy Transmission Mechanism
In “Monetary Policy Transmission Mechanism,” EconplusDal traces how a UK policy-rate change works through market borrowing costs, property and confidence, sterling, and imported inputs. Watch it to make the supplied map easier to read as a system rather than as isolated arrows.
Watch borrowing costs for the connection between the official rate, commercial lending, mortgages, saving, and business finance. Then watch confidence and sterling to see why rate decisions also affect expectations and external demand. Finish with demand and costs, which connects aggregate demand and imported-input costs to domestic inflationary pressure.
Read the rate decision in its full loop
A simple rate map for your dashboard has three stages:
-
Inflation conditions and forecasts inform the MPC’s decision.
The MPC assesses current inflation, domestic price pressure, wage developments, economic activity, and expected future inflation. It targets 2% CPI inflation over time, not a particular GDP growth rate or unemployment rate. -
Bank Rate affects financial conditions.
A higher Bank Rate tends to raise borrowing costs and saving returns. A lower Bank Rate tends to do the reverse. Financial-market expectations may move before, alongside, or independently of the formal decision, so actual mortgage and corporate rates will not always change one-for-one on announcement day. -
Financial conditions affect demand, prices, and growth.
Higher rates tend to restrain household consumption and firms’ capital expenditure. Weaker demand reduces firms’ scope to keep raising prices, helping return inflation toward target. But the same restraint can reduce near-term GDP growth and job creation.
This is a feedback loop, not a one-way policy lever. If inflation remains above target, keeping financial conditions restrictive may be judged necessary even when GDP growth is weak. Conversely, a reduction in Bank Rate can support demand, but it may be inappropriate if policymakers expect inflationary pressure to re-emerge.
The household channel: disposable income, saving, and confidence
When rates rise, households with mortgages or other variable/refinancing debt can face higher repayments. That leaves less disposable income for consumption. At the same time, better saving returns can lead some households to defer spending.
The effect is uneven:
- Indebted households generally experience a stronger negative cash-flow effect.
- Savers may gain interest income and can increase spending instead.
- Households on fixed-rate debt may be initially insulated, with the effect arriving when they refinance.
- People without significant debt or savings may be affected mainly through employment, wage expectations, and general confidence.
For your dashboard annotation, connect the previous lesson’s easing inflation and slowing nominal wage growth to household demand carefully:
Easing inflation supports real purchasing power, but restrictive financial conditions and a cooling labour market can offset some of that support by weakening confidence, employment growth, and debt-servicing capacity.
This is not contradictory. The same period can contain lower inflation and softer demand.
The firm channel: finance, required returns, and investment
For firms, the central rate pathway is not merely “loans cost more.” Higher interest rates can raise the cost of bank loans, revolving credit, and refinancing. They can also increase the return investors require before funding a project.
A design agency considering new equipment, a manufacturer considering a factory extension, or a software company considering a long hiring runway will compare the expected return on the project with the cost and availability of funding. Higher financing costs make fewer projects pass that test.
This gives you a disciplined annotation for the dashboard’s weak business-investment signal:
Restrictive rates can depress investment by raising financing costs and the required return on capital projects; weak expected demand and uncertainty can reinforce this effect.
Notice the word can. Investment may still rise if expected demand or technological opportunity is sufficiently strong.
The exchange-rate channel: demand and imported inflation
Interest rates can also affect sterling. All else equal, relatively higher UK returns may increase demand for sterling assets and strengthen the currency. A stronger pound makes imported consumer goods, energy, components, and raw materials cheaper in sterling terms; that can reduce imported inflation. It can also make UK exports more expensive to overseas buyers, which can weaken net external demand.
Lower rates may have the opposing tendency: a weaker pound can support price competitiveness for exports but make imports and imported inputs more costly. The outcome is therefore mixed:
| Exchange-rate movement | Potential help | Potential cost |
|---|---|---|
| Stronger sterling | Cheaper imports and lower imported-price pressure | Weaker export competitiveness and potentially lower net external demand |
| Weaker sterling | More competitive exports and potentially stronger external demand | Higher imported consumer and input costs, adding to inflation pressure |
Avoid saying that Bank Rate “sets” the pound. Exchange rates also respond to global interest-rate differentials, risk sentiment, trade expectations, and international capital flows.
3. Fiscal policy: tax and spending work through several routes
Fiscal policy means government decisions on taxes, public spending, and borrowing. The important analytical mistake to avoid is treating all fiscal loosening or tightening as equivalent.
A cut in income tax, an increase in benefits, more spending on public services, and an increase in public investment each allocate money through different parts of the economy. They can therefore have different short-term demand effects and radically different long-term implications.
The Office for Budget Responsibility (OBR) explicitly separates these effects in its forecasting practice.
Dynamic scoring of policy measures in OBR forecasts
Read this OBR explainer to see how fiscal policy is assessed beyond its immediate cost to the Treasury. Its distinction between static and dynamic effects is a strong model for the fiscal portion of your causal map.
Begin with the opening example, from static and dynamic scoring. Follow the corporation-tax example carefully: the direct loss of revenue is distinct from any later effect through investment, productivity, earnings, consumption, and other tax receipts. In “How does the OBR do dynamic scoring?”, read aggregate-demand effects. Then continue from why multipliers differ and study the “OBR fiscal multipliers” table immediately below. Finally, in “In our forecast of the supply side of the economy,” read the supply-side framework. Focus on the three channels: labour supply, capital stock, and total factor productivity.
Tax choices: household demand and business incentives
Taxes affect households and firms through different mechanisms.
An income-tax cut can increase household disposable income. Some of that extra income may be spent, supporting aggregate demand; some may be saved or used to repay debt. An income-tax increase works in the opposite direction. The immediate effect depends on who pays the tax, their propensity to consume, and the wider economic environment.
A corporation-tax change primarily affects firms’ post-tax profitability and the return from investment. The OBR’s example is helpful: a corporation-tax cut can raise post-tax profits, potentially encourage additional investment, add to the capital stock, and subsequently lift productivity, earnings, and consumption. It does not follow that every tax cut pays for itself. The behavioural response must be large enough, and the policy must actually change investment decisions rather than merely raise returns on activity firms would have undertaken anyway.
Other business taxes, allowances, and reliefs can affect the timing, location, or type of investment. Their quality matters as much as their headline cost. A predictable, stable system may support long-lived investment decisions more effectively than a short-lived incentive whose future is uncertain.
Spending choices: demand now, and possibly capacity later
Government spending has at least two analytically distinct roles.
Current spending on public services or welfare transfers can support demand. The spending reaches households, public-sector workers, suppliers, and service users, though part may be saved or spent on imports.
Public investment—for example in transport, energy networks, digital infrastructure, research capacity, or school buildings—also supports demand while projects are being delivered. More importantly, if well selected and implemented, it can raise the economy’s capital stock and enable private-sector activity for years afterwards.
The OBR’s illustrative multipliers show why category matters. For a hypothetical increase worth 1% of GDP, its first-year estimate for public investment is 1.00, compared with 0.45 for public services and 0.33 for tax changes. These are not universal promises that “every £1 creates £1 of GDP.” They are model-based estimates, sensitive to economic conditions, import leakage, and how much recipients save rather than spend.
The OBR also assumes temporary demand effects taper over five years as monetary policy, the exchange rate, and real wages bring output back toward its long-run potential. This yields a crucial rule for your outlook brief:
A fiscal measure that boosts demand is not automatically a measure that raises long-run growth. Durable growth requires a credible improvement in labour supply, capital stock, or productivity.
4. Put monetary and fiscal policy on one causal map
The challenge is that monetary and fiscal policy interact. A government can support household incomes or increase public investment while the Bank of England is trying to reduce inflationary pressure. If fiscal policy adds substantial demand when the economy has little spare capacity, the MPC may judge that interest rates need to be higher than otherwise. That can partially offset the initial stimulus through tighter financial conditions.
The reverse is also possible. A fiscal tightening can weaken demand, potentially reducing inflation pressure, but may also slow near-term growth. Whether this is desirable depends on the inflation outlook, the state of demand, and the composition of the measures.
Use this integrated map as the logic behind your dashboard annotations:
Read this from top to bottom in layers rather than as a prediction that every link will move at once:
- Current inflation and demand conditions inform the MPC’s policy judgement.
- Bank Rate influences broader financial conditions and, potentially, sterling.
- Those financial conditions affect household consumption and business investment; sterling affects external demand and import prices.
- Tax and spending decisions enter in parallel. Taxes can change household disposable income and business incentives; spending can change current demand and, if it is productive investment, future capacity.
- Near-term GDP growth is mainly shaped by demand. Medium-term growth also depends on the capital stock and productivity.
The two boxes that should remain visually separate in your one-page brief are near-term GDP growth and potential output. Strong current demand can increase GDP without solving the productivity problem. Equally, investment in infrastructure or innovation may have a modest immediate effect while improving conditions for later growth.
5. Add policy annotations to your dashboard
Your original dashboard is the evidence panel. Add a narrow column headed “Transmission interpretation” or place numbered callouts beside the relevant indicators.
Here is a concise model using the evidence you already assembled.
| Dashboard evidence | Causal-map annotation | What not to infer |
|---|---|---|
| CPI inflation at 2.8%, core CPI at 2.6%, both easing | Easing price pressure may reduce the need for further monetary tightening if the MPC expects inflation to return sustainably to target. | Inflation below its previous peak does not automatically mean rates should fall, or that prices have returned to earlier levels. |
| Positive but slowing real-pay growth; regular nominal pay growth easing | Lower inflation supports real income, while slower pay growth can reduce domestic inflation persistence. Household spending also depends on debt costs, employment, and confidence. | Slower wage growth is not unambiguously good: it can reflect weaker labour demand. |
| Payrolled employment and vacancies falling; unemployment higher | A cooling labour market can weaken household demand and reduce wage pressure, reinforcing disinflation. | Labour-market weakness alone does not establish the cause; it may reflect rates, demand, productivity, or sectoral change. |
| Business investment up quarter on quarter but down year on year; intentions cautious | High financing costs and uncertainty can raise the hurdle for capital projects, constraining investment and future productive capacity. | The Bank Rate is not the sole explanation for investment weakness. |
| Output per hour above 2019 but subdued relative to older trends | Persistent weak investment can constrain capital deepening and productivity, limiting potential output growth. Productive public investment or credible private-investment incentives could improve this channel. | A single quarter’s productivity move identifies a durable structural change. |
A compact policy-map footer for the brief
Add a short statement below the table:
Policy transmission: Inflation and domestic cost pressures shape the MPC’s Bank Rate decisions. Bank Rate affects household debt servicing, saving incentives, firms’ financing costs, asset prices, confidence, sterling, and imported prices, with variable lags. Fiscal choices affect demand through disposable income and public expenditure; their durable growth effect depends on whether they raise labour supply, the capital stock, or productivity.
This is broad enough to remain true as data change, but specific enough to guide your forecast reasoning.
A practical visual-design rule
Use solid lines in your own map for the direct and well-established relationships—such as Bank Rate influencing bank lending rates, or public investment adding to the public capital stock. Use dashed lines for conditional pathways—such as a corporation-tax change inducing additional investment, or a rate change moving sterling. This visually prevents the common analytical error of presenting contingent responses as certainties.
Also label time horizons:
- Near term: household consumption, financing conditions, current demand, inflationary pressure.
- Medium term: business investment, employment, capital formation.
- Long term: productivity, potential output, sustainable real-income growth.
Key takeaways
Your dashboard can now show not only the UK economy’s current condition but also the mechanisms that may change it.
- The Bank of England uses Bank Rate to influence inflation primarily through borrowing costs, saving incentives, spending, investment, confidence, asset prices, sterling, and import prices.
- Higher rates can cool inflation by reducing demand, but they can also restrain near-term GDP growth and business investment.
- Fiscal policy is not one instrument: taxes, welfare, public services, and public investment have different demand effects and different potential effects on long-run capacity.
- Distinguish a temporary fiscal boost to demand from a durable increase in potential output through labour supply, capital stock, or productivity.
- Annotate the dashboard with conditional claims. The current evidence is consistent with easing inflation alongside weak investment and a cooling labour market; it does not prove a single cause.
Next, you will investigate the deeper structural side of the map: why UK productivity and business investment have been weak, and how to rank the competing explanations using evidence rather than headlines.
Can't find a good explanation? Sign up and we'll make it for you
Sign up