
Hello. In the previous lesson, you learned to move a single cash flow through time using compounding and discounting. Now we shift from a projected return to a return you can measure from an actual investment experience.
When you own an investment, your result does not come only from whether its quoted price rose or fell. You may receive dividends or interest, and you may pay commissions, advisory charges, or other fees. This lesson develops one complete measure that incorporates all three: the holding-period return.
The complete picture: what did the investment pay you?
A holding period is simply the time from when you acquire an investment to a chosen ending date. It could be a week, six months, or several years.
Your holding-period return (HPR), also called total return for that period, asks:
Relative to the cash I committed at the start, how much did I gain or lose after price changes, investment income, and fees?
For a basic investment with no additional deposits or withdrawals, the core formula is:
where:
- is your beginning cost: the cash actually committed when you bought the investment, including purchase fees.
- is the ending net value: what the investment is worth at the end, after any selling cost if you sold it.
- is income received during the holding period, such as dividends from stock or interest from a bond.
A positive result is a gain; a negative result is a loss.
For example, if you spend USD 1,000 to purchase an investment, later own an asset worth USD 1,060, and receive USD 20 in dividends, then the total gain is USD 80. The holding-period return is:
That has two possible sources:
- Price return, sometimes called capital gain or loss: the investment became worth more or less.
- Income return: cash distributions such as dividends or interest.
Fees reduce the return you get to keep.
Calculating Your Investment Returns
Read FINRA's “Calculating Your Investment Returns” for a practical U.S. stock example that includes both commissions and dividends. Notice that a price increase alone is not the investor's full economic return.
In the “Calculating Return on Investment” section, begin with the paragraph beginning “The first step in calculating ROI...” and read the FINRA worked example. Follow how the initial share purchase, commissions, sale proceeds, and dividends enter one calculation. Stop before the subsection “Calculating Annualized Returns”; annualizing is the focus of the next lesson.
A formula that makes fees visible
For an investment in shares, a more detailed version of the calculation is:
where:
- is the purchase price per share.
- is the ending or sale price per share.
- is total dividends or interest received.
- is the purchase fee.
- is the sale fee.
- is any separately paid management or advisory fee during the holding period.
This can look more complicated than it is. The numerator is just your net dollar gain:
| Component | Effect on your return |
|---|---|
| Increase in market value | Adds |
| Dividends or interest | Adds |
| Purchase fee | Subtracts |
| Sale fee | Subtracts |
| Separately charged ongoing fee | Subtracts |
The denominator is the amount you actually put at risk at the beginning: purchase price plus the purchase fee.
A useful cash-flow check
You can also calculate exactly the same return without memorizing the expanded formula:
- Find the cash paid at purchase, including the purchase fee.
- Find the net sale proceeds or ending market value.
- Add income received during the period.
- Subtract the initial cost from the total payoff.
- Divide the net gain or loss by the initial cost.
This version is often safer because it mirrors the cash movements in a brokerage account.
Worked example: stock return after dividends and trading fees
Suppose you buy 50 shares of a U.S. company at USD 40 per share. Your broker charges a USD 5 purchase commission. Six months later, the stock is worth USD 47 per share. You sell all shares and pay another USD 5 commission. During the six months, you received USD 60 in cash dividends.
Step 1: Determine the all-in purchase cost
The share purchase costs:
Including the purchase commission:
Your initial investment is USD 2,005, not USD 2,000.
Step 2: Determine ending net value
The gross value of the shares when sold is:
After the USD 5 selling commission:
Step 3: Add cash income
You also received:
So the total value you received from the investment is:
Step 4: Calculate the net gain and holding-period return
The investment earned a 19.95% total holding-period return over six months.
It is useful to reconcile that result by source:
| Return component | Calculation | Dollar amount |
|---|---|---|
| Price gain | USD 350 | |
| Dividend income | Given | USD 60 |
| Purchase commission | Given | USD |
| Sale commission | Given | USD |
| Net gain | USD 400 |
The stock’s price increase generated most of the return, but dividends added USD 60. The two commissions reduced the investor’s gain by USD 10.
If you had ignored all fees, you might have reported:
That is not the return actually earned after transaction costs. The difference may appear modest in one trade, but recurring fees and repeated transactions can materially affect longer-term results.
Income must be counted once, not twice
The basic holding-period-return formula assumes you handle dividends or interest consistently.
When income is paid out in cash
If a dividend is paid to your brokerage cash balance and remains separate from the investment, add it as .
For instance, if you still own the shares at the ending date, use:
- Current market value of the shares, plus
- Dividends received as cash.
When income is reinvested
If dividends are automatically reinvested to buy additional shares, your ending portfolio value already includes the value of those additional shares. In that case, do not add the reinvested dividend again as separate income.
The principle is straightforward: every dollar of value should appear once in the calculation.
This distinction matters when you view a fund’s “total return” chart. A return series labelled “with dividends reinvested” generally already incorporates the dividend effect. Adding dividends again would overstate performance.
Why small annual fees become large over time
A one-time commission reduces return once. An annual management fee reduces the amount left to compound every year. That is why ongoing fees require attention even when the percentage looks small.
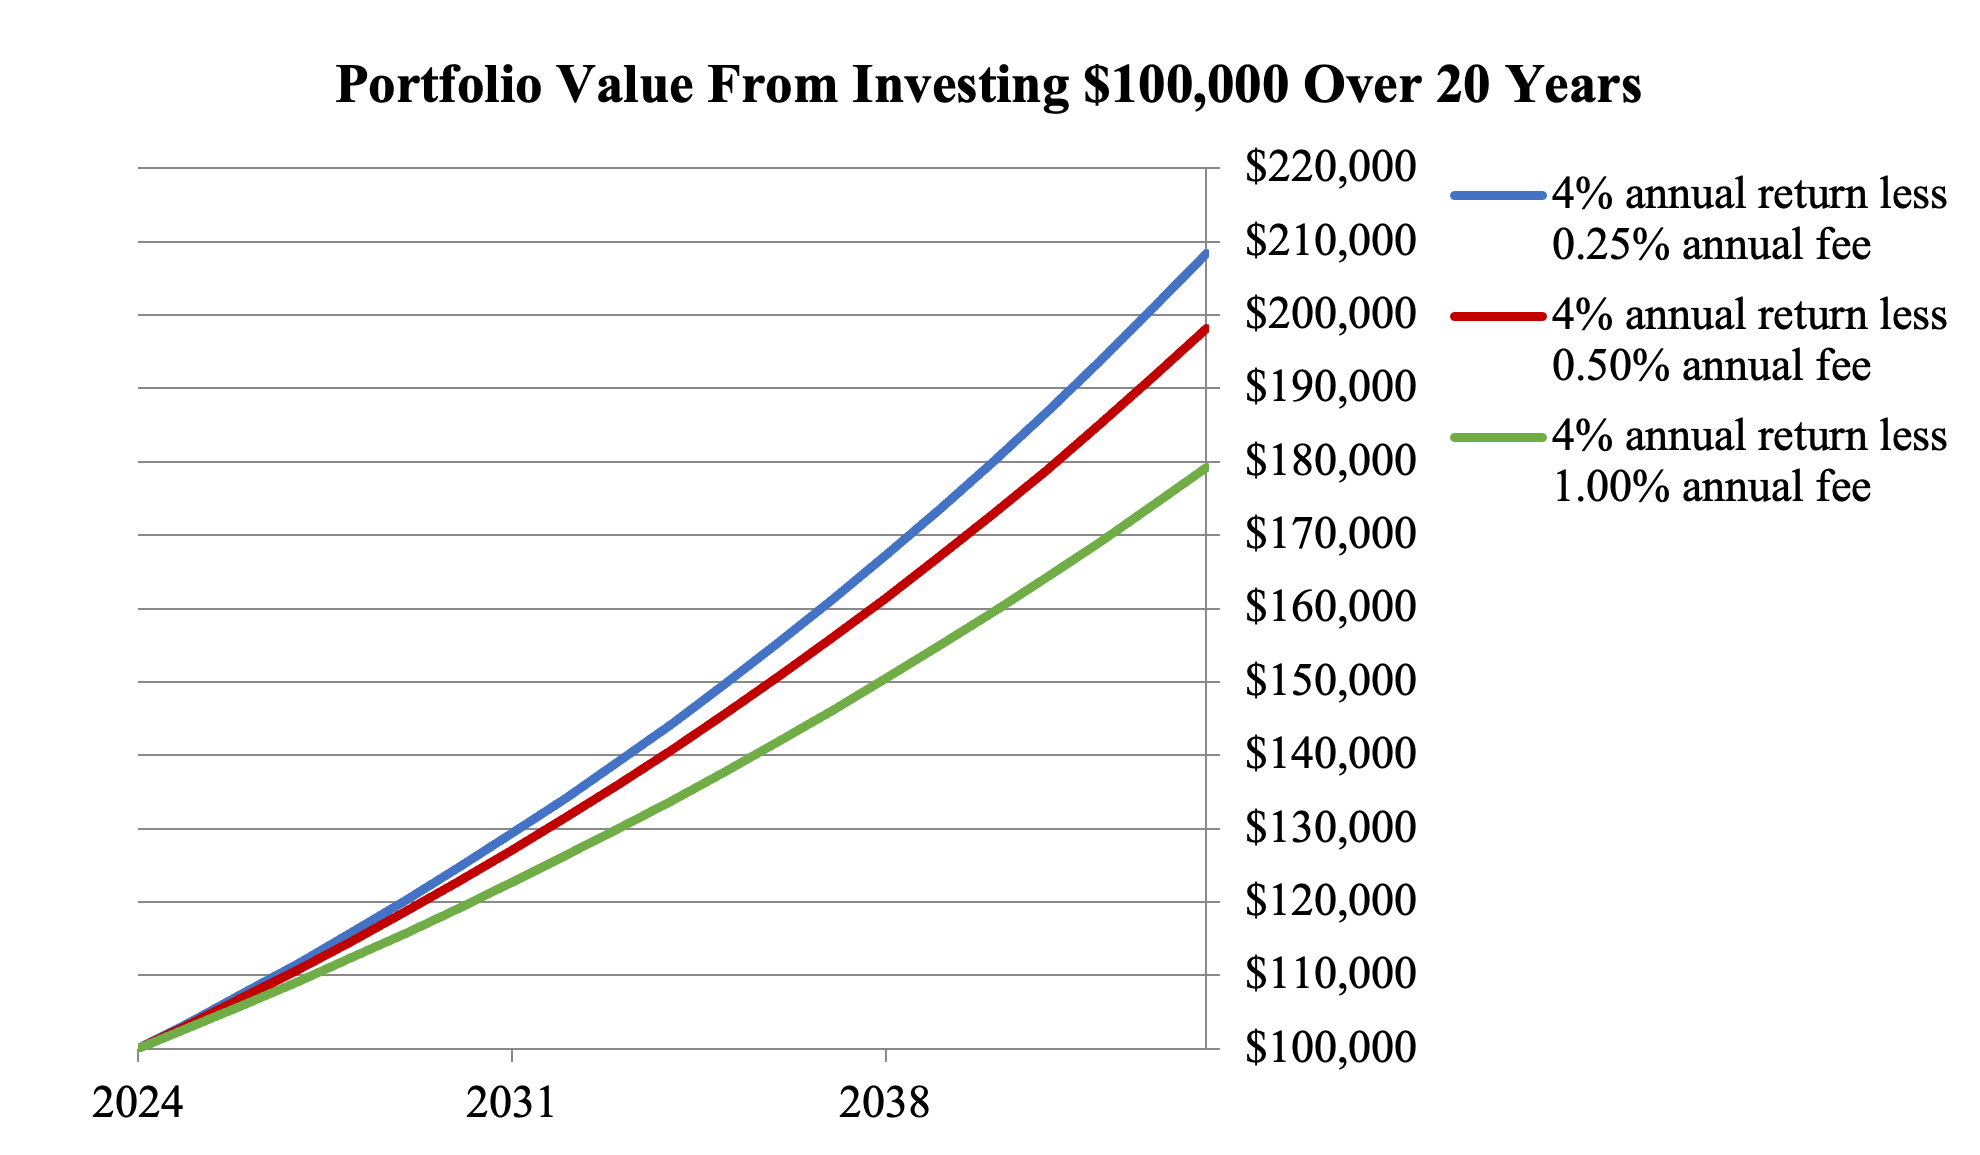
The chart uses a simplified presentation: it treats the annual fee as reducing the annual return. Over 20 years, the portfolio with a annual fee reaches roughly USD 209,000, while the portfolio with a annual fee reaches roughly USD 181,000. The difference is around USD 28,000 despite a fee gap of only per year.
When calculating a return from actual account values, apply this rule:
- If an advisory or account fee was charged separately, subtract it.
- If a mutual fund or ETF’s reported net asset value already reflects its expense ratio, do not subtract that expense ratio again.
- If you are given a return explicitly described as “net of fees,” treat the stated fee effect as already included.
The goal is not to subtract every fee you can find. It is to make sure each fee is counted once.
A repeatable spreadsheet layout
For simple investments, use a worksheet that records the source data before calculating the percentage. This makes the calculation auditable and helps prevent omissions.
| Input | Example |
|---|---|
| Number of shares, | 50 |
| Purchase price, | USD 40 |
| Purchase fee, | USD 5 |
| Ending or sale price, | USD 47 |
| Sale fee, | USD 5 |
| Cash dividends or interest, | USD 60 |
| Separately paid ongoing fees, | USD 0 |
If those values are in cells A2:G2 in that order, an Excel or Google Sheets formula is:
=((A2*(D2-B2))+F2-C2-E2-G2)/(A2*B2+C2)
Format the result cell as a percentage. The formula calculates the gain from the price change, adds income, subtracts fees, and divides by the initial all-in cost.
Before relying on any result, check three things:
- Units: Are dividends given per share or as a total? Convert per-share dividends to total dividends by multiplying by shares owned.
- Timing: Does the result cover one month, six months, or three years? Holding-period return describes the whole stated period.
- Double counting: Is an income payment already reflected in ending value? Is a fee already embedded in a quoted net return or account balance?
Taxes are deliberately outside this lesson’s basic calculation. They are very important in real U.S. investing, but you should first be able to distinguish a pre-tax total return from a price-only return.
Key takeaways
Holding-period return measures the gain or loss from an investment over a defined period, relative to the cash committed at the start.
A complete result includes:
- Price change, whether positive or negative;
- Income, including dividends or interest;
- Fees, including trading costs and separately charged ongoing costs.
Report the period alongside the percentage: “a 19.95% holding-period return over six months” is meaningful; “a 19.95% return” is incomplete.
Next, you will convert a multi-year holding-period return into an annualized compound return, allowing investments held for different lengths of time to be compared more fairly.
Can't find a good explanation? Sign up and we'll make it for you
Sign up