In our previous lesson, we moved from the theory of server-side tracking to its practical implementation, outlining how to send conversion data directly from your backend to Meta and Google Analytics. This established a robust foundation for accurate data collection. However, as with any technical system, what can be built can also break.
This lesson marks the final step in our foundational module on web tracking. Our objective is to equip you with the skills to debug tracking implementations using browser developer tools and platform-specific testing utilities. Your experience as a developer gives you a significant advantage here, as we'll be diving into the same diagnostic tools used in web development to trace data flow, inspect network requests, and validate code execution. We will explore the universal "source of truth"—the browser's own tools—before examining the specialized debuggers provided by Meta and Google.
1. The Source of Truth: Browser Developer Tools
No matter what a tag manager's interface or a platform's helper extension tells you, the ultimate proof of what your website is sending lies within the browser's own developer tools. These tools are the ground truth for all client-side activity.
The renowned analytics expert Simo Ahava has written an exceptional guide on this topic. It's detailed and perfectly suited for someone who appreciates a deep, technical understanding. We'll use it as our primary reference for this section.
Debug Guide For Web Analytics And Tag Management
This guide provides a comprehensive walkthrough of the essential browser developer tools for debugging analytics. We'll focus on the three most critical panels for our purposes.
Please read the following sections from Simo Ahava's guide: Start with the introductory section, Browser developer tools, for an overview of the key panels. Next, focus on the Network debugger section. This is the most important part for tracking validation, as it shows the raw HTTP requests. Then, read the JavaScript console section to understand how to spot script errors and inspect variables. Finally, review the Application storage section to see how to inspect cookies and other stored data.
Let's synthesize what you've just read into a practical framework.
The Network Tab: The Ultimate Verifier
As Simo's guide emphasizes, the Network tab is where the truth lies. If a request doesn't appear here, the browser never sent it. When debugging tracking pixels, this is your first and last stop for client-side validation.
- Filtering: To isolate tracking hits, use the filter bar. Common filters are:
collectfor Google Analytics requests.facebook.com/tr/for Meta Pixel requests.gtm.jsfor the Google Tag Manager container itself.
- Inspecting the Payload: Clicking on a request reveals its details. The Payload (for POST requests) or Query String Parameters (for GET requests) section shows you the exact data sent to the tracking server. This is the client-side equivalent of the JSON payloads we constructed for server-side APIs in the last lesson. You can verify here if your
event_name,value,currency, and custom parameters are being sent correctly. - Checking the Status: A
200 OKor204 No Contentstatus code means the server received the request successfully. A red status like403 Forbiddenor404 Not Foundindicates a configuration or permission error, while a(failed)status might point to a network issue, ad blocker, or incorrect endpoint.
For a deeper dive into the network tab from a backend and networking perspective, the following video provides an excellent breakdown. It explains concepts like TCP connections and HTTP protocols, which directly relate to your interests in networking.
Demystifying the Browser Networking Tab in Developer Tools With Examples
This video demystifies the Network tab, focusing on the underlying network behavior. It complements Simo's guide by adding a layer of networking context.
Please watch from the beginning until the introduction of the various columns. Then, pay close attention to the example starting at nginx.org. The presenter does a fantastic job of identifying the various tracking pixels (Google, Facebook, etc.) as they appear in the network log, explaining the redirects and different protocols used.
The Console and Application Tabs
- Console: This is your first stop for JavaScript errors. A misconfigured custom script or a conflict between two libraries will often throw a red error message here, immediately pointing you to the problem. Tools like the official GA Debugger extension also print verbose logs to the console.
- Application: This tab allows you to inspect browser storage. For tracking, this is primarily used for inspecting cookies. You can search for
_gato find the Google Analytics client ID cookie or_fbpfor the Meta Pixel's browser ID cookie. You can see their value, domain, and expiration, which is crucial for debugging issues related to user identification and persistence.
2. Platform-Specific Debugging Tools
While browser developer tools are powerful, they are also generic. Both Meta and Google provide specialized utilities that make debugging their specific implementations much more straightforward.
Meta Pixel Helper
For Meta Pixel, the primary tool is a browser extension called Meta Pixel Helper. It overlays a simple UI on top of the raw network requests, making it easy to see which events have fired and if they were successful.
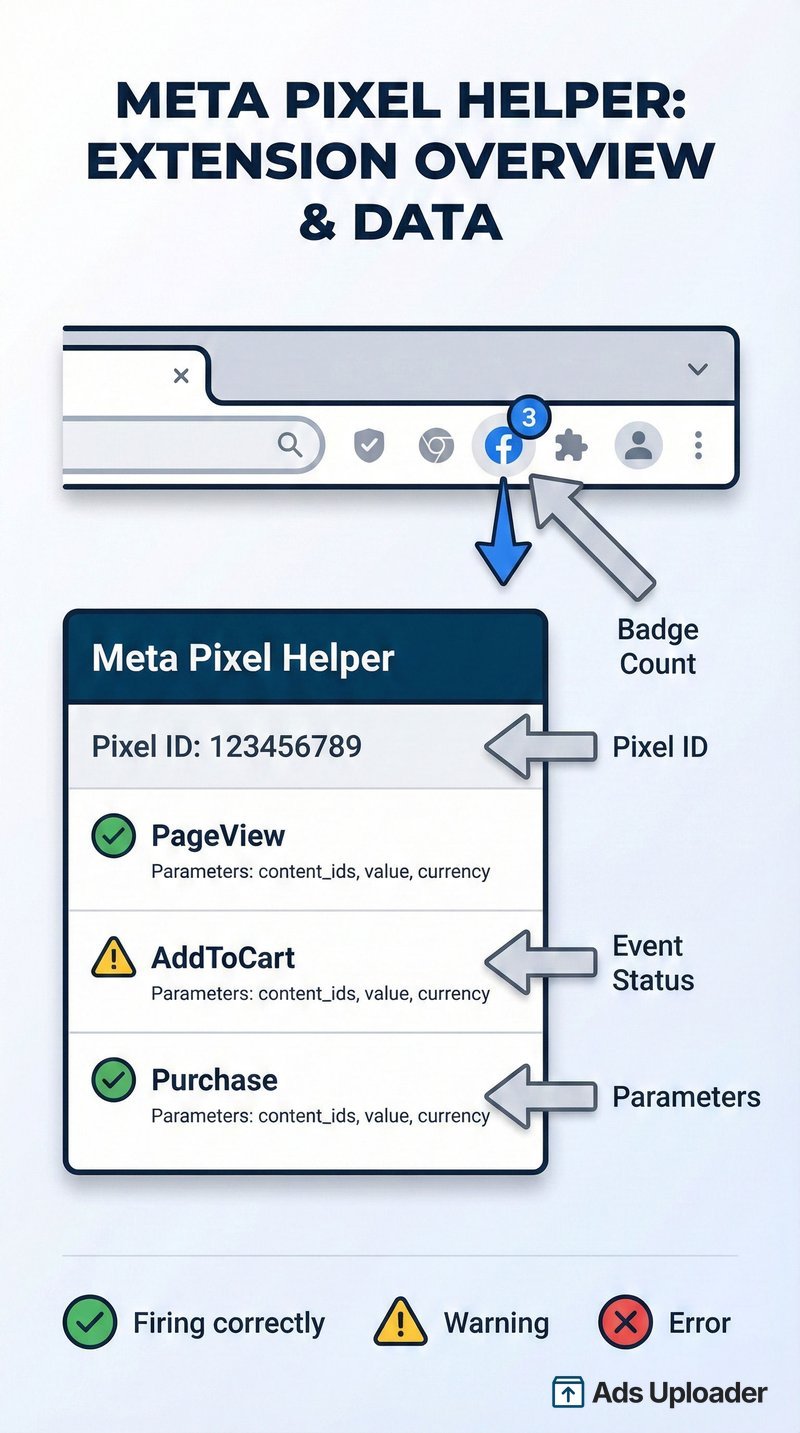
When you click the extension's icon, it shows a list of detected events like PageView, AddToCart, or Purchase. You can click on any event to see the parameters sent with it, such as content_ids, value, and currency. A green checkmark indicates success, while a yellow or red icon signals an issue, with a brief explanation of the problem. It's an excellent first-line-of-defense tool.
Google Analytics 4: DebugView
GA4's primary debugging tool is much more integrated and powerful. It's called DebugView, and it provides a real-time stream of all events, parameters, and user properties from a single, designated test device.

The following guide offers a thorough explanation of how to use DebugView.
GA4 DebugView Guide: Setup, Troubleshooting & Best ...
This guide is a complete reference for using DebugView, from activation to interpretation.
Please read the following sections: Why DebugView Matters: Understand the problem it solves. DebugView vs Realtime Reports: Learn the crucial distinction between testing and monitoring. How Debug Mode Works: A quick look at the underlying mechanism. Setting Up for Websites: Review the three primary activation methods. Understanding the Interface: Learn how to read the event stream and other panels.
To summarize the key points:
- Purpose: DebugView is for validating your implementation on a single device, not for monitoring overall site traffic (that's what the Realtime report is for).
- Activation: You must enable "debug mode" for your browser session. The recommended way is by using Google Tag Manager's Preview mode. Alternatively, you can use the Google Analytics Debugger Chrome extension.
- Usage: Once active, go to Admin > DebugView in your GA4 property. As you navigate your site and trigger events, they will appear in the central stream. You can click on any event to inspect the parameters that were sent with it, and the panel on the right will show the current state of all user properties for your device. This is invaluable for verifying that custom dimensions and user-scoped data are being set correctly.
3. A Systematic Debugging Workflow
Having the right tools is only half the battle; using them in a logical sequence is what solves problems efficiently. Here is a workflow that combines everything we've discussed.
Let's say you've implemented a generate_lead event, but it's not showing up in your reports.
-
Tag Firing Check:
- Enable GTM Preview Mode and perform the lead generation action on your site.
- In the Tag Assistant window, does your
generate_leadtag appear under "Tags Fired"? - If no, investigate the trigger conditions. The video from Analytics Mania we will look at next has a great walkthrough of this.
- If yes, proceed to the next step. "Fired" does not mean "successful".
-
Data Reception Check (Platform Tools):
- With debug mode still active, open GA4's DebugView.
- Does the
generate_leadevent appear in the stream? - Click on it. Are all the parameters you expect (e.g.,
form_id,lead_value) present and correct? - For Meta, you'd use the Meta Pixel Helper extension or the "Test Events" tool in Events Manager (which we discussed in the previous lesson for CAPI) to do the same check.
-
Data Transmission Check (Network Tab):
- If the data doesn't appear in DebugView or Pixel Helper, it's time for the ultimate source of truth.
- Open the browser's Developer Tools and go to the Network tab.
- Filter for
collect(for GA) orfacebook.com/tr/(for Meta). - Did a request get sent when you generated the lead?
- No Request: An ad blocker, privacy setting, or a fundamental script error is likely preventing the request from even being dispatched. Check the Console for errors.
- Request Sent: Check the status code. If it's green (
200/204), the server received it. If it's red, the request failed. Inspect the payload to ensure it's not malformed. A malformed request might be received but then rejected by the platform, so it wouldn't show in DebugView.
This video from Analytics Mania provides excellent tips that reinforce this workflow, highlighting the common pitfalls.
5 debugging tips for Google Tag Manager || How to debug and test Google Tag Manager
This video offers five practical debugging tips for Google Tag Manager, many of which align perfectly with the workflow we've just outlined.
Please watch these three key sections: The first tip ("fired" doesn't mean successful) perfectly demonstrates using the Network tab and DebugView to confirm data delivery. The next tips (on using the event stream) show how to dive into the GTM preview mode itself to see why a tag fired (or didn't fire) and how to check the actual variable values being sent. Finally, review the segment on useful Chrome extensions, which introduces several powerful community-built tools that can make your life easier.
Conclusion
You have now completed the foundational module on web tracking. By mastering these debugging techniques, you've gained a critical skill that separates novice marketers from technical experts: the ability to independently verify and guarantee data integrity.
Key Takeaways:
- Systematic Workflow: Approach debugging systematically: check if the tag fired, if the platform received it, and if the browser sent it.
- Browser Dev Tools are Truth: The Network tab is the ultimate verifier for all client-side requests. The Console is your first stop for script errors, and the Application tab is for inspecting storage like cookies.
- Use Platform-Specific Helpers: GA4's DebugView and the Meta Pixel Helper provide user-friendly, real-time interfaces to validate that events and their parameters are being received correctly.
- "Fired" is Not "Succeeded": A tag firing in a tag manager only means the trigger conditions were met. You must always verify data reception at the destination platform.
With a solid understanding of how to collect and validate tracking data, we are now ready to shift our focus. In the next module, CRM and Pipeline Architecture, we will begin exploring how to structure and utilize this data to manage customer relationships and sales processes. We'll start by analyzing the core data models that power modern CRMs.