
Good to see you again. In the previous lesson, you turned a market idea into a paper-trade order plan: you chose an instrument deliberately, selected an order type, and accounted for spread, commission, slippage, and currency conversion.
Now you will build the workspace that makes those plans repeatable. The goal is not to make TradingView visually impressive; it is to make it operationally reliable. By the end, you will have a compact cross-asset watchlist, a reusable research chart layout, one or two review alerts, and a clearly identified GBP paper-trading account.
Think of the workspace as a small system:
- The watchlist is your curated input universe.
- The chart layout is the reusable view applied to each input.
- An alert is an event notification that tells you to inspect something.
- The paper account is the test environment for planned execution.
None of these components tells you whether to buy or sell. They make your later analysis and practice less error-prone.
Build a watchlist for observation, not prediction
A beginner watchlist often fails in one of two ways:
- It is too broad: dozens of symbols, no clear reason for including them.
- It is too narrow: a handful of popular technology shares, which hides how differently markets can behave.
Your first list should be a small cross-asset dashboard. Its purpose is to let you observe different trading hours, currencies, volatility patterns, and exposure structures without constantly searching for symbols.
Create one primary list called:
Core Cross-Asset Practice
Within it, create sections rather than separate lists. This keeps your first workflow simple; you can later create focused lists for a sector, a company-research shortlist, or paper-trade candidates.
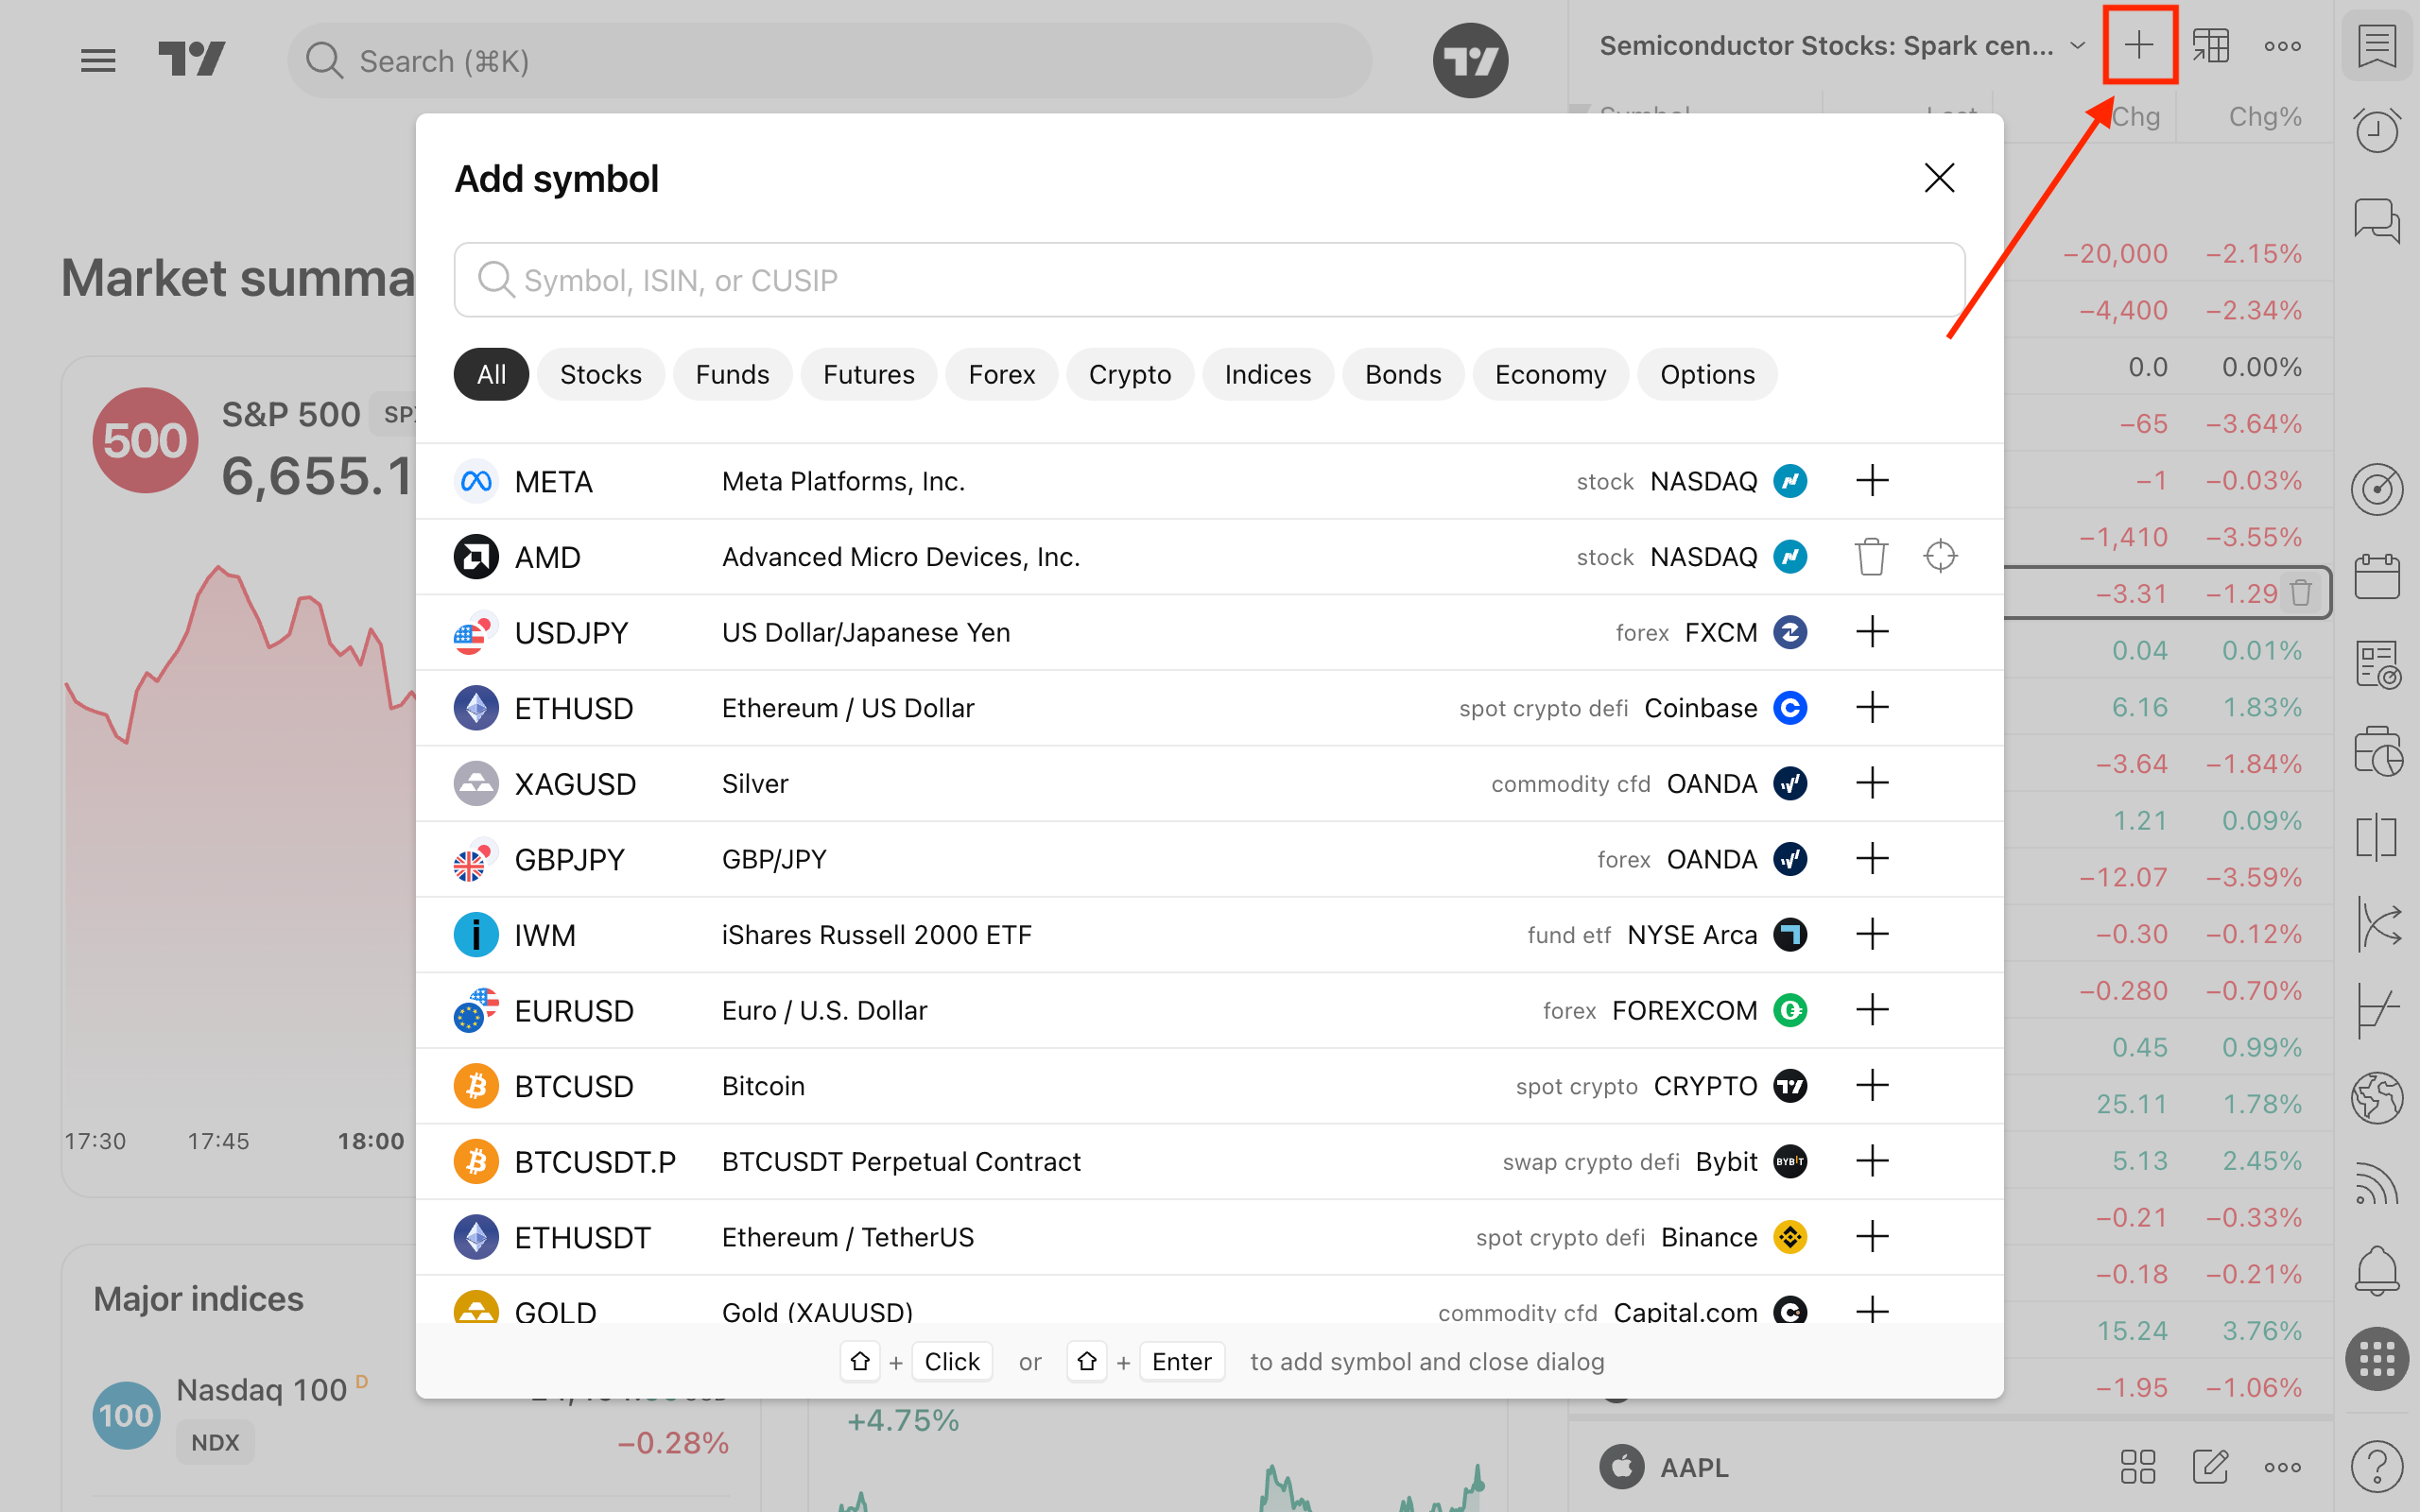
Use the right-side Watchlist panel and its + control to find symbols. The search result is part of the analysis: check the exchange or data provider, instrument type, and quoted currency before adding anything. Do not select the first matching ticker merely because its short code looks familiar.
Mastering the TradingView watchlists
Read TradingView Support’s “Mastering the TradingView watchlists” to see the panel workflow for adding, grouping, and displaying instruments. Focus on the difference between adding a symbol and organizing it into a usable monitoring list.
In the “Setting up your watchlist” section, begin with the sentence “The first thing to do with watchlists is to add symbols for your analysis.” Read the symbol-addition workflow, including the instructions to use the asset-type filter and inspect the result before selecting it. Then continue from “Symbols will appear at the bottom of your watchlist.” through the organization guidance. In the later “Watchlists show key metrics” material, find the three-dot menu and note how to add, remove, and sort columns.
A practical starter universe
Use the following as a design specification rather than a list of trade recommendations. Keep it to roughly 8–10 instruments at first.
| Watchlist section | What to include | Why it belongs there |
|---|---|---|
| Market context | A broad US equity index, a broad UK equity index, and | Gives context for US and UK shares and keeps currency exposure visible |
| US shares | Two US-listed companies from different sectors | Later supports company-fundamental and chart-analysis practice |
| UK shares | Two ordinary shares listed on the London Stock Exchange | Lets you work with GBP quotation, UK market hours, and UK company reporting |
| Commodity exposure | One clearly identified gold exposure product, such as a US gold ETF, plus optionally a UK-listed commodity ETC | Reinforces that exchange-traded exposure is not identical to owning physical metal |
| Major crypto | One spot pair and one spot pair from a named venue | Provides a continuous, high-volatility market for comparison, without assuming leverage |
For the shares, choose companies whose businesses you can explain in a sentence. A broad technology name, a consumer company, a healthcare company, or an industrial company will do. You will return to these names in the fundamental-analysis module, so familiarity is more useful than novelty.
For crypto, be precise about the quote currency:
- is priced in US dollars.
- is priced in a stablecoin, not literally US dollars.
- The same asset can show different prices and volumes across venues.
For commodity exposure, be equally precise. A gold ETF or ETC is an exchange-traded product with its own structure, fees, currency, and listing venue. It is not interchangeable with spot gold, a futures contract, or a leveraged CFD.
Suggested section labels
Use clear labels that encode meaning:
- 01 — Market Context
- 02 — US Shares
- 03 — UK Shares
- 04 — Commodity Exposure
- 05 — Crypto Spot
The numeric prefixes are optional, but they keep the sections in a predictable order. This becomes valuable when the list grows.
Choose columns that support decisions later
Start with a restrained set of watchlist columns:
- Symbol and description
- Last price
- Percentage change
- Volume, where available
- Market capitalization for shares, where available
- A simple color flag or note field, if you use one
Do not interpret a large daily percentage move as a signal by itself. A move in a crypto pair, a small-cap share, and a broad equity index has very different meaning. At this stage, the column is a prompt to inspect the chart and context, not an instruction to trade.
A useful convention is to reserve color flags for workflow state, not opinion:
| Flag | Meaning |
|---|---|
| Green | Worth reviewing in the next scheduled session |
| Yellow | Research required: instrument details, earnings date, or news context unclear |
| Red | Do not paper trade yet: event risk, unusual spread, or unsuitable product |
| No flag | Passive market observation |
This is analogous to keeping application state explicit: a flag should describe what needs to happen next, not hide a vague judgment such as “looks bullish.”
Create one reusable research layout
A layout stores the workspace around a chart: its visual appearance, settings, interval, enabled information, and often the latest symbol you viewed. It is not a fixed chart for one ticker.
That distinction matters. A layout named “US Stocks” can still reopen on a crypto pair if that was the last symbol viewed when it was saved. Name layouts for their purpose, not for the temporary ticker on screen.
For the next modules, create this layout:
Research | Daily | Cross-Asset
Use a daily interval as the default because it is suitable for broad market observation and will support the upcoming lessons on financial statements, chart structure, and candlesticks. It does not commit you to long-term investing; it simply prevents a first workspace from becoming dominated by short-term price noise.
Create, Manage, and Save Chart Layouts: Full Demonstration
Watch TradingView’s “Create, Manage, and Save Chart Layouts: Full Demonstration” for a visual walkthrough of creating, naming, saving, and using purpose-specific layouts. Its examples use different trading horizons, but the workflow applies directly to your research and paper-trading layouts.
Watch layout basics to see where the Manage Layouts control is and what a layout retains. Then watch a purpose-specific layout, focusing on naming a layout after its intended use and saving its chart settings. Continue with the saved-symbol caveat: layouts retain the last symbol visited, so a layout name does not lock a chart to a particular ticker. Finish with watchlist scanning, which demonstrates how one layout can be applied quickly across several symbols.
Configure the research layout deliberately
Open Manage layouts on the upper toolbar, create a new layout, and give it the name above. Then make the following settings.
| Element | Starting setting | Reason |
|---|---|---|
| Chart type | Candlesticks | You will soon study OHLCV and candlestick structure |
| Default interval | 1 day | Useful common view across shares, commodity products, and crypto |
| Price scale | Regular at first | Keeps absolute price levels straightforward while you learn support and resistance |
| Status line | Show OHLC and volume | Makes the bar’s price data visible without opening extra panels |
| Volume | Add a basic volume display | Lets you observe participation without yet treating volume as a signal |
| Corporate events | Enable earnings, dividends, and splits for shares | Prevents later surprise when a chart changes around a corporate event |
| Trading controls | Disable in this research layout | Reduces the chance of confusing analysis with execution |
| Visual style | High contrast, uncluttered grid, readable text | Supports repeated inspection and annotation |
The important choice is not the exact color scheme. It is that you can open any symbol from the watchlist and see it through the same visual and informational lens.
TradingView also allows logarithmic scales. You will use these more intentionally later when comparing large percentage moves over long periods. For now, do not alternate casually between regular and logarithmic scales while marking price levels. A support or resistance area that looks reasonable on one scale can look different on another.
Save, then test reusability
After configuring the layout, save it. On Windows, the usual shortcut is Ctrl+S; on macOS, it is Cmd+S.
Then test the layout:
- Open a US share from the watchlist.
- Confirm that candles, volume, interval, and your display choices appear as expected.
- Switch to a UK share, then to a commodity product, then to a crypto pair.
- Confirm that the layout settings remain stable while the symbol data changes.
- Save again after the test.
The layout should make comparisons easier, not make every market appear identical. A daily crypto chart remains a 24-hour market; a UK share remains subject to London market hours; a US ETF remains an exchange-traded product. The standardized view helps you notice those differences.
Keep drawings tied to the symbol
When you later draw support zones, trend lines, or notes, they should belong to the relevant symbol. Do not expect a line drawn on a US share to make sense when you switch to gold or Bitcoin.
TradingView can synchronize drawings across layouts for the same symbol. That can be useful once you have separate research and paper-trading layouts, but use it cautiously. For now, the principle is simple:
A layout is reusable configuration; a drawing is symbol-specific analysis.
Add alerts that request review, not action
An alert should answer one question:
“Under what observable condition do I want to look at this chart again?”
It should not say, “Buy when this happens.” You have not yet learned enough about trend, market structure, confirmation, or risk placement to delegate a trading decision to an alert.
Create one initial review alert on a symbol you already track. For example, on a daily chart you might place a horizontal line at a recent, visually obvious price level and configure an alert for price crossing that level.
A sensible alert specification is:
| Field | Example policy |
|---|---|
| Symbol | The exact exchange or venue-specific symbol you inspected |
| Condition | Price crossing a specified level |
| Frequency | Once per bar close when using a daily-chart review process |
| Expiration | A fixed date, such as two weeks from now |
| Notification | Desktop or mobile notification, plus email only if you will actually read it |
| Name | `Review |
| Intended response | Open the chart, inspect context, and decide whether further analysis is needed |
The phrase once per bar close is important for a daily-chart workflow. During a day, price may cross a level and then reverse before the daily candle closes. A close-based notification reduces this intraday noise, but it also means you learn about the condition later. That delay is not a flaw; it is part of choosing a timeframe.
To configure it, use TradingView’s Alert control or create an alert from a marked price level on the chart. Select the exact symbol, set the condition and level, choose the notification method, set an expiration, and give the alert a descriptive name.
Avoid these common alert mistakes:
- Duplicating alerts on the same level without noticing.
- Leaving expired ideas active for months.
- Using vague names, such as “BTC alert.”
- Treating the notification as confirmation rather than an invitation to review.
- Using alerts on a different provider’s symbol from the one you actually intend to analyse.
At the end of each week, audit active alerts. Delete levels that are no longer meaningful and keep only alerts connected to a current observation or written plan.
Create a distinct Paper Trading layout and account
Your research layout should be calm and analytical. Your paper-trading layout should make execution information visible. Keep them separate.
Create a copy of the research layout and rename it:
Paper Practice | Daily | GBP
In this second layout, enable the Trading settings you need to see:
- Buy and sell controls
- Open-position display
- Order and execution markers
- Account information
- Paper Trading panel access
The point is not to click these controls frequently. It is to make the simulated order, position, and account state visible when you practise the order plans introduced last lesson.
Connect the Paper Trading account
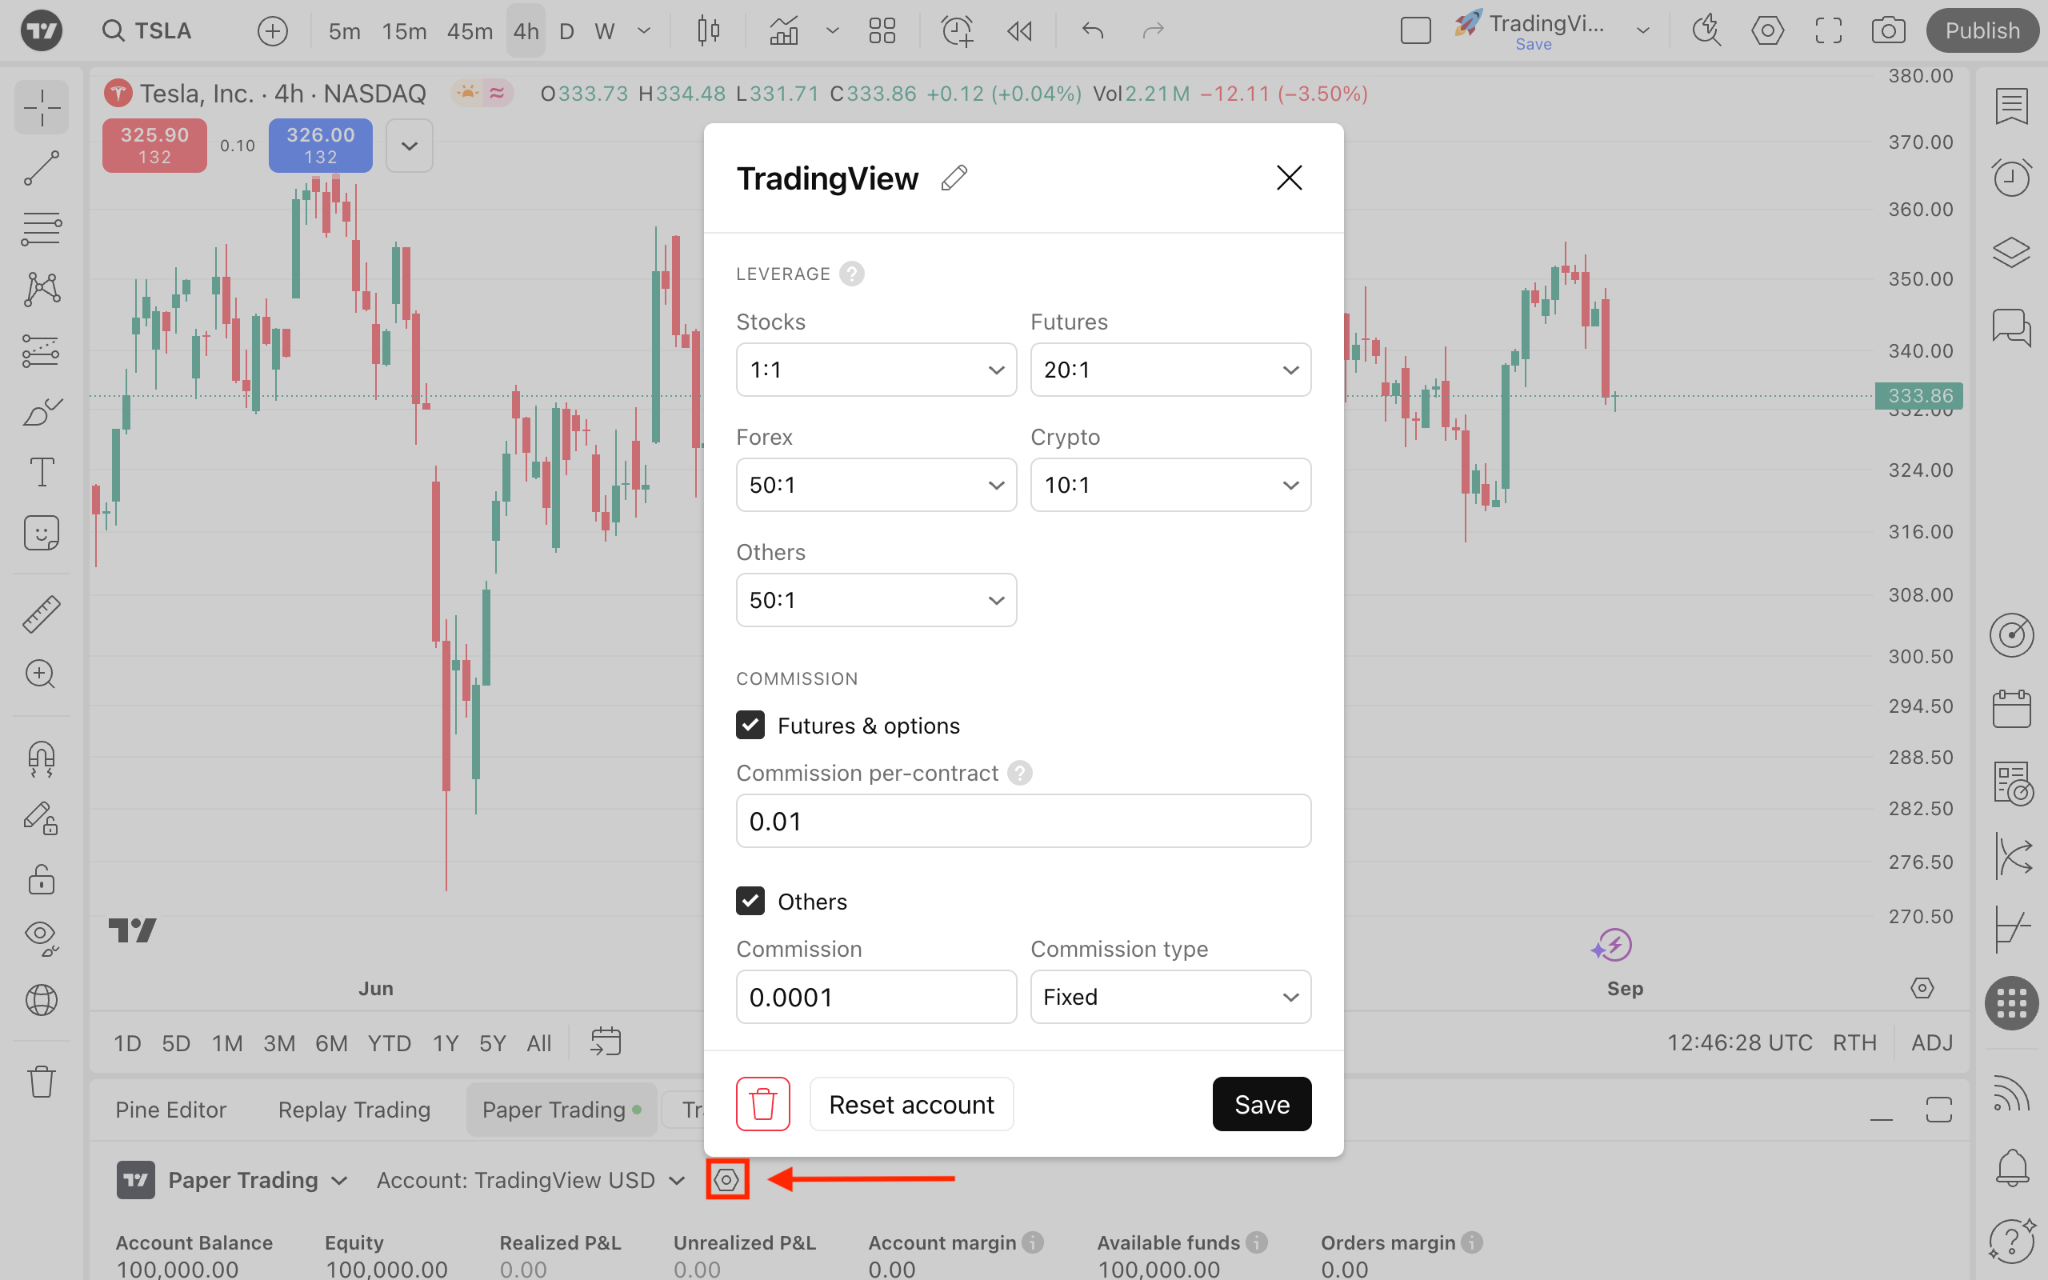
At the bottom of the TradingView chart, open the Trading Panel and select Paper Trading. Connect the simulated account rather than a live broker account.
If you have not yet created an account, create one with a name such as:
Course Practice — GBP
Use GBP as the base currency because it is the currency in which you will judge position size and results during this course. Set an initial balance that you will retain throughout a practice sequence. Consistency matters more than the number itself.
Start with conservative simulation settings
For this course, use these defaults:
| Setting | Starting choice | Why |
|---|---|---|
| Account currency | GBP | Keeps results readable in your evaluation currency |
| Stock leverage | Avoids borrowing while you learn the mechanics | |
| Crypto leverage | Avoids turning volatility into amplified account risk | |
| Commission | Set only if you know a plausible fee assumption | A made-up “precise” fee is less useful than a clearly documented assumption |
| Starting balance | Stable throughout a practice sequence | Allows later comparison of risk and performance |
| Live broker connection | Do not connect | This is a simulation environment |
Paper Trading can display execution cleanly even in conditions where a real order would experience wider spreads, delayed fills, partial fills, or larger slippage. Continue recording estimated friction in your written plan, especially for crypto, commodity products, and instruments outside their most liquid trading hours.
Also keep the distinction clear:
- A symbol visible on TradingView is not automatically tradable through every broker.
- A TradingView paper fill is not evidence that a live order would have filled at the same price.
- A paper account is useful for testing your process, not for proving a strategy profitable.
Perform a configuration audit
Before leaving the platform, verify the finished workspace:
- Watchlist: sections cover market context, US shares, UK shares, commodity exposure, and crypto spot.
- Symbols: each one has a known venue or provider, asset type, and quote currency.
- Research layout: daily candles, volume, visible OHLC information, and no distracting trade buttons.
- Alert: at least one active, clearly named review alert with an expiry date.
- Paper layout: connected to Paper Trading, not a live broker.
- Paper account: GBP base currency, conservative leverage, and commission assumptions documented.
- Account state: no accidental open positions or working orders.
A useful final habit is to create a short workspace note in your journal:
“Research layout: Daily candles plus volume. Paper account: GBP, leverage. Review alerts require chart inspection; they are not trade signals.”
This makes your assumptions visible before performance results tempt you to reinterpret them.
Key takeaways
A TradingView workspace should support consistent observation and disciplined simulation.
- A cross-asset watchlist helps you compare US and UK shares, commodity exposure, crypto, and currency context without confusing their different structures.
- Check the exchange, provider, instrument type, and quoted currency before adding a symbol.
- A layout is reusable workspace configuration, not a ticker-specific chart. It can retain the last symbol viewed.
- A daily research layout with candles, OHLC information, volume, and corporate events provides a stable base for the next modules.
- Alerts should prompt review at a defined condition; they should not serve as automatic trading instructions.
- A separate paper-trading layout makes order and account information visible while keeping research and execution workflows distinct.
- Begin paper trading with a GBP account, leverage, and explicit assumptions about commissions and other costs.
Next, the course moves from market workflow into fundamental analysis. You will learn to extract revenue, operating profit, net income, operating cash flow, and free cash flow from company financial statements—and distinguish reported profit from actual cash generation.
Can't find a good explanation? Sign up and we'll make it for you
Sign up